Caution
This article references CentOS, a Linux distribution that is nearing End Of Life (EOL) status. Please consider your use and plan accordingly. For more information, see the CentOS End Of Life guidance.
This article briefly describes the steps for running CPFD's Barracuda Virtual Reactor on a virtual machine (VM) that's deployed on Azure. It also presents the performance results of running Virtual Reactor on Azure.
Virtual Reactor simulates the 3D transient behavior in fluid-particle systems, including multiphase hydrodynamics, heat balance, and chemical reactions.
Virtual Reactor has these capabilities:
- Uses the Lagrangian formula for the particulate phase, which allows inclusion of discrete particle properties, including the particle size distribution (PSD), composition, temperature, residence time, and history.
- Provides directional particle filtering through baffles and a GUI.
Barracuda is most widely used in the oil-refining, petrochemical, energy, and mineral-processing industries, including the clean energy sector in the production of electricity, gas, and liquid fuels from coal and biomass.
Why deploy Virtual Reactor on Azure?
- Modern and diverse compute options to align to your workload's needs
- The flexibility of virtualization without the need to buy and maintain physical hardware
- Rapid provisioning
- For simulations with high particle counts, impressive scaling as GPUs are added
Architecture

Download a Visio file of this architecture.
Components
- Azure Virtual Machines is used to create a Linux VM. For information about deploying the VM and installing the drivers, see Linux VMs on Azure.
- Azure Virtual Network is used to create a private network infrastructure in the cloud.
- Network security groups are used to restrict access to the VM.
- A public IP address connects the internet to the VM.
- A physical solid-state drive (SSD) is used for storage.
Compute sizing and drivers
Performance tests of Virtual Reactor on Azure used ND_A100_v4, NCv3, NCasT4_v3, NDm_A100_v4, and NC_A100_v4-series VMs running Linux. The following table provides details.
| VM size | vCPU | Memory (GiB) | SSD (GiB) | GPU | GPU memory (GiB) | Maximum data disks |
|---|---|---|---|---|---|---|
| Standard_ND96asr_v4 | 96 | 900 | 6,000 | 8 A100 | 40 | 32 |
| Standard_NC24s_v3 | 24 | 448 | 2,948 | 4 V100 | 64 | 32 |
| Standard_NC64as_T4_v3 | 64 | 440 | 2,880 | 4 T4 | 64 | 32 |
| Standard_ND96amsr_A100_v4 | 96 | 1900 | 6400 | 8 A100 80 GB with NVLink 3.0 | 80 | 32 |
| Standard_NC96ads_A100_v4 | 96 | 880 | 4492 | 4 | 320 | 32 |
Required drivers
To take advantage of the GPU capabilities of ND_A100_v4, NCv3, NCasT4_v3, NDm_A100_v4, and NC_A100_v4-series VMs, you need to install NVIDIA GPU drivers.
Virtual Reactor installation
Before you install Virtual Reactor, you need to deploy and connect a Linux VM and install the required NVIDIA drivers. The Virtual Reactor 21.1.0 and 22.0.0 versions were tested on the following VMs.
| VM | Virtual Reactor 21.1.0 | Virtual Reactor 22.0.0 |
|---|---|---|
| Standard_ND96asr_v4 | ✅ | ❌ |
| Standard_NC24s_v3 | ✅ | ❌ |
| Standard_NC64as_T4_v3 | ✅ | ❌ |
| Standard_ND96amsr_A100_v4 | ❌ | ✅ |
| Standard_NC96ads_A100_v4 | ❌ | ✅ |
Important
NVIDIA Fabric Manager installation is required for VMs that use NVLink or NVSwitch. NDv4-series VMs use NVLink.
For information about deploying the VM and installing the drivers, see Run a Linux VM on Azure.
You can install Virtual Reactor from the CPFD downloads page. For information about the installation process, see CPFD customer support.
Virtual Reactor 21.1.0 performance results
Particle-based fluid dynamics simulations were run to test Virtual Reactor. The following table provides details about the operating system and NVIDIA drivers that were used.
| Operating system version | Operating system architecture | GPU driver version | Cuda version |
|---|---|---|---|
| CentOS Linux release 8.1.1911 (Core) | x86-64 | 470.57.02 | 11.4 |
A number of test cases were run. The following table provides details.
| Test case number | Cell count | Number of particles | Chemistry | Thermal | P1 model |
|---|---|---|---|---|---|
| 479 | 243,267 | 29,920,300 | Enabled | Enabled | Disabled |
| 499 | 243,267 | 3,581,140 | Enabled | Enabled | Disabled |
| 480 | 105,157 | 40,581,300 | Disabled | Disabled | Disabled |
| 500 | 105,157 | 9,528,670 | Disabled | Disabled | Disabled |
| 481 | 389,320 | 50,170,500 | Enabled | Enabled | Disabled |
| 501 | 389,320 | 12,994,400 | Enabled | Enabled | Disabled |
| 482 | 821,781 | 55,070,200 | Enabled | Enabled | Disabled |
| 502 | 821,781 | 22,625,700 | Enabled | Enabled | Disabled |
Results on NDv4
Results are presented in seconds.
| Test case number | 479 | 480 | 481 | 482 | 499 | 500 | 501 | 502 |
|---|---|---|---|---|---|---|---|---|
| CPU | 422.55 | 755.8 | 755.8 | 1,258.1 | 92.92 | 222.81 | 594.3 | 601.59 |
| 1 GPU1 | 2.92 | 12.7 | 12.7 | 13.8 | 1.453 | 2.63 | 9.57 | 6.59 |
| 2 GPU1 | 2.85 | 7.4 | 7.4 | 7.4 | 1.358 | 1.8 | 6.38 | 4.57 |
| 3 GPU1 | 2.68 | 5.4 | 5.4 | 6.1 | 1.629 | 1.61 | 5.65 | 4.49 |
| 4 GPU1 | 3.35 | 4.6 | 4.6 | 7.8 | 1.845 | 1.71 | 5.41 | 4.44 |
| 5 GPU1 | 3.35 | 4.5 | 4.5 | 8 | 2.189 | 1.83 | 5.86 | 5.39 |
| 6 GPU1 | 3.67 | 4.8 | 4.8 | 8 | 2.908 | 2.36 | 6.21 | 6.46 |
| 7 GPU1 | 4.17 | 4.6 | 4.6 | 9.6 | 3.433 | 2.69 | 8.56 | 6.63 |
| 8 GPU | 4.62 | 4.6 | 4.6 | 9 | 3.971 | 3.01 | 8.12 | 7.93 |
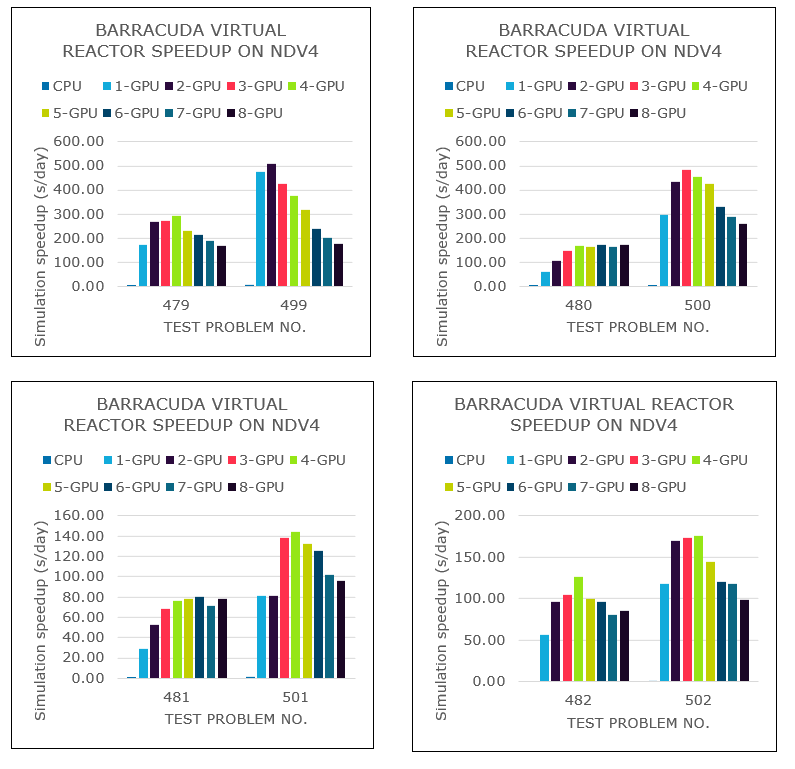
The following table and graph show speed increases, in seconds of chemical reaction completed per day, for each configuration.
| Test case number | 479 | 480 | 481 | 482 | 499 | 500 | 501 | 502 |
|---|---|---|---|---|---|---|---|---|
| CPU | 1.84 | 1.03 | 0.49 | 0.62 | 7.44 | 3.49 | 1.31 | 1.29 |
| 1 GPU1 | 172.10 | 61.10 | 29.37 | 56.11 | 475.84 | 295.82 | 81.31 | 118.05 |
| 2 GPU1 | 266.81 | 104.80 | 52.80 | 96.60 | 509.10 | 433.26 | 81.31 | 170.29 |
| 3 GPU1 | 272.85 | 145.75 | 68.53 | 105.11 | 424.87 | 482.75 | 137.87 | 173.19 |
| 4 GPU1 | 290.68 | 168.87 | 75.92 | 126.11 | 375.23 | 454.95 | 144.20 | 175.39 |
| 5 GPU1 | 232.16 | 162.10 | 77.81 | 99.79 | 316.32 | 426.85 | 132.83 | 144.44 |
| 6 GPU1 | 211.66 | 172.31 | 79.69 | 96.47 | 238.60 | 329.83 | 125.22 | 120.73 |
| 7 GPU1 | 186.82 | 163.73 | 71.68 | 81.18 | 201.66 | 289.21 | 101.61 | 117.47 |
| 8 GPU | 168.21 | 171.39 | 78.23 | 85.89 | 174.89 | 258.41 | 96.02 | 98.20 |
1. In these cases, the number of GPUs was artificially limited. This VM has eight GPUs.
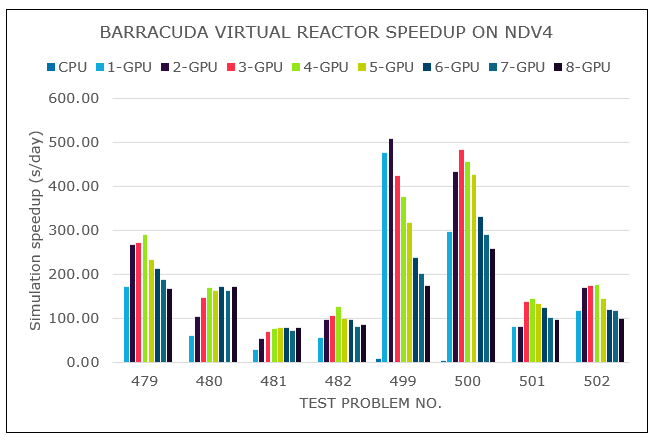
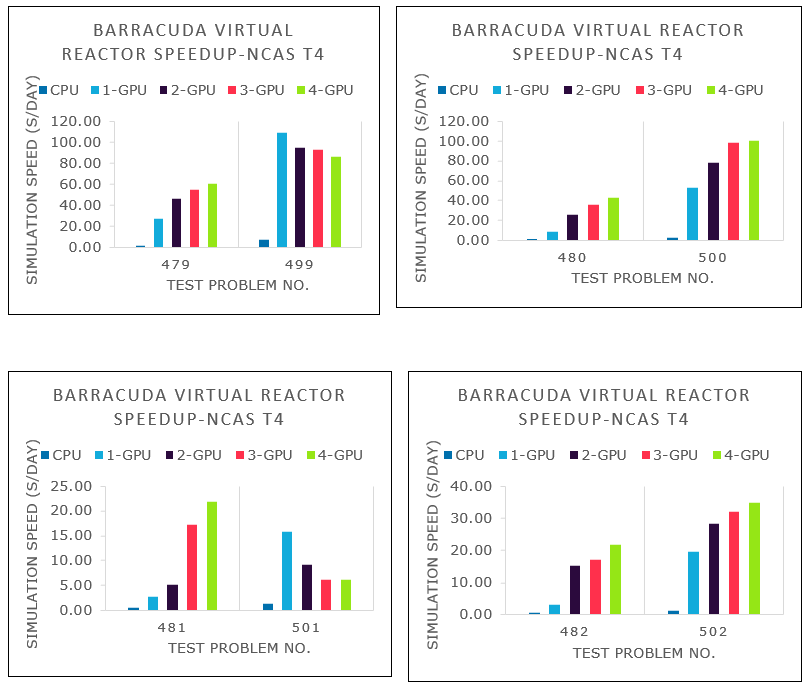
These graphs provide comparisons of models that are similar but have different particle counts:
Results on NCv3
Results are presented in seconds.
| Test case number | 479 | 480 | 481 | 482 | 499 | 500 | 501 | 502 |
|---|---|---|---|---|---|---|---|---|
| CPU | 595.68 | 1,146.1 | 5,327.5 | 1,768.7 | 113.751 | 335.73 | 772.93 | 678.59 |
| 1 GPU2 | 8.8 | 55 | 216.3 | 183.2 | 2.17 | 5.19 | 17.2 | 12.88 |
| 2 GPU2 | 8.03 | 12.5 | 49.9 | 22.7 | 5.217 | 5.2 | 24.37 | 13.8 |
| 3 GPU2 | 8.06 | 10.1 | 46 | 20.8 | 5.708 | 4.31 | 29.68 | 12.88 |
| 4 GPU | 8.07 | 9.5 | 67.1 | 19.1 | 6.61 | 4.84 | 35.98 | 13.93 |
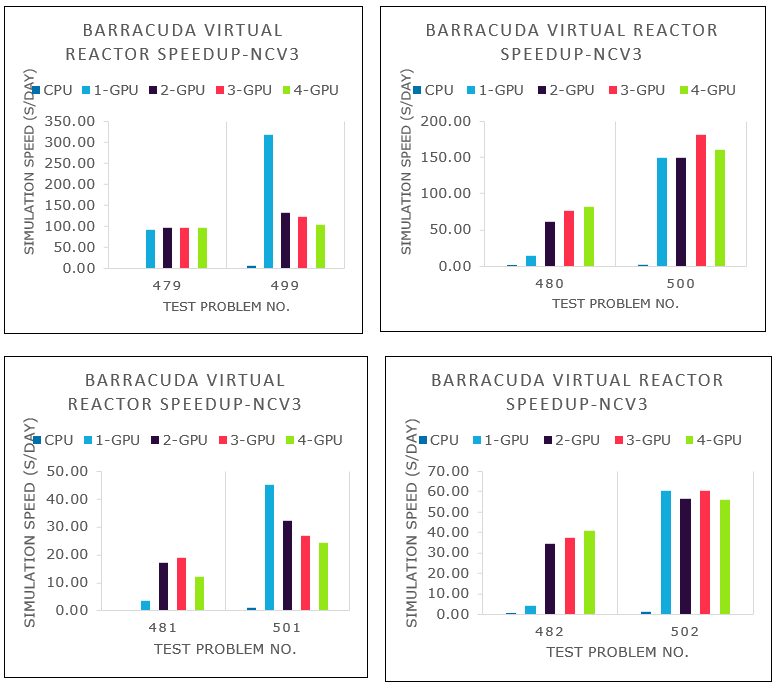
The following table and graph show speed increases, in seconds of chemical reaction completed per day, for each configuration.
| Test case number | 479 | 480 | 481 | 482 | 499 | 500 | 501 | 502 |
|---|---|---|---|---|---|---|---|---|
| CPU | 1.31 | 0.68 | 0.24 | 0.44 | 6.08 | 2.32 | 1.01 | 1.15 |
| 1 GPU2 | 91.28 | 14.14 | 3.60 | 4.25 | 317.20 | 149.69 | 45.20 | 60.38 |
| 2 GPU2 | 96.82 | 61.91 | 17.18 | 34.33 | 132.88 | 149.65 | 32.40 | 56.41 |
| 3 GPU2 | 96.62 | 76.89 | 18.84 | 37.51 | 122.35 | 180.74 | 27.03 | 60.45 |
| 4 GPU | 96.45 | 82.22 | 12.13 | 40.68 | 105.15 | 160.74 | 24.38 | 55.87 |
2. In these cases, the number of GPUs was artificially limited. NCv3 VMs are available with one, two, or four GPUs.
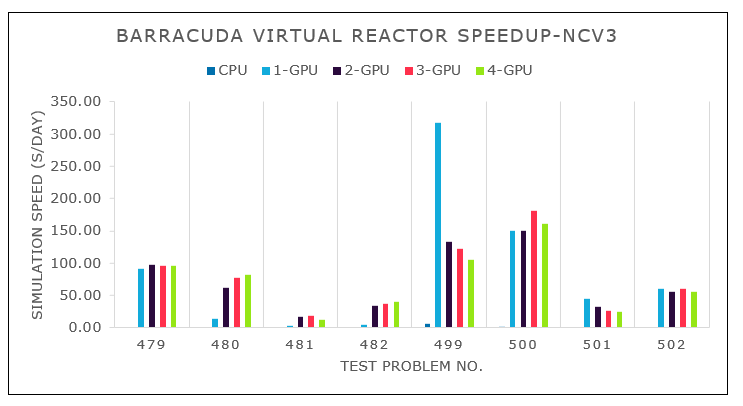
These graphs provide comparisons of models that are similar but have different particle counts:
Results on NCasT4_v3
Results are presented in seconds.
| Test case number | 479 | 480 | 481 | 482 | 499 | 500 | 501 | 502 |
|---|---|---|---|---|---|---|---|---|
| CPU | 439.31 | 789.6 | 1,673.1 | 1,266.5 | 96.427 | 251.59 | 609.31 | 609.34 |
| 1 GPU3 | 28.31 | 87.1 | 295.1 | 238 | 6.37 | 9.9 | 49.15 | 39.5 |
| 2 GPU3 | 16.82 | 29.9 | 163.6 | 50.7 | 7.271 | 7.95 | 87.51 | 27.47 |
| 3 GPU3 | 14.17 | 21.7 | 258.2 | 45.2 | 7.47 | 7.72 | 127.32 | 24.21 |
| 4 GPU | 12.73 | 18 | 351.1 | 35.4 | 8.025 | 7.72 | 128.35 | 22.34 |
The following table and graph show speed increases, in seconds of chemical reaction completed per day, for each configuration.
| Test case number | 479 | 480 | 481 | 482 | 499 | 500 | 501 | 502 |
|---|---|---|---|---|---|---|---|---|
| CPU | 1.77 | 0.98 | 0.47 | 0.61 | 7.17 | 3.09 | 1.28 | 1.28 |
| 1 GPU3 | 27.50 | 8.93 | 2.64 | 3.27 | 108.69 | 52.73 | 15.82 | 19.69 |
| 2 GPU3 | 46.23 | 26.00 | 5.08 | 15.32 | 95.26 | 78.55 | 9.19 | 28.30 |
| 3 GPU3 | 54.90 | 35.83 | 17.21 | 17.21 | 92.92 | 97.88 | 6.12 | 32.16 |
| 4 GPU | 61.07 | 43.13 | 21.95 | 21.95 | 86.39 | 100.70 | 6.07 | 34.86 |
3. In these cases, the number of GPUs was artificially limited. NCasT4_v3 VMs are available with one or four GPUs.
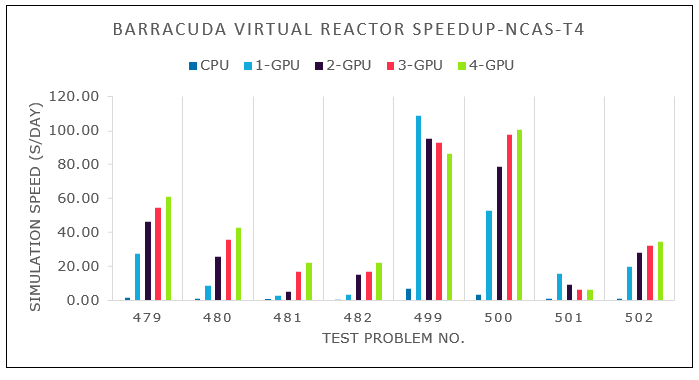
These graphs provide comparisons of models that are similar but have different particle counts:
Virtual Reactor 22.0.0 performance results
The following table provides details about the operating system and NVIDIA drivers that were used.
| Operating system version | Operating system architecture | GPU driver version | Cuda version |
|---|---|---|---|
| Linux - Centos HPC 8.1 gen 2 | x86-64 | 515.65.01 | 11.70 |
Several test models were run. The following table provides details.
| Test case number | Cell count | Number of particles | Chemistry | Thermal | P1 model |
|---|---|---|---|---|---|
| 479 | 243,267 | 29947600 | Enabled | Enabled | Disabled |
| 480 | 105157 | 40562000 | Disabled | Disabled | Disabled |
| 481 | 389320 | 50178300 | Enabled | Enabled | Disabled |
| 482 | 821781 | 54730600 | Enabled | Enabled | Disabled |
| 2Xres.00479 | 487322 | 60592200 | Enabled | Enabled | Disabled |
| 2Xres.00480 | 208458 | 79170000 | Disabled | Disabled | Disabled |
| 2Xres.00481 | 833411 | 109245000 | Enabled | Enabled | Disabled |
| 2Xres.00482 | 1670030 | 110418000 | Enabled | Enabled | Disabled |
Performance tests of Virtual Reactor on Azure NC_A100_v4 and NDm_A100_v4-series VMs running Linux. Model results are covered in the subsequent sections.
Results on NDm_A100_v4
Results are presented in seconds.
| Test case number | 479 | 480 | 481 | 482 | 2Xres.00479 | 2Xres.00480 | 2Xres.00481 | 2Xres.00482 |
|---|---|---|---|---|---|---|---|---|
| CPU | 426.40 | 1870.50 | 1758.04 | 1403.22 | 719.04 | 5727.00 | 6956.90 | 6689.70 |
| 1 GPU | 3.70 | 10.50 | 23.74 | 13.03 | 6.82 | 19.40 | 49.90 | 28.40 |
| 2 GPU | 2.90 | 6.10 | 13.88 | 8.37 | 4.37 | 10.60 | 28.30 | 17.00 |
| 3 GPU | 2.50 | 4.50 | 10.89 | 6.92 | 3.76 | 7.70 | 20.60 | 13.30 |
| 4 GPU | 2.50 | 4.10 | 9.14 | 6.25 | 3.18 | 6.90 | 17.50 | 11.70 |
| 5 GPU | 2.50 | 4.00 | 8.70 | 6.10 | 2.97 | 6.30 | 15.70 | 11.10 |
| 6 GPU | 2.60 | 3.70 | 7.82 | 5.84 | 3.06 | 5.50 | 14.00 | 10.10 |
| 7 GPU | 2.60 | 3.70 | 8.10 | 6.30 | 3.28 | 5.70 | 13.60 | 10.70 |
| 8 GPU | 2.70 | 3.70 | 7.91 | 5.84 | 3.14 | 5.60 | 12.90 | 10.70 |
The following table and graph show speed increase, in seconds of chemical reaction completed per day, for each configuration.
| Test case number | 479 | 480 | 481 | 482 | 2Xres.00479 | 2Xres.00480 | 2Xres.00481 | 2Xres.00482 |
|---|---|---|---|---|---|---|---|---|
| CPU | 1.62 | 0.46 | 0.44 | 0.55 | 0.84 | 0.20 | 0.13 | 0.18 |
| 1 GPU | 190.92 | 82.18 | 32.85 | 59.64 | 88.98 | 44.34 | 15.57 | 30.43 |
| 2 GPU | 240.94 | 141.72 | 56.16 | 92.85 | 138.67 | 81.03 | 27.55 | 50.78 |
| 3 GPU | 278.31 | 191.92 | 71.64 | 112.51 | 161.02 | 111.92 | 37.74 | 65.21 |
| 4 GPU | 282.70 | 207.17 | 85.21 | 124.38 | 190.44 | 125.01 | 44.55 | 74.15 |
| 5 GPU | 284.52 | 214.44 | 89.60 | 127.50 | 204.29 | 136.90 | 49.70 | 77.47 |
| 6 GPU | 269.43 | 232.31 | 99.64 | 133.15 | 198.25 | 154.82 | 55.68 | 86.32 |
| 7 GPU | 264.52 | 234.45 | 96.11 | 123.59 | 184.45 | 150.85 | 57.44 | 80.68 |
| 8 GPU | 257.80 | 230.81 | 98.43 | 133.25 | 192.84 | 154.42 | 60.29 | 80.91 |
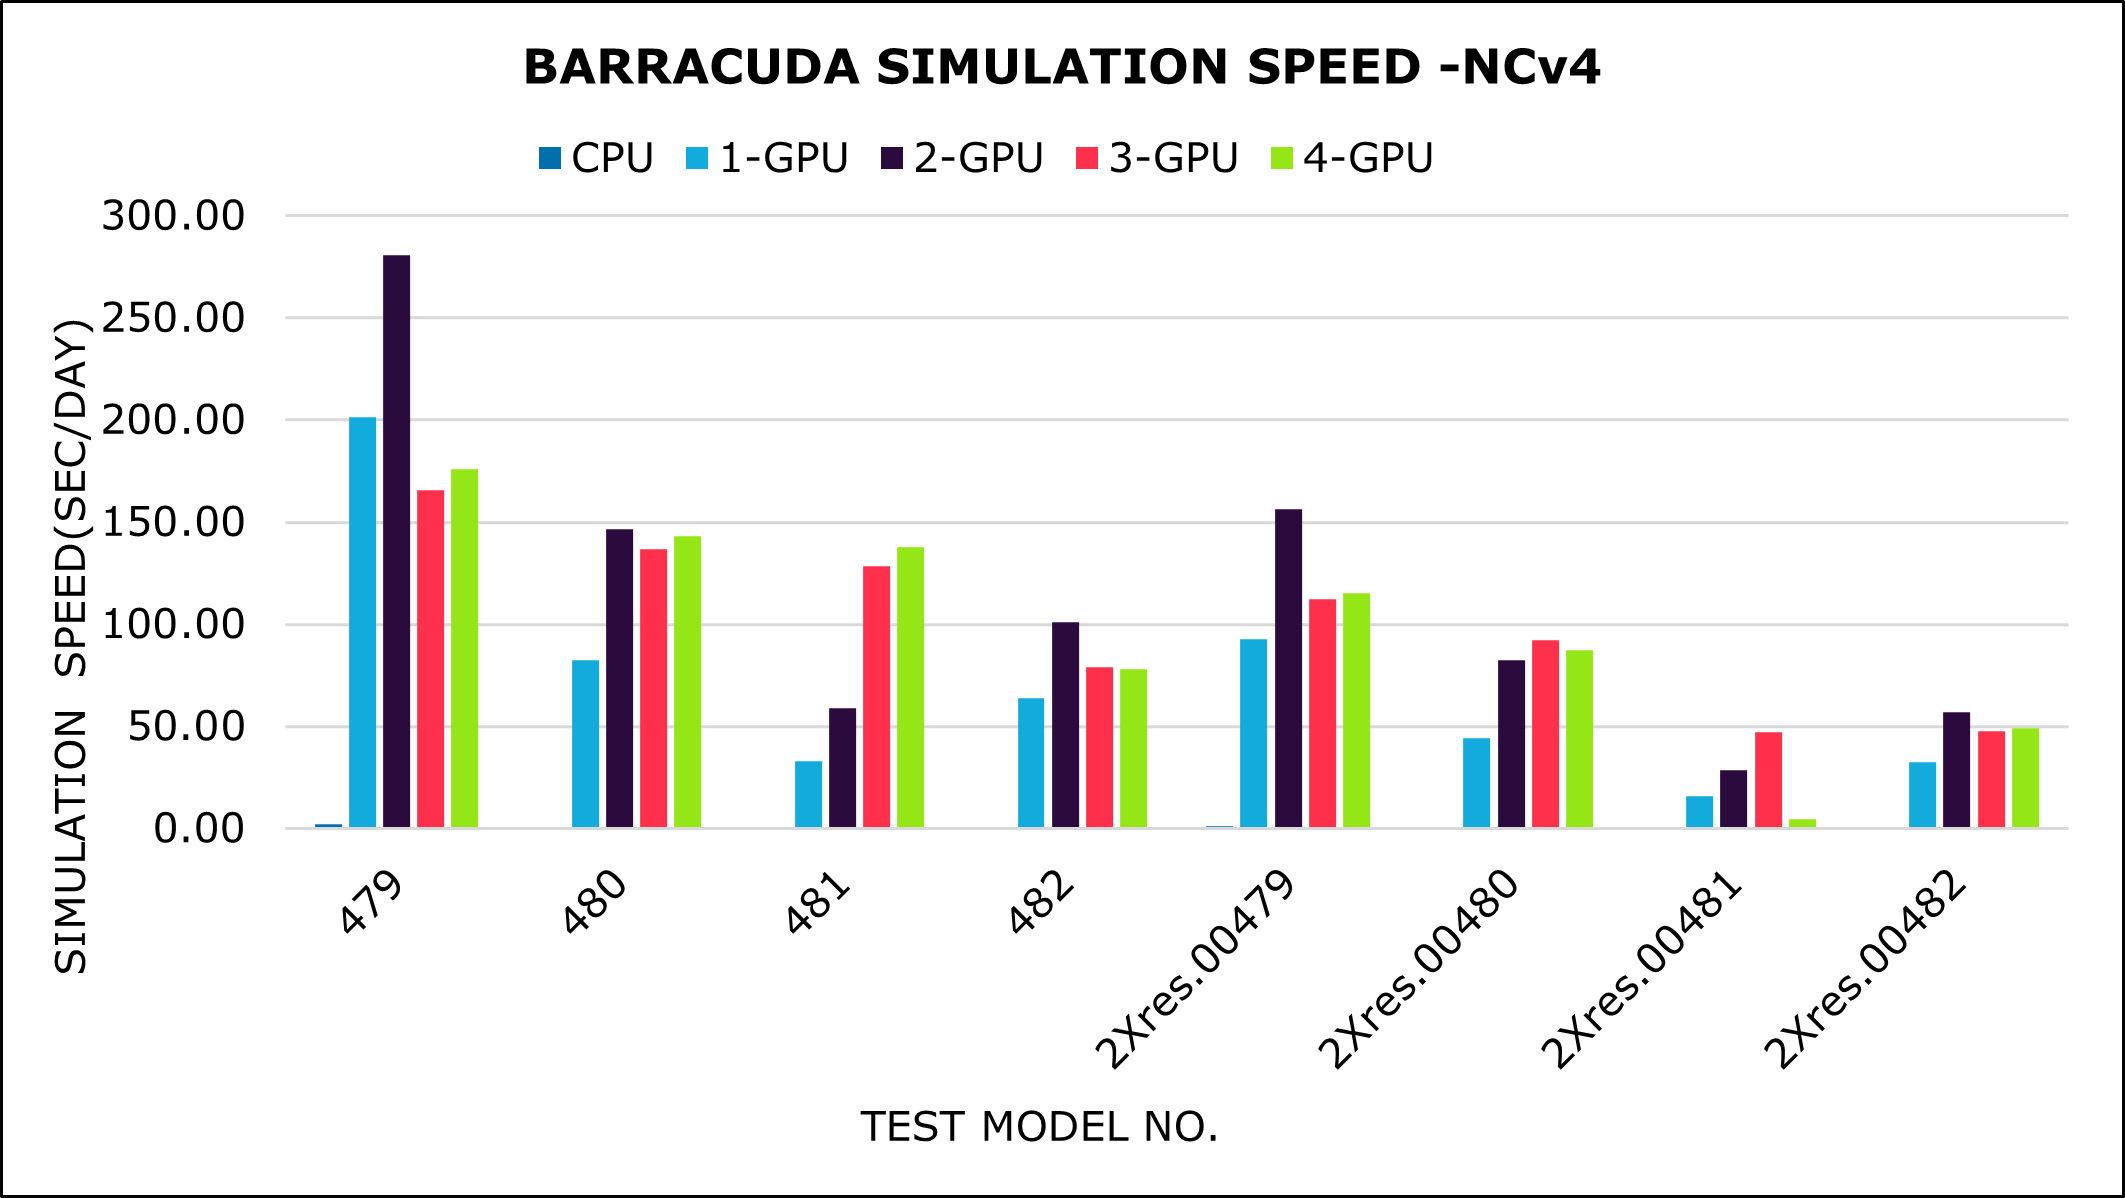
Results on NC_A100_v4
Results are presented in seconds.
| Test case number | 479 | 480 | 481 | 482 | 2Xres.00479 | 2Xres.00480 | 2Xres.00481 | 2Xres.00482 |
|---|---|---|---|---|---|---|---|---|
| CPU | 346.80 | 1758.90 | 1592.30 | 1114.20 | 636.37 | 5497.00 | 5803.40 | 2607.00 |
| 1 GPU | 3.50 | 10.40 | 23.56 | 12.21 | 6.53 | 19.50 | 49.40 | 26.50 |
| 2 GPU | 2.40 | 5.90 | 13.19 | 7.82 | 3.87 | 10.50 | 27.10 | 15.10 |
| 3 GPU | 4.20 | 6.30 | 17.19 | 9.84 | 5.39 | 9.40 | 219.00 | 18.10 |
| 4 GPU | 4.00 | 6.00 | 42.20 | 9.96 | 5.28 | 9.90 | 179.50 | 17.60 |
The following table and graph show speed increase, in seconds of chemical reaction completed per day, for each configuration.
| Test case number | 479 | 480 | 481 | 482 | 2Xres.00479 | 2Xres.00480 | 2Xres.00481 | 2Xres.00482 |
|---|---|---|---|---|---|---|---|---|
| CPU | 1.99 | 0.49 | 0.49 | 0.70 | 0.95 | 0.21 | 0.17 | 0.33 |
| 1 GPU | 201.42 | 82.50 | 33.09 | 63.71 | 92.81 | 44.31 | 15.76 | 32.61 |
| 2 GPU | 280.60 | 146.38 | 59.09 | 101.01 | 156.16 | 82.58 | 28.78 | 56.97 |
| 3 GPU | 165.59 | 136.94 | 128.23 | 79.06 | 112.29 | 92.35 | 47.11 | 47.88 |
| 4 GPU | 176.10 | 143.20 | 137.57 | 78.19 | 115.20 | 87.14 | 4.33 | 49.29 |
Additional notes about tests on Virtual Reactor 21.1.0
Virtual Reactor 21.1.0 was tested on NDv4, NCv3, and NCasT4_v3 VMs on Azure.
On the NDv4 VM, Virtual Reactor scales well up to four GPUs for the models with larger particle counts. For the models with smaller particle counts, it scales well up to two GPUs.
On the NCv3 VM, Virtual Reactor scales well up to three GPUs for the models with larger particle counts. For the models with smaller particle counts, it scales well only with the one-GPU configuration.
On the NCasT4_v3 VM, Virtual Reactor scales well up to four GPUs for the models with larger particle counts. For the models with smaller particle counts, it scales well only with the one-GPU configuration.
For simulations with large numbers of particles and cells, a single 16-GB GPU might not be sufficient because of memory requirements. In these cases, you must run simulations with two GPUs. For examples of this configuration, see the test case numbers 480, 481, and 482 on the NCv3 and NCasT4_v3 VMs.
For small simulations, sometimes there are performance penalties if you use all GPUs on an instance. Instead, you can run concurrent simulations and divide the GPUs between each instance. With this method, you can quickly explore multiple points in the simulation parameter space.
Additional notes about tests on Virtual Reactor 22.0.0
Virtual Reactor 22.0.0 was tested on NDm_A100_v4 and NC_A100_v4 VMs on Azure.
On the NDm_A100_v4 VM, Virtual Reactor scales well up to six GPUs for all models.
On the NC_A100_v4 VM, Virtual Reactor scales well up to four GPUs for model 481. All other models scale well up to two GPUs.
The AMD EPYC 7V13 (Milan) CPUs in the NC_A100_v4-series VMs are faster than the AMD EPYC 7V12 CPUs in the NDm_A100_v4-series VMs. If you want to run a model with only one or two GPUs, the 7V13 systems provide the fastest absolute performance.
The NC_A100_v4-series VMs had individual pairs of GPUs connected peer to peer, while the NDm_A100_v4-series VMs had full peer-to-peer connections between all GPUs. Therefore, you should use the NC_A100_v4-series VMs for simulations that run on one or two GPUs. But for simulations that need more than two GPUs, you should use the NDm_A100_v4-series VMs.
Azure cost
The following tables present wall-clock times that you can use to calculate Azure costs. You can multiply the times presented here by the Azure hourly rates for ND_A100_v4, NCsv3, NCasT4_v3, NDm_A100_v4, and NC_A100_v4-series VMs to calculate costs. For the current hourly costs, see Linux virtual machines pricing.
The times presented in the following tables represent the total elapsed time for running all eight of the tests described earlier in this document. Only the wall-clock time for running the test cases is considered for these cost calculations. Application installation time isn't considered. The times presented are indicative. The actual times depend on the size of the simulation. The elapsed times for full production-level test cases are higher than the results presented here, so the associated costs are higher.
You can use the Azure pricing calculator to estimate the costs for your configuration.
Cost for ND96asr_v4
| Number of GPUs | Elapsed time (hours) |
|---|---|
| 1 | 0.02 |
| 2 | 0.01 |
| 3 | 0.01 |
| 4 | 0.01 |
| 5 | 0.01 |
| 6 | 0.01 |
| 7 | 0.01 |
| 8 | 0.01 |
Cost for NC24s_v3
| Number of GPUs | Elapsed time (hours) |
|---|---|
| 1 | 0.14 |
| 2 | 0.04 |
| 3 | 0.04 |
| 4 | 0.05 |
Cost for NC64as_T4_v3
| Number of GPUs | Elapsed time (hours) |
|---|---|
| 1 | 0.21 |
| 2 | 0.11 |
| 3 | 0.14 |
| 4 | 0.16 |
Cost for NDm_A100_v4
| Number of GPUs | Elapsed time (hours) |
|---|---|
| 1 | 0.03 |
| 2 | 0.02 |
| 3 | 0.02 |
| 4 | 0.02 |
| 5 | 0.01 |
| 6 | 0.02 |
| 7 | 0.01 |
| 8 | 0.03 |
Cost for NC_A100_v4
| Number of GPUs | Elapsed time (hours) |
|---|---|
| 1 | 0.04 |
| 2 | 0.02 |
| 3 | 0.08 |
| 4 | 0.08 |
Contributors
This article is maintained by Microsoft. It was originally written by the following contributors.
Principal authors:
- Hari Bagudu | Senior Manager
- Sujata Bhagat | HPC Performance Engineer
- Gauhar Junnarkar | Principal Program Manager
- Vinod Pamulapati | HPC Performance Engineer
Other contributors:
- Mick Alberts | Technical Writer
- Guy Bursell | Director Business Strategy
- Sachin Rastogi | Manager
To see non-public LinkedIn profiles, sign in to LinkedIn.
Next steps
- GPU-optimized virtual machine sizes
- Virtual machines on Azure
- Virtual networks and virtual machines on Azure
- Learning path: Run high-performance computing (HPC) applications on Azure