Note
Access to this page requires authorization. You can try signing in or changing directories.
Access to this page requires authorization. You can try changing directories.
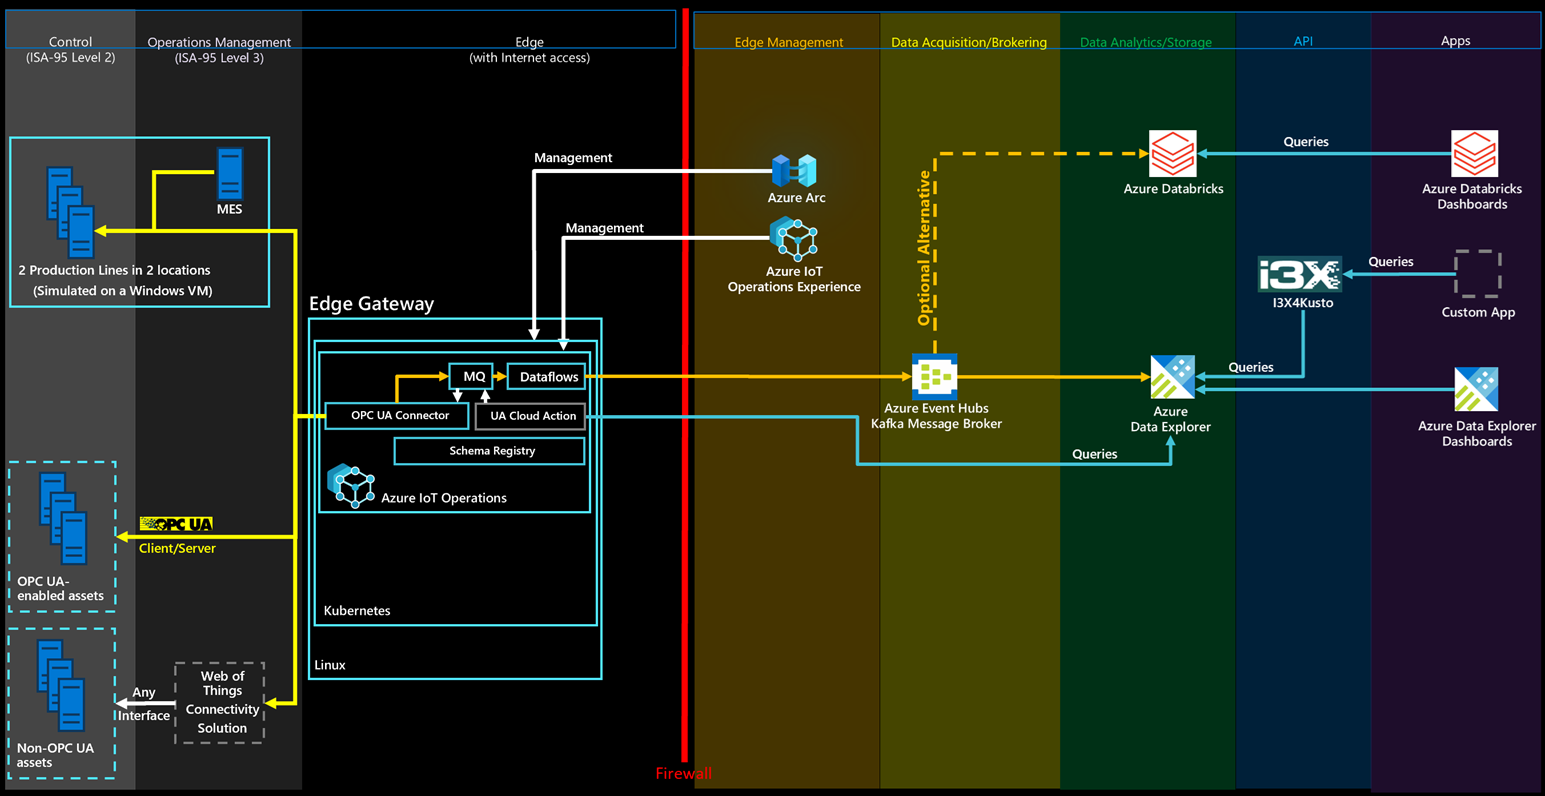
Azure Data Explorer is a fast, fully managed data analytics service for real-time analysis on large volumes of streaming data such as the OPC UA telemetry produced by this reference solution. It is purpose-built for time-series and log data, ingests millions of events per second with low latency, and lets you explore the data interactively using the powerful Kusto Query Language (KQL). Built-in capabilities for time-series analysis, pattern recognition, anomaly detection, and forecasting make it ideal for industrial use cases such as condition monitoring, overall equipment effectiveness (OEE) calculation, and predictive maintenance, and its native dashboards visualize the results without any extra tooling.
Automated deployment
Select the Deploy button to deploy all required resources to your Azure subscription:
Note
Please be patient! The deployment can take up to 100 minutes to complete. After the deployment is complete, you can access the VM via SSH using the credentials you provided during deployment.
Use cases for condition monitoring, OEE calculation, anomaly detection, and predictions in Azure Data Explorer
You can deploy a sample dashboard. To learn how to deploy a dashboard, see Visualize data with Azure Data Explorer dashboards > create from file. After you import the dashboard, update its data source. Specify the HTTPS endpoint of your Azure Data Explorer server cluster in the top-right corner of the dashboard. The HTTPS endpoint looks like: https://<ADXInstanceName>.<AzureRegion>.kusto.windows.net/.
To display the OEE for a specific shift, select Custom Time Range in the Time Range drop-down in the top-left corner of the Azure Data Explorer Dashboard and enter the date and time from start to end of the shift you're interested in.
The sample dashboard also includes a Unified NameSpace (UNS) / ISA-95 Graph tile that renders the Unified Namespace / ISA-95 asset hierarchy as an interactive node-link graph.
I3X API
An I3X API container app named <resourcesName>-i3x4kusto is deployed, exposing ADX over the I3X REST API. Its URL can be retrieved from the Azure portal and the Swagger endpoint is accessible by adding /swagger to its URL.
The I3X API is protected with HTTP Basic authentication. Every request (including the Swagger "Authorize" dialog and any I3X client) must supply the credentials you provided during deployment:
- Username: the
adminUsernameyou specified at deployment. - Password: the
adminPasswordyou specified at deployment.
The health/capabilities endpoint (GET /v1/info) and the Swagger UI itself remain accessible without credentials; all data endpoints require the Basic auth header (for example curl -u <adminUsername>:<adminPassword> https://<i3x-url>/v1/namespaces).
Run a query
Open your ADX database and select Queries. Because the telemetry Subject is the numeric DataSetWriterId, the station and production line are matched on the metadata DataSetName (built from the OPC UA server's ApplicationUri and NodeId) and then joined to the telemetry on Subject. Enter the following query in the text box, and select Run:
let _startTime = ago(1h);
let _endTime = now();
opcua_metadata_lkv
| where DataSetName contains "assembly"
| where DataSetName contains "munich"
| join kind=inner (
    opcua_telemetry
    | where Name == "Status"
    | where Timestamp > _startTime and Timestamp < _endTime
) on Subject
|  extend status = toint(Value)
| project Timestamp1, status
| sort by Timestamp1 desc
| render linechart