Note
Access to this page requires authorization. You can try signing in or changing directories.
Access to this page requires authorization. You can try changing directories.
Edge RAG publishes metrics to Azure Monitor to assess the performance of the deployed extension. These metrics are composed of numerical values within a sequential set of time-series data. They offer detailed insights into specific aspects of the extension at a particular point in time.
Important
Edge RAG Preview, enabled by Azure Arc is currently in PREVIEW. See the Supplemental Terms of Use for Microsoft Azure Previews for legal terms that apply to Azure features that are in beta, preview, or otherwise not yet released into general availability.
Prerequisites
Before you begin:
- If you want to use Azure Managed Grafana to visualize your metrics, configure an Azure Monitor data source plug-in.
- Review Edge RAG metrics available for monitoring.
Review the metrics visualizations
Build a chart with metrics for Edge RAG in the Azure portal or by using Azure Managed Grafana.
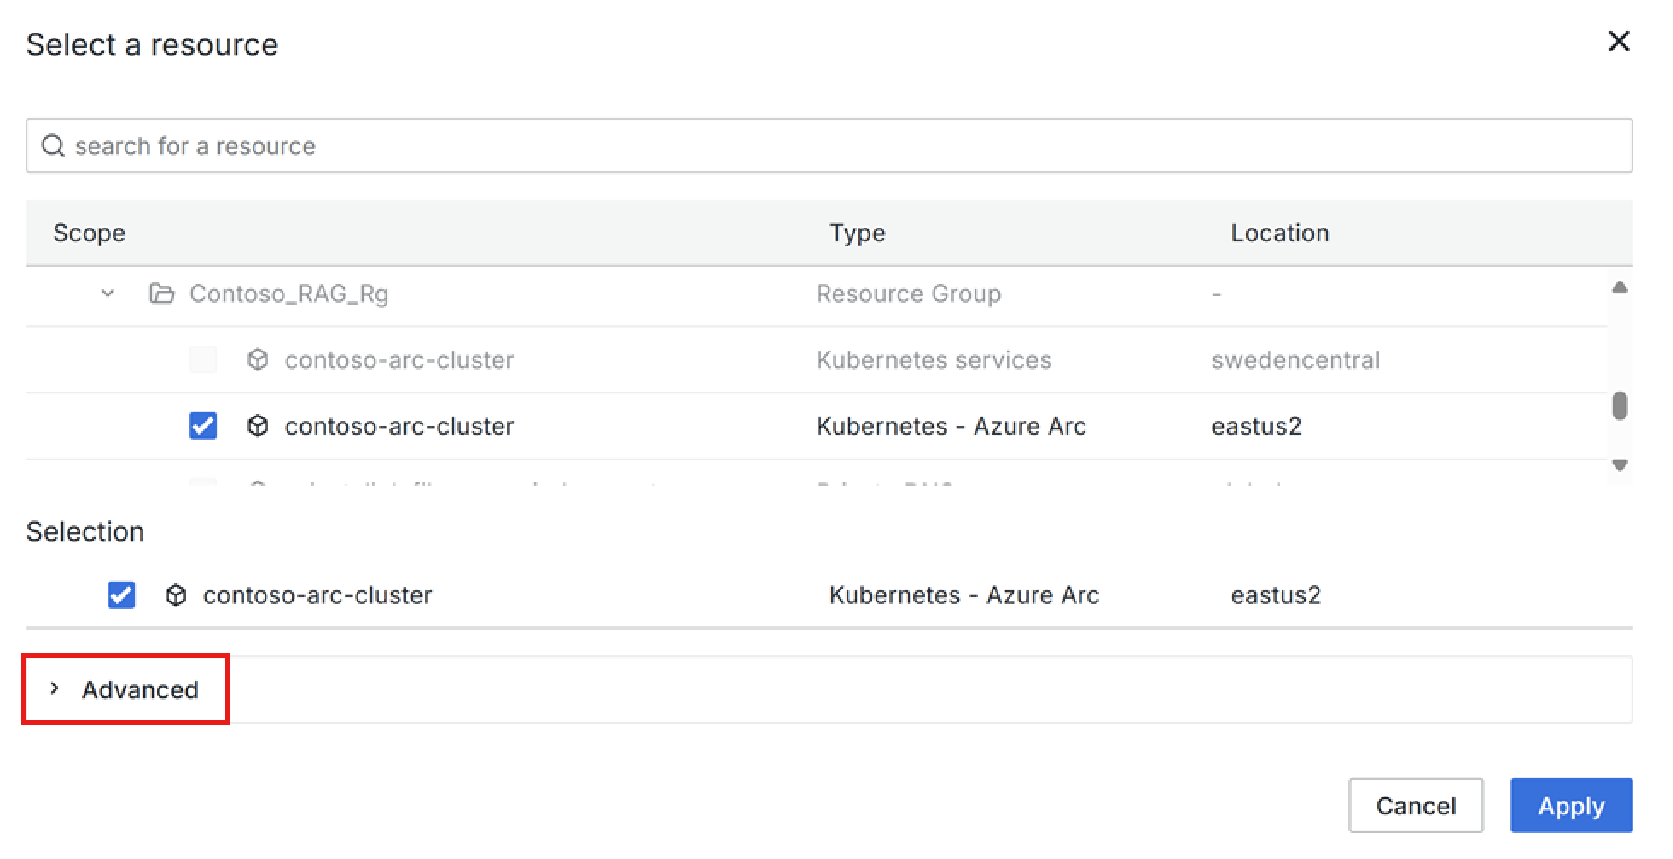
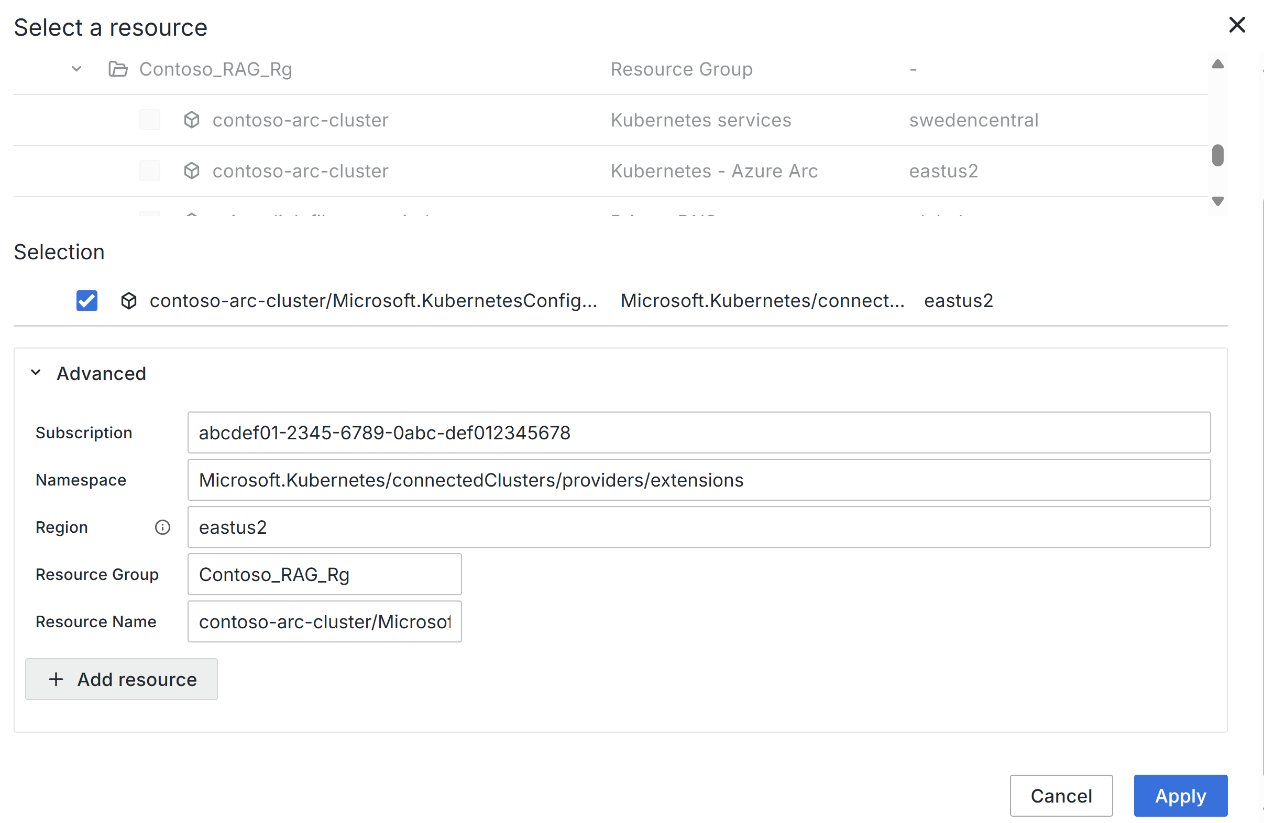
Go to the Extensions blade in the Azure portal: AKS cluster on Azure Local > Settings > Extensions.
Select the installed Edge RAG extension:
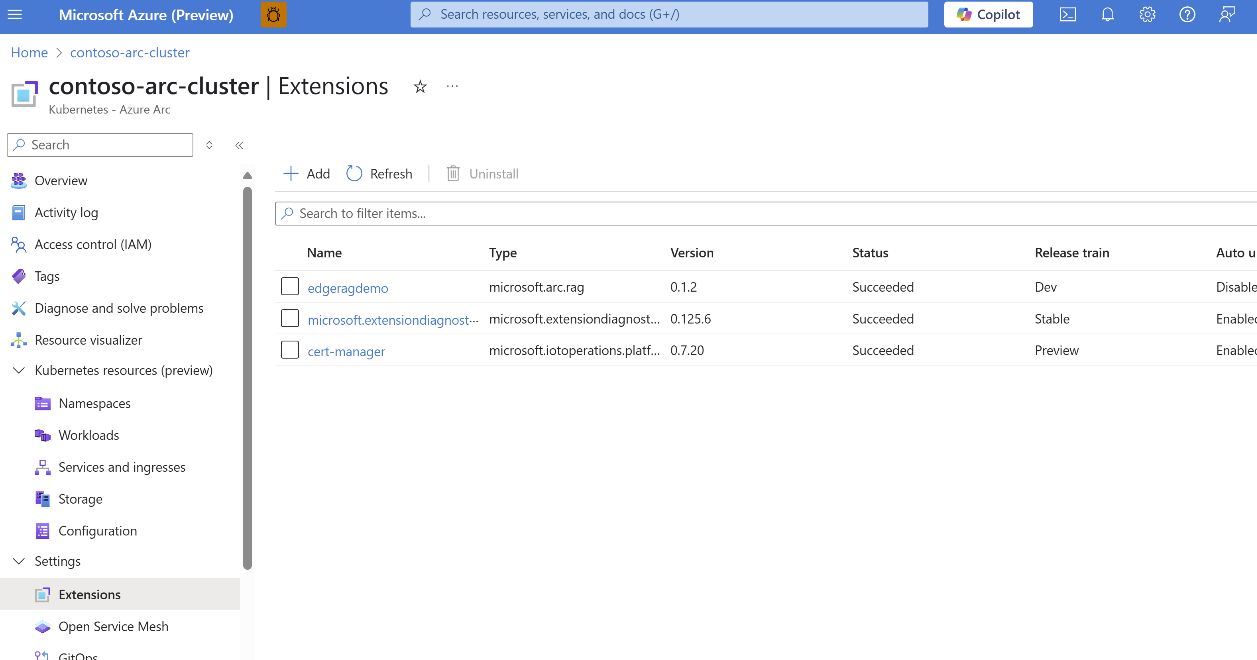
Go to the Monitoring section on the left pane and select Metrics.
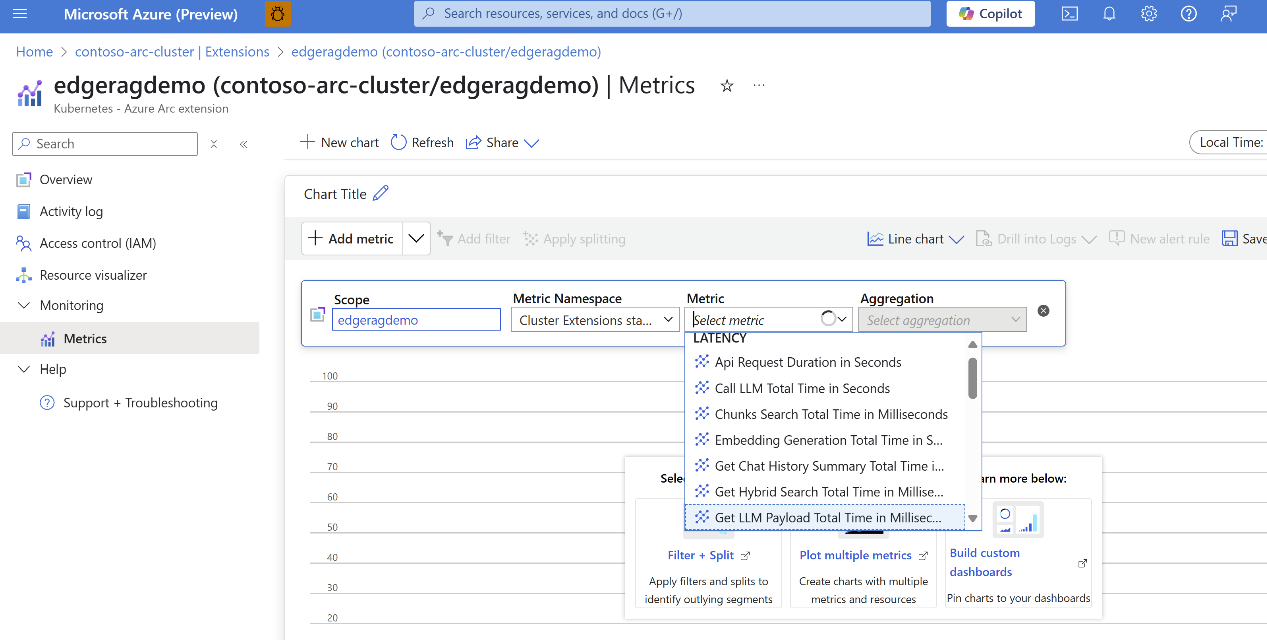
Select the Metric drop-down list to view the available metrics and build your chart.
The following image shows an example chart illustrating three distinct metrics recorded on specific dates.
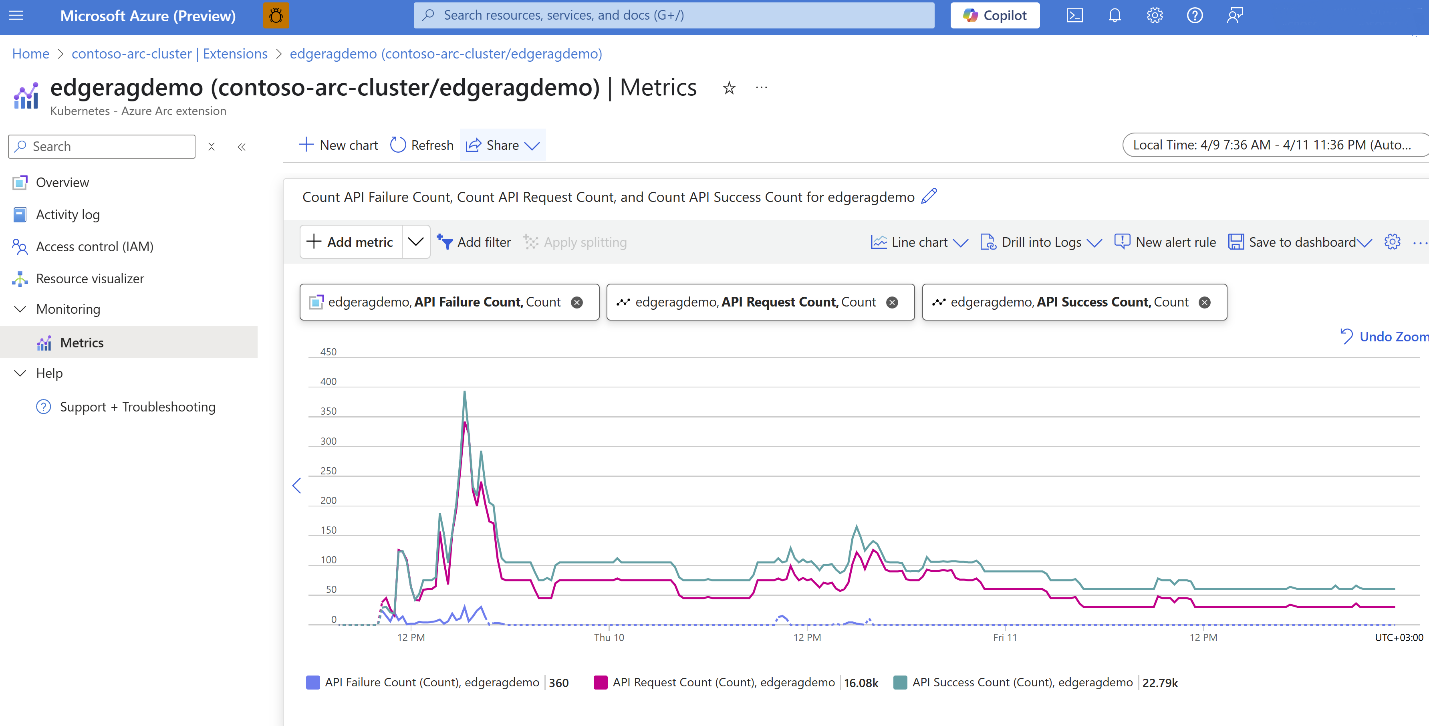
Interact with the chart by selecting Add filter or Apply splitting. For more information, see Use dimension filters and splitting.

Configure Infrastructure Monitoring
To configure infrastructure monitoring, see the following articles:
Azure CLI: Enable monitoring for Kubernetes clusters
Azure portal: Enable full monitoring with Azure portal
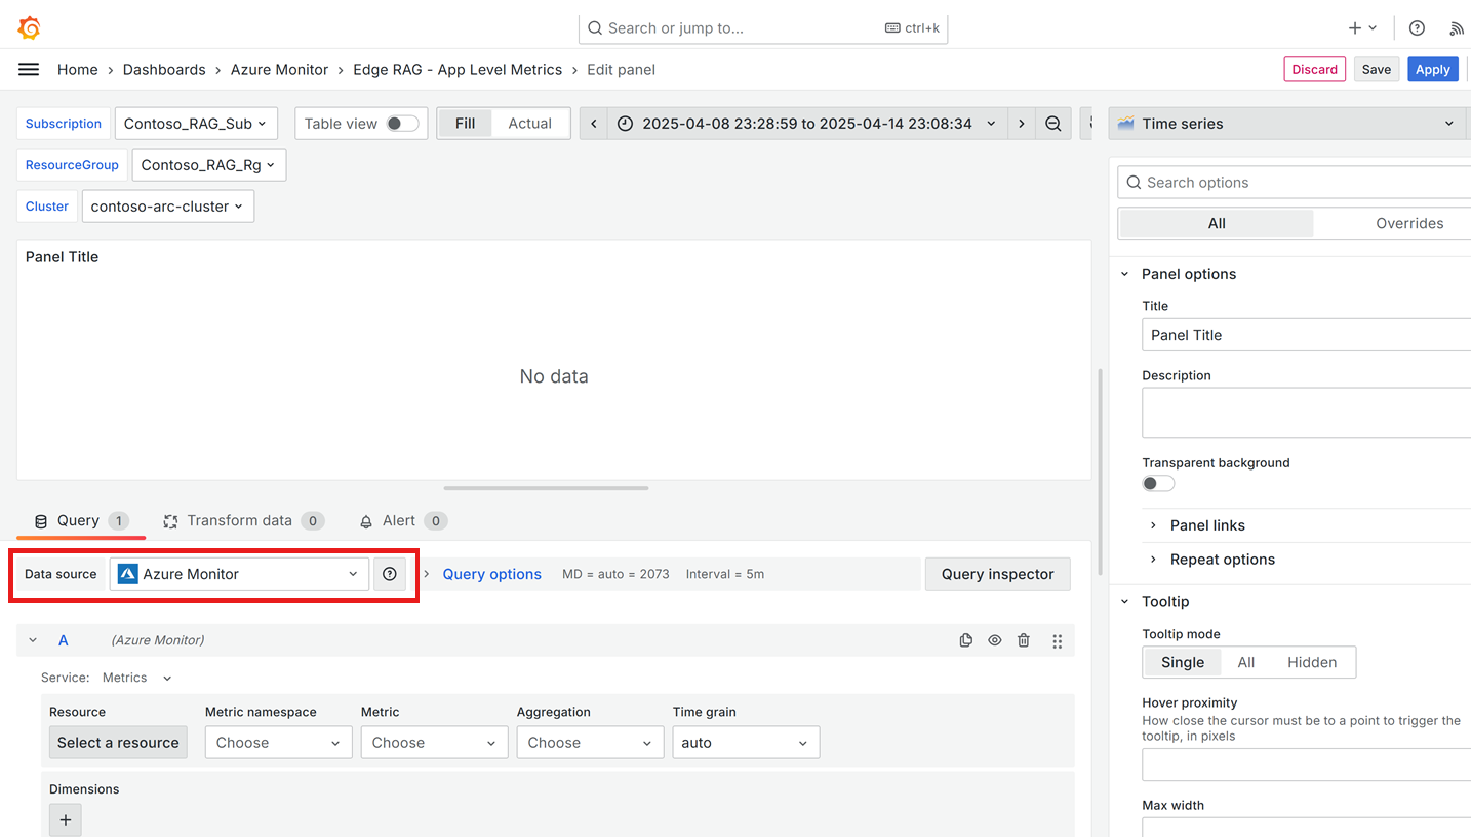
Visualize your metrics
Visualize your metrics by going to Azure Arc, Azure Monitor, or by using Azure Managed Grafana. For more information, see the following articles.
Azure Arc insights: Monitor your Kubernetes cluster performance with Container insights
Azure Monitor workspace: Azure Monitor metrics explorer with PromQL
Azure workbooks: Query Prometheus metrics using Azure workbooks
Azure Managed Grafana: Monitor your Azure services in Grafana