Note
Access to this page requires authorization. You can try signing in or changing directories.
Access to this page requires authorization. You can try changing directories.
This article describes how to diagnose workload orchestration logs and errors. It covers the different types of logs that can be collected or generated, how to enable workload orchestration audit and diagnostic logs, and how to collect container logs or Kubernetes events.
Prerequisites
- An Azure subscription. If you don't have an Azure subscription, create a free account.
- Set up your environment for workload orchestration. If you haven't, go to Prepare your environment for workload orchestration to set up the prerequisites.
Note
- Cloud extension 1.1.8: The latest version of the workload-orchestration CLI is 1.1.8. Download it here
- Arc extension 2.1.2: The latest version of the Microsoft.workloadorchestration is 2.1.2.
Log categories
The following table summarizes the different types of logs that can be collected or generated by workload orchestration, container insights, and OTLP (OpenTelemetry logs) or syslogs. Click on the links in the "Reference" column to learn how to diagnose these logs problems.
| Log Category | Purpose | Reference | Collected or Generated by | Destination | How to Query | Collect Scope | Send to User Space |
|---|---|---|---|---|---|---|---|
| Workload orchestration diagnostics logs emitted by workload orchestration extension | Monitor diagnostics information provided by workload orchestration extension on the edge, useful for troubleshooting end-to-end failures, like timeouts. | See Enable workload orchestration level auditing and diagnostic logs | Generated by workload orchestration extension | Diagnostics settings destination (storage account, Log Analytics workspace, etc.) | Query in Log Analytics workspace | Workload orchestration operations | Yes |
| Workload orchestration audit logs emitted by workload orchestration extension | Monitor invoking workload orchestration extension on the edge to modify workload orchestration objects or call workload orchestration extension API pod. | See Enable workload orchestration level auditing and diagnostic logs | Generated by workload orchestration extension | Diagnostics settings destination (storage account, Log Analytics workspace, etc.) | Query in Log Analytics workspace | Workload orchestration operations | Yes |
| Any container logs, Kubernetes events, or syslogs | Monitor container logs from any Kubernetes applications. | See Enable monitoring for Kubernetes clusters - Azure Monitor | Collected by Container Insights extension | Log Analytics workspace only | Query in Log Analytics workspace | All Kubernetes containers and Kubernetes events | Yes |
| Any OTLP (OpenTelemetry logs) or syslogs | Monitor OTLP (OpenTelemetry logs) or syslogs from any Kubernetes applications. | See Configuration of Azure Monitor pipeline at edge and multicloud - Azure Monitor | Collected by microsoft.monitor.pipelinecontroller extension | Log Analytics workspace only | Query in Log Analytics workspace | Any apps (in cluster / outside of cluster); configure OTEL/syslog | Yes |
Enable workload orchestration audit and diagnostic logs
Create a
Microsoft.Edge/Diagnosticsresource per each Azure Arc-enabled Kubernetes cluster.$diagnosticName = "default" az workload-orchestration diagnostic create ` --subscription $subId ` --resource-group $rg ` --diagnostic-name $diagnosticName ` --extended-location .\custom-location.json ` --location $locationCreate log analytics workspace, or use and existing one, to create a diagnostic setting.
$diagnosticLAId = "<your log analytics workspace resource id>"
$diagnosticResourceId = (az workload-orchestration diagnostic show `
                            --subscription $subId `
                            --resource-group $rg `
                            --diagnostic-name $diagnosticName `
                            --query id -o tsv)
az monitor diagnostic-settings create `
    --name diagSetting `
    --resource $diagnosticResourceId `
    --logs '[{"category":"UserAudits","enabled":true},{"category":"UserDiagnostics","enabled":true}]' `
    --workspace $diagnosticLAId
Note
If you set up a Log Analytics workspace for the first time, it might take significant time to be ready. For more information, see Diagnostic settings in Azure Monitor.
Go to Azure portal. In the search bar, type "Log Analytics workspaces" and select it. Select your log analytics workspace.
In the log analytics workspace, select Logs from the left-hand menu. In the query editor, select the Tables tab. You see two new tables: WOUserAudits and WOUserDiagnostics.
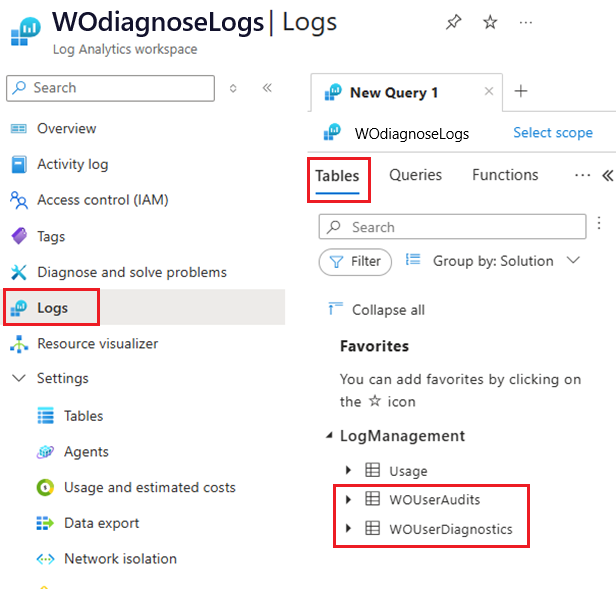
By querying WOUserAudits logs, you can inspect who manipulated the edge workload orchestration resource and if their operation is to pull chart or install chart on the on-premises cluster.
By querying WOUserDiagnostics logs, you can inspect the detailed error logs reported by the workload orchestration extension for workload orchestration operations (such as installation).
In the Queries tab, you have some built-in queries to search for workload orchestration log events.
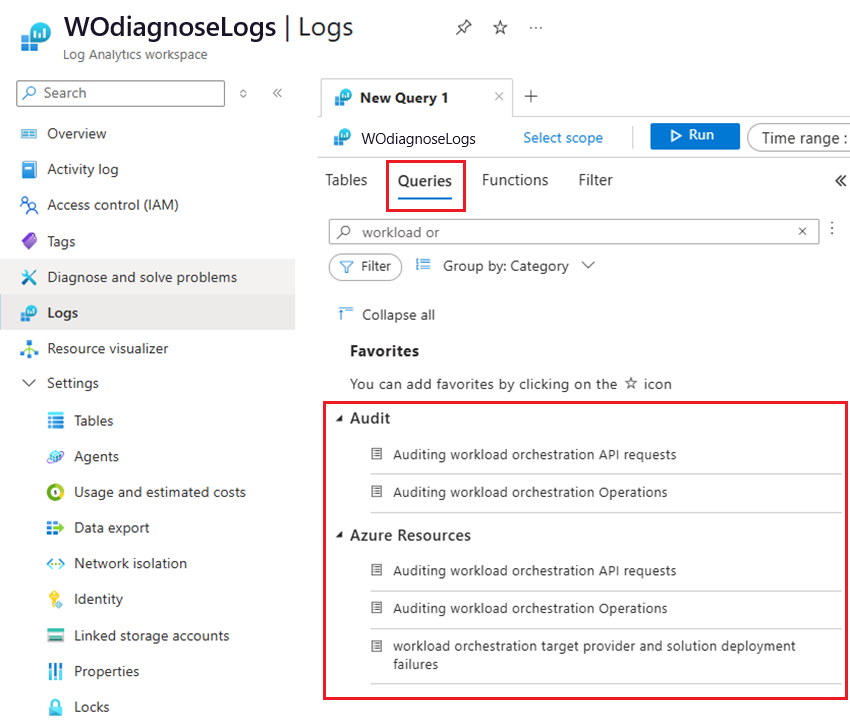
The following table describes the parameters you can use in the queries to filter the logs:
Parameter Data type Description TimeGenerated DateTime Event generation time. OperationName String Operation name of the event. Category String Category of the event. Location String Azure region in which the workload orchestration diagnostic resource is located. Properties Dynamic Properties of the event. OperatingResourceId String The operating resource ID refers to the specific operational resource that the workload orchestration is managing when this event is triggered. OperatingResourceK8SId String The operating resource K8s ID refers to K8s resource ID (namespace/name) of the specific operational resource that the workload orchestration is managing when this event is triggered. Message String The audit message. User Guid The Microsoft Entra ID object. ID of the requester. CorrelationId Guid Correlation ID of the operation. WOServiceName String Workload orchestration service name. WOServiceInstance String Workload orchestration service pod name. EdgeLocation String The Azure Edge custom location resource ID on which the operation happens. You can debug a workload orchestration operation by using the built-in query Workload orchestration target provider and solution deployment failures. This query helps you to identify logs errors from the edge service. The query is as follows:
WOUserDiagnostics
| where Message startswith "solution.(*SolutionManager).Reconcile" or Message contains ".Apply"
| order by EdgeLocation, TimeGenerated asc
| project EdgeLocation, TimeGenerated, User, Message, OperatingResourceId, OperatingResourceK8SId, OperationName
| take 100
You can audit a workload orchestration operation by using the built-in query Auditing workload orchestration operations. This query helps you to inspect who manipulated the edge WOM resource and if their operation is to pull chart or install chart on the on-premises cluster. The query is as follows:
WOUserAudits
| where Message !startswith_cs "Request"
| where OperatingResourceId contains "<your cluster ID>" # such as "subscriptions/<your subscription ID>/resourceGroups/<your resource group>/providers/Microsoft.Edge/targets/<your target resource name>/solutions/<your solution name>/instances/<your instance name>"
| order by EdgeLocation, TimeGenerated desc
| project EdgeLocation, TimeGenerated, User, Message, OperatingResourceId, OperatingResourceK8SId, OperationName
(Optional) You can turn off workload orchestration user-facing logs emission by running the following command:
# Delete diagnostics settings resource
az monitor diagnostic-settings delete `
    --name diagSetting `
    --resource $diagnosticResourceId

# Delete Microsoft.Edge/diagnostics resource
az workload-orchestration diagnostic delete `
   --subscription $subId `
   --resource-group $rg `
   --diagnostic-name $diagnosticName


Collect container logs or Kubernetes events
To collect container logs or Kubernetes events from the Azure Arc-enabled Kubernetes cluster you need to enable Container insights in Azure Monitor.
Once you have enabled Container insights, you can use the following commands to collect logs and events using an existing Log Analytics workspace.
### Use existing Log Analytics workspace
az k8s-extension create --name azuremonitor-containers --cluster-name <cluster-name> --resource-group <resource-group> --cluster-type connectedClusters --extension-type Microsoft.AzureMonitor.Containers --configuration-settings logAnalyticsWorkspaceResourceID=<workspace-resource-id>
Go to your Log Analytics workspace in the Azure portal. If you haven't already, follow the steps in Enable workload orchestration audit and diagnostic logs to see how.
To inspect your container logs, add the following query in the query editor with your cluster ID and pod namespace. You can see all console logs collected to the cloud, which can help you identify if the solution crashes due to a business logic error.
ContainerLogV2
| where _ResourceId contains "<your cluster ID>"
| where PodNamespace contains "<your pod namespace>"
To inspect Kubernetes events, add the following query in the query editor with your cluster ID You can see all Kubernetes events collected to the cloud, which can help you identify why the pod isn't started correctly, such as image pull fail, pod security context violation, persistent volume mounting issue, etc. In helm installation, you might only get a time-out error.
KubeEvents
| where _ResourceId contains "<your cluster ID>"
Enable workload orchestration level logs with one-click script
The following JSON file is a template that you can use to enable workload orchestration level logs. Modify the values in the JSON file to suit your environment and save it as workload-orchestration-script-logs.json.
{
  "common": {
    "resourceGroup": "<your resource group name>",
    "subId": "<your subscription ID>",
    "location": "eastus2",
    "tenantId": "72f988bf-86f1-41af-91ab-2d7cd011db47",
    "providerAppId": "cba491bc-48c0-44a6-a6c7-23362a7f54a9",
    "customLocationFile": "E:\\one\\Edge\\ConfigurationManager\\tools\\autoExtractedCustomLocation.json"
  },
  "infraOnboarding": {
    "arcLocation": "eastus2",
    "aksClusterIdentity": "Portal-Cluster-Identity",
    "aksClusterName": "Portal-Cluster",
    "customLocationName": "symphonycustest",
    "customLocationNamespace": "symphonycustest",
    "workloadOrchestrationWHL": "<path to workload_orchestration-1.1.5-py3-none-any.whl>",
    "contextResourceGroup": "Contoso",
    "contextName": "Contoso-Context",
    "contextSubscriptionId": "973d15c6-6c57-447e-b9c6-6d79b5b784ab",
    "contextLocation": "eastus2",
    "diagInfo": {
      "diagnosticWorkspaceId": "",
      "diagnosticResourceName": "default",
      "diagnosticSettingName": "default"
    }
  },
  "cmOnboarding": {
    "schemas": [
      {
        "name": "CommonSchemaNew",
        "version": "1.0.0",
        "schemaFile": "C:\\Users\\ndawkhar\\Downloads\\shared-schema2.yaml"
      },
      {
        "name": "testuser-SS",
        "version": "1.0.3",
        "schemaFile": "C:\\Users\\ndawkhar\\Downloads\\shared-schema2.yaml"
      }
    ],
    "configs": [
      {
        "name": "CommonConfig1",
        "versionName": "1.0.4",
        "configFile": "C:\\Users\\ndawkhar\\Downloads\\hotmelt-config-template2.yaml"
      }
    ],
    "solutions": [
      {
        "name": "testuser-S12",
        "description": "testuser-S1",
        "capabilities": [
          "ndawkhar-soap-newish"
        ],
        "version": "1.0.4",
        "configTemplate": "C:\\Users\\ndawkhar\\Downloads\\hotmelt-config-template2.yaml",
        "specificationFile": "C:\\Users\\ndawkhar\\Downloads\\specs2.json"
      },
      {
        "name": "testuser-S22",
        "description": "testuser-S2",
        "capabilities": [
          "ndawkhar-shampoo-newish"
        ],
        "version": "1.0.4",
        "configTemplate": "C:\\Users\\ndawkhar\\Downloads\\hotmelt-config-template2.yaml",
        "specificationFile": "C:\\Users\\ndawkhar\\Downloads\\specs2.json"
      }
    ]
  }
}


To create a new Arc cluster with workload orchestration level logs and `ContainerInsights` logs enabled, run the following PowerShell script:

```powershell
.\infra_onboarding.ps1 .\workload-orchestration-script-logs.json -enableWODiagnostics $true -enableContainerInsights $true -skipSiteCreation $true -skipRelationshipCreation $true
If you want to enable workload orchestration level logs on an existing onboarded Arc cluster, run the following PowerShell script. It creates a Log Analytics workspace, Microsoft.Edge/diagnostics resource, and diagnostic settings on Microsoft.Edge/diagnostics resource.
.\infra_onboarding.ps1 .\workload-orchestration-script-logs.json -skipAksCreation $true -enableWODiagnostics $true -skipSiteCreation $true -skipRelationshipCreation $true -skipTcoDeployment $true
If you want to enable workload orchestration level logs and kubernetes events on an existing onboarded Arc cluster, run the following PowerShell script. It creates a Log Analytics workspace, Microsoft.Edge/diagnostics resource, and installs the microsoft.azuremonitor.containers extension on your Arc cluster to collect container logs and kubernetes events.
.\infra_onboarding.ps1 .\workload-orchestration-script-logs.json -skipAksCreation $true -enableContainerInsights $true -skipSiteCreation $true -skipRelationshipCreation $true -skipTcoDeployment $true
Enable OpenTelemetry (OTLP) logs and syslogs
To enable OpenTelemetry (OTLP) logs and syslogs collection from your Arc Kubernetes cluster, follow these steps:
Install the
microsoft.monitor.pipelinecontrollerextension to collect OTLP (OpenTelemetry logs) or syslogs from your Arc Kubernetes cluster. See Configuration of Azure Monitor pipeline at edge and multicloud .Configure your applications to send logs to the Edge Monitor pipeline by specifying the service IP of the pipeline as the endpoint for syslog (TCP) or otellogs (gRPC). Update your application's logging configuration to use the following endpoints:
For syslog (TCP):
<edge pipeline resource name>.<edge pipeline namespace>.svc.cluster.local:514For otel (gRPC):
<edge pipeline resource name>.<edge pipeline namespace>.svc.cluster.local:4317
This ensures that your application's logs are collected and processed by the Edge Monitor pipeline.
Verify logs in the Log Analytics workspace:
For Otellogs from otel-log-app, use the following query in the Log Analytics workspace:
TestAppOtelLog_CL
| where Body !startswith "<"
| order by TimeGenerated asc
For syslogs from sys-log-app, use the following query in the Log Analytics workspace:
TestAppOtelLog_CL
| where Body startswith "<"
| order by TimeGenerated asc