Note
Access to this page requires authorization. You can try signing in or changing directories.
Access to this page requires authorization. You can try changing directories.
Azure Functions integrates with Application Insights to better enable you to monitor your function apps. Application Insights collects telemetry data generated by your function app, including information your app writes to logs. Application Insights integration is typically enabled when your function app is created. If your function app doesn't have the instrumentation key set, you must first enable Application Insights integration.
By default, the data collected from your function app is stored in Application Insights. In the Azure portal, Application Insights provides an extensive set of visualizations of your telemetry data. You can drill into error logs and query events and metrics. This article provides basic examples of how to view and query your collected data. To learn more about exploring your function app data in Application Insights, see What is Application Insights?
To be able to view Application Insights data from a function app, you must have at least Contributor role permissions on the function app. You also need to have the Monitoring Reader permission on the Application Insights instance. You have these permissions by default for any function app and Application Insights instance that you create.
To learn more about data retention and potential storage costs, see Data collection, retention, and storage in Application Insights.
Viewing telemetry in Monitor tab
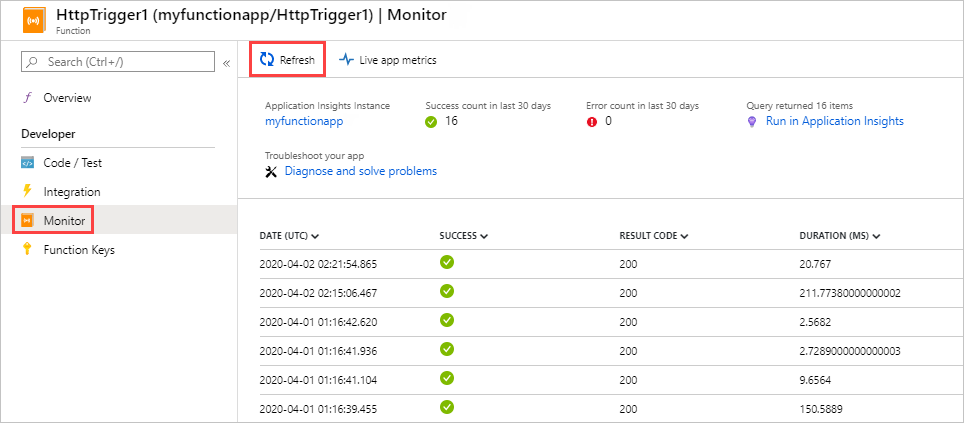
With Application Insights integration enabled, you can view telemetry data in the Monitor tab.
In the function app page, select a function that has run at least once after Application Insights was configured. Then, select Monitor from the left pane. Select Refresh periodically, until the list of function invocations appears.
Note
It can take up to five minutes for the list to appear while the telemetry client batches data for transmission to the server. The delay doesn't apply to the Live Metrics Stream. That service connects to the Functions host when you load the page, so logs are streamed directly to the page.
To see the logs for a particular function invocation, select the Date (UTC) column link for that invocation. The logging output for that invocation appears in a new page.
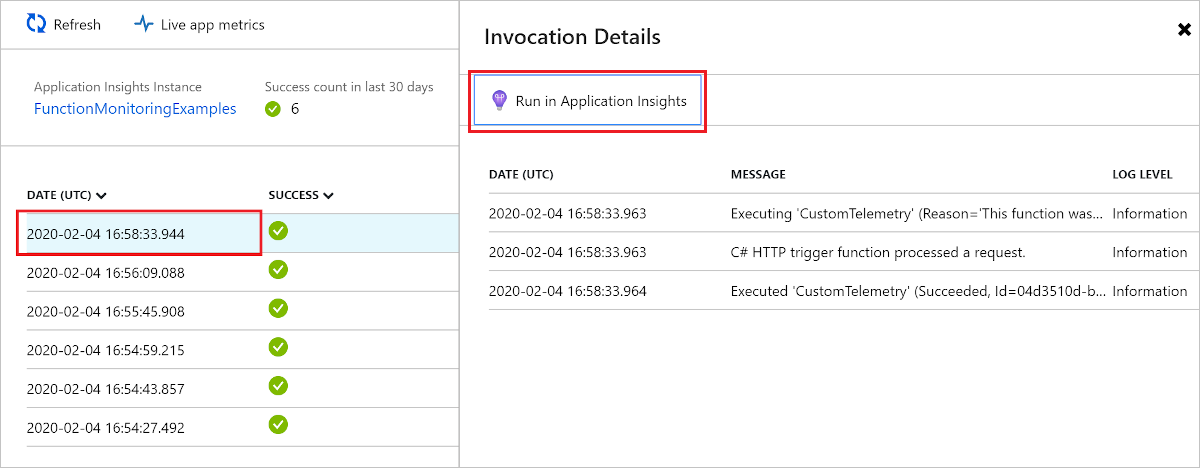
Choose Run in Application Insights to view the source of the query that retrieves the Azure Monitor log data in Azure Log. If this is your first time using Azure Log Analytics in your subscription, you're asked to enable it.
After you enable Log Analytics, the following query is displayed. You can see that the query results are limited to the last 30 days (
where timestamp > ago(30d)), and the results show no more than 20 rows (take 20). In contrast, the invocation details list for your function is for the last 30 days with no limit.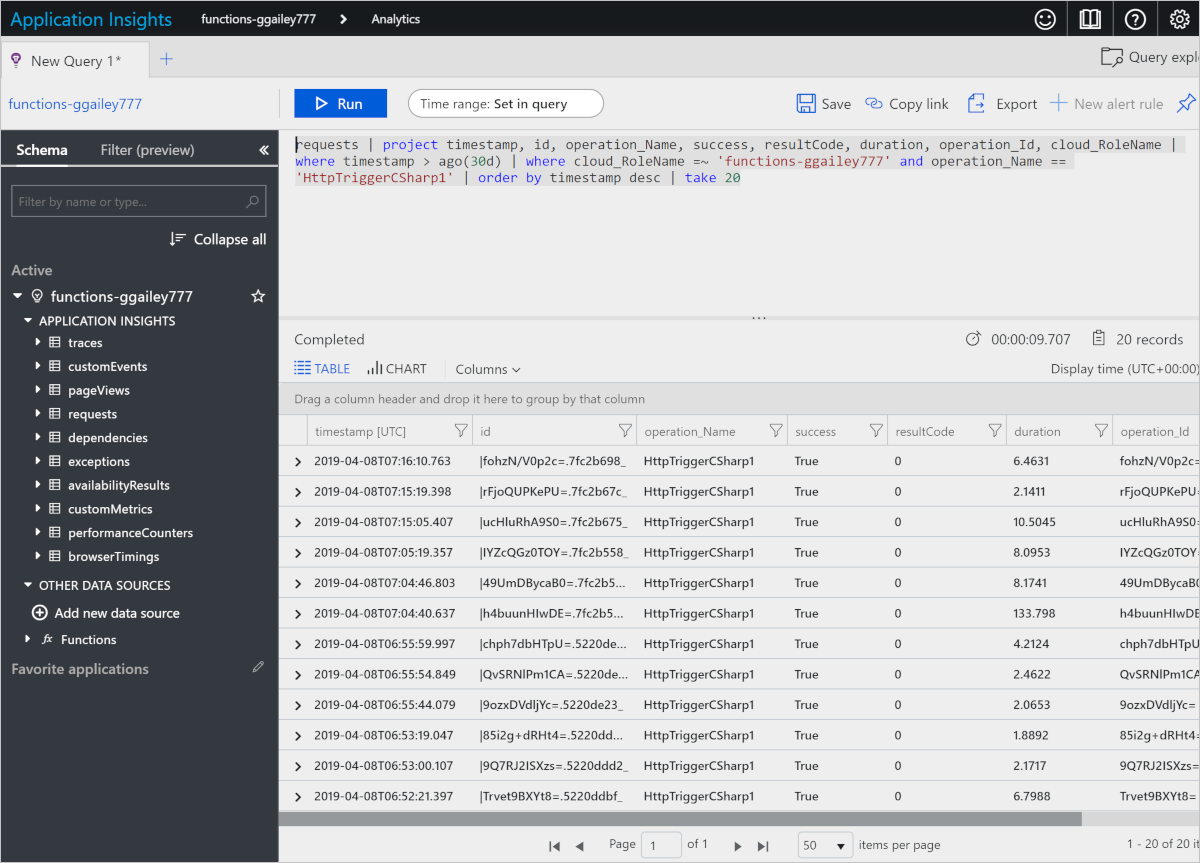
For more information, see Query telemetry data later in this article.
View telemetry in Application Insights
To open Application Insights from a function app in the Azure portal:
Browse to your function app in the portal.
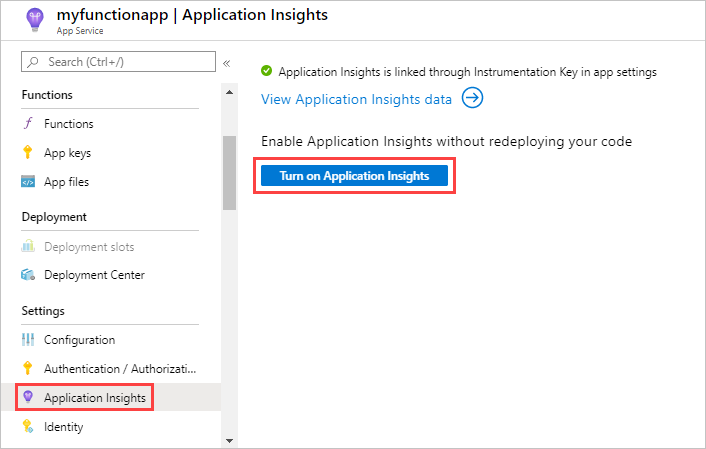
Select Application Insights under Settings in the left page.
If this is your first time using Application Insights with your subscription, you'll be prompted to enable it. To do this, select Turn on Application Insights, and then select Apply on the next page.
For information about how to use Application Insights, see the Application Insights documentation. This section shows some examples of how to view data in Application Insights. If you're already familiar with Application Insights, you can go directly to the sections about how to configure and customize the telemetry data.
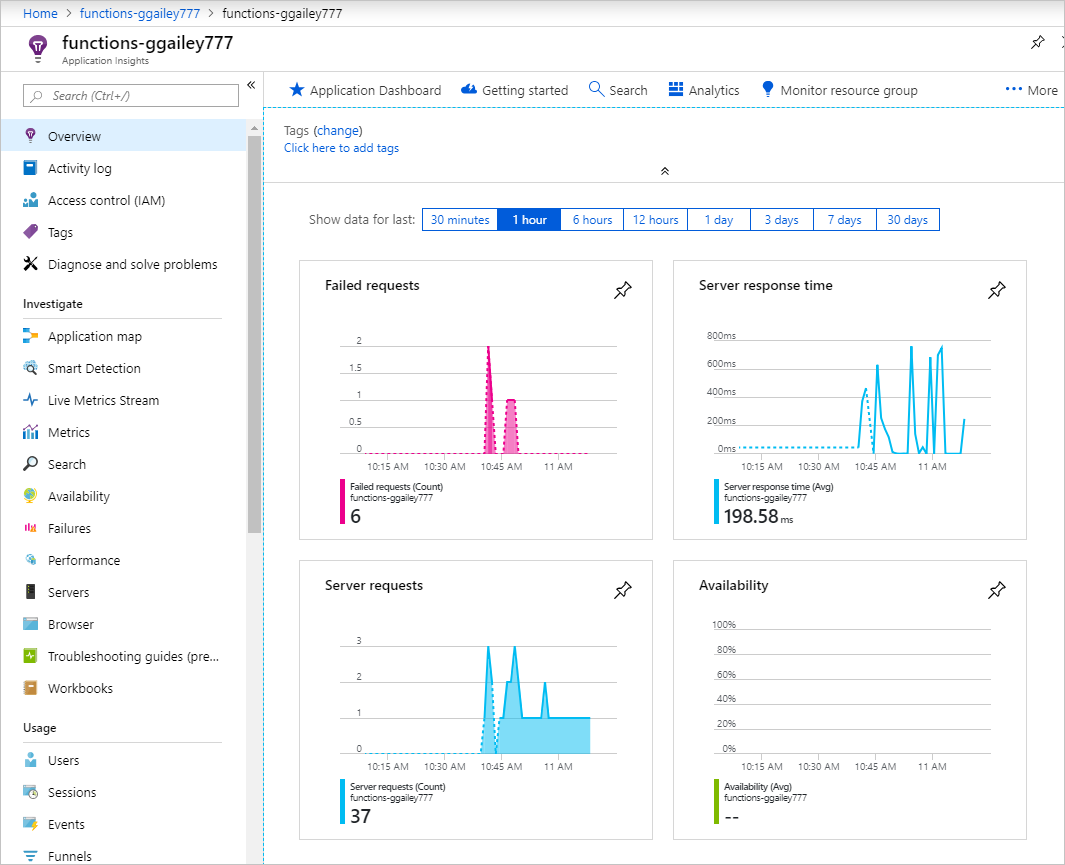
The following areas of Application Insights can be helpful when evaluating the behavior, performance, and errors in your functions:
| Investigate | Description |
|---|---|
| Failures | Create charts and alerts based on function failures and server exceptions. The Operation Name is the function name. Failures in dependencies aren't shown unless you implement custom telemetry for dependencies. |
| Performance | Analyze performance issues by viewing resource utilization and throughput per Cloud role instances. This performance data can be useful for debugging scenarios where functions are bogging down your underlying resources. |
| Metrics | Create charts and alerts that are based on metrics. Metrics include the number of function invocations, execution time, and success rates. |
| Live Metrics | View metrics data as it's created in near real time. |
Query telemetry data
Application Insights Analytics gives you access to all telemetry data in the form of tables in a database. Analytics provides a query language for extracting, manipulating, and visualizing the data.
Choose Logs to explore or query for logged events.
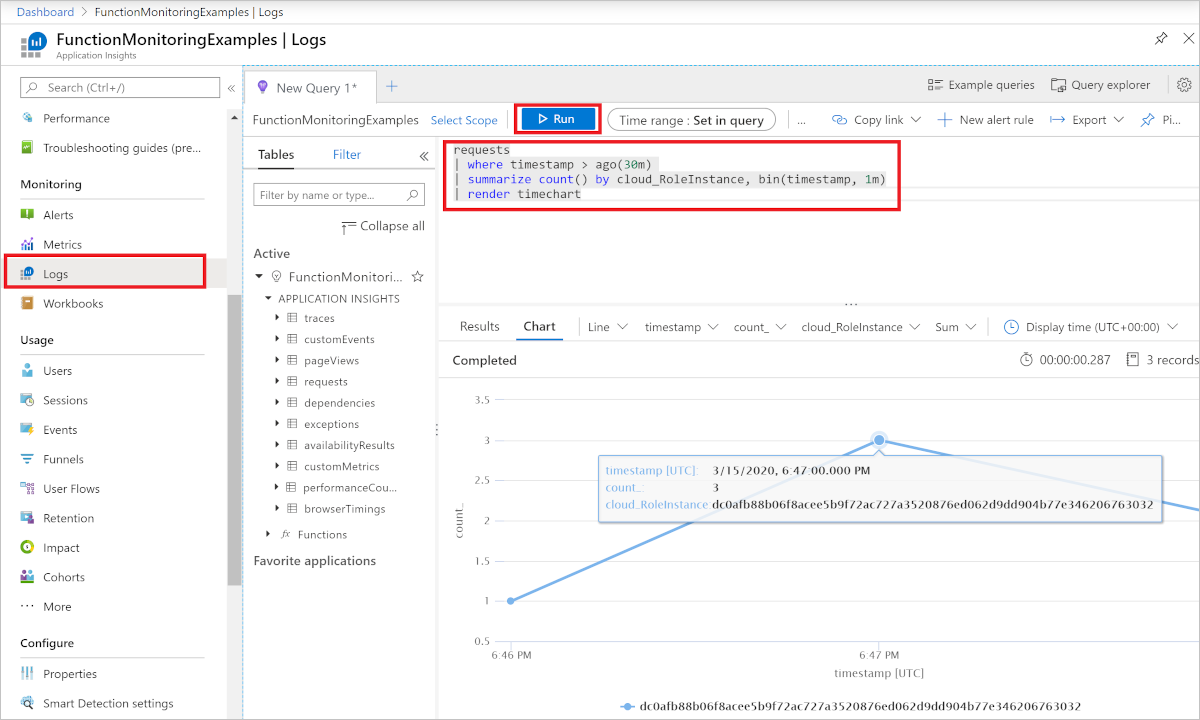
Here's a query example that shows the distribution of requests per worker over the last 30 minutes.
requests
| where timestamp > ago(30m)
| summarize count() by cloud_RoleInstance, bin(timestamp, 1m)
| render timechart
The tables that are available are shown in the Schema tab on the left. You can find data generated by function invocations in the following tables:
| Table | Description |
|---|---|
| traces | Logs created by the runtime, scale controller, and traces from your function code. For Flex Consumption plan hosting, traces also includes logs created during code deployment. |
| requests | One request for each function invocation. |
| exceptions | Any exceptions thrown by the runtime. |
| customMetrics | The count of successful and failing invocations, success rate, and duration. |
| customEvents | Events tracked by the runtime, for example: HTTP requests that trigger a function. |
| performanceCounters | Information about the performance of the servers that the functions are running on. |
The other tables are for availability tests, and client and browser telemetry. You can implement custom telemetry to add data to them.
Within each table, some of the Functions-specific data is in a customDimensions field. For example, the following query retrieves all traces that have log level Error.
traces
| where customDimensions.LogLevel == "Error"
The runtime provides the customDimensions.LogLevel and customDimensions.Category fields. You can provide additional fields in logs that you write in your function code. For an example in C#, see Structured logging in the .NET class library developer guide.
Query function invocations
Every function invocation is assigned a unique ID. InvocationId is included in the custom dimension and can be used to correlate all the logs from a particular function execution.
traces
| project customDimensions["InvocationId"], message
Telemetry correlation
Logs from different functions can be correlated using operation_Id. Use the following query to return all the logs for a specific logical operation.
traces
| where operation_Id == '45fa5c4f8097239efe14a2388f8b4e29'
| project timestamp, customDimensions["InvocationId"], message
| order by timestamp
Sampling percentage
Sampling configuration can be used to reduce the volume of telemetry. Use the following query to determine if sampling is operational or not. If you see that RetainedPercentage for any type is less than 100, then that type of telemetry is being sampled.
union requests,dependencies,pageViews,browserTimings,exceptions,traces
| where timestamp > ago(1d)
| summarize RetainedPercentage = 100/avg(itemCount) by bin(timestamp, 1h), itemType
Query scale controller logs
This feature is in preview.
After enabling both scale controller logging and Application Insights integration, you can use the Application Insights log search to query for the emitted scale controller logs. Scale controller logs are saved in the traces collection under the ScaleControllerLogs category.
The following query can be used to search for all scale controller logs for the current function app within the specified time period:
traces
| extend CustomDimensions = todynamic(tostring(customDimensions))
| where CustomDimensions.Category == "ScaleControllerLogs"
The following query expands on the previous query to show how to get only logs indicating a change in scale:
traces
| extend CustomDimensions = todynamic(tostring(customDimensions))
| where CustomDimensions.Category == "ScaleControllerLogs"
| where message == "Instance count changed"
| extend Reason = CustomDimensions.Reason
| extend PreviousInstanceCount = CustomDimensions.PreviousInstanceCount
| extend NewInstanceCount = CustomDimensions.CurrentInstanceCount
Query Flex Consumption code deployment logs
The following query can be used to search for all code deployment logs for the current function app within the specified time period:
traces
| extend deploymentId = customDimensions.deploymentId
| where deploymentId != ''
| project timestamp, deploymentId, message, severityLevel, customDimensions, appName
Consumption plan-specific metrics
When running in a Consumption plan, the execution cost of a single function execution is measured in GB-seconds. Execution cost is calculated by combining its memory usage with its execution time. To learn more, see Estimating Consumption plan costs.
The following telemetry queries are specific to metrics that impact the cost of running functions in the Consumption plan.
Determine memory usage
Under Monitoring, select Logs (Analytics), then copy the following telemetry query and paste it into the query window and select Run. This query returns the total memory usage at each sampled time.
performanceCounters
| where name == "Private Bytes"
| project timestamp, name, value
The results look like the following example:
| timestamp [UTC] | name | value |
|---|---|---|
| 9/12/2019, 1:05:14.947 AM | Private Bytes | 209,932,288 |
| 9/12/2019, 1:06:14.994 AM | Private Bytes | 212,189,184 |
| 9/12/2019, 1:06:30.010 AM | Private Bytes | 231,714,816 |
| 9/12/2019, 1:07:15.040 AM | Private Bytes | 210,591,744 |
| 9/12/2019, 1:12:16.285 AM | Private Bytes | 216,285,184 |
| 9/12/2019, 1:12:31.376 AM | Private Bytes | 235,806,720 |
Determine duration
Azure Monitor tracks metrics at the resource level, which for Functions is the function app. Application Insights integration emits metrics on a per-function basis. Here's an example analytics query to get the average duration of a function:
customMetrics
| where name contains "Duration"
| extend averageDuration = valueSum / valueCount
| summarize averageDurationMilliseconds=avg(averageDuration) by name
| name | averageDurationMilliseconds |
|---|---|
| QueueTrigger AvgDurationMs | 16.087 |
| QueueTrigger MaxDurationMs | 90.249 |
| QueueTrigger MinDurationMs | 8.522 |
Next steps
Learn more about monitoring Azure Functions: