Note
Access to this page requires authorization. You can try signing in or changing directories.
Access to this page requires authorization. You can try changing directories.
Azure Functions app diagnostics provides built-in detectors in the Azure portal that automatically check your Durable Functions application for extension version issues, high CPU usage, memory pressure, application errors, and more. Each detector identifies problems and suggests fixes you can apply directly in the portal.
Find the right detector
Use the following table to jump to the detector that matches your symptom:
| Symptom | Detector |
|---|---|
| Extension version issues, orchestration performance problems, or general health check | Durable Functions detector |
| App is down, returning errors, or functions aren't triggering | Functions App Down or Reporting Errors |
| Slow orchestrations or high CPU utilization | High CPU Analysis |
| Out-of-memory exceptions or high memory consumption | Memory Analysis |
Open app diagnostics
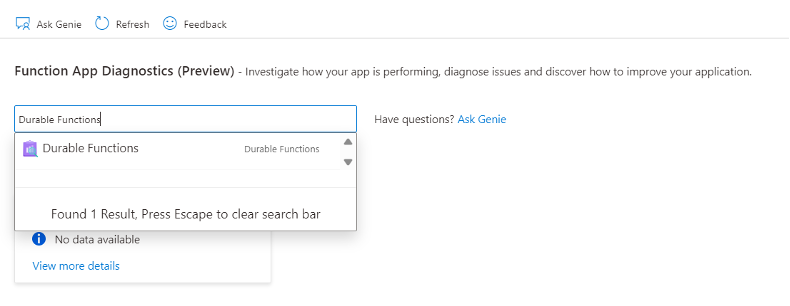
Go to your Function App resource. In the left menu, select Diagnose and solve problems.
Search for "Durable Functions" and select the result.
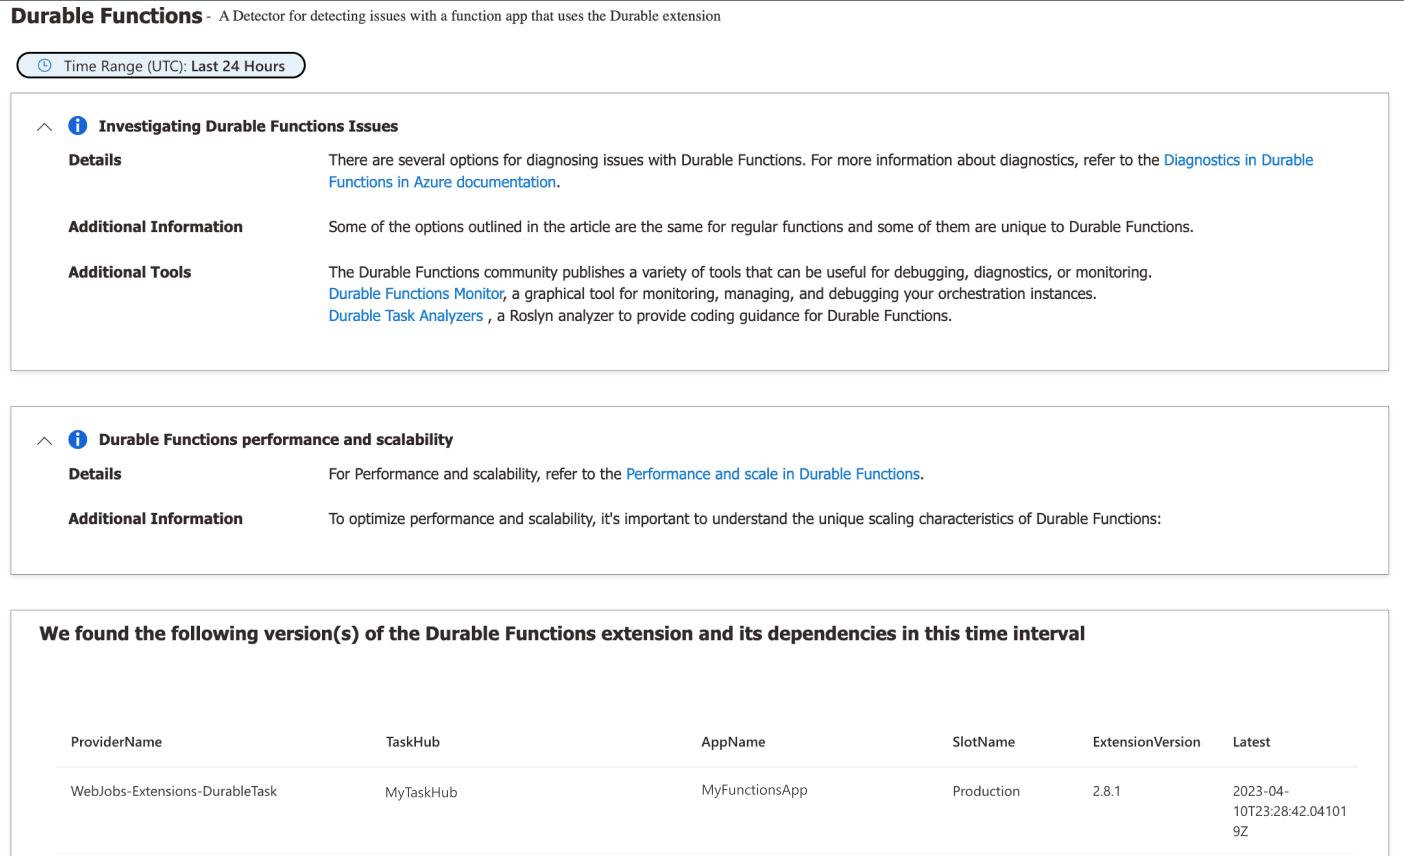
Durable Functions detector
The Durable Functions detector checks for common problems specific to Durable Functions apps. It reports:
- The Durable Functions extension version your app uses and whether an upgrade is available.
- Performance issues, such as slow orchestrations or high queue latency.
- Errors or warnings from recent orchestration executions.
If issues are found, the detector suggests mitigations and links to relevant documentation.
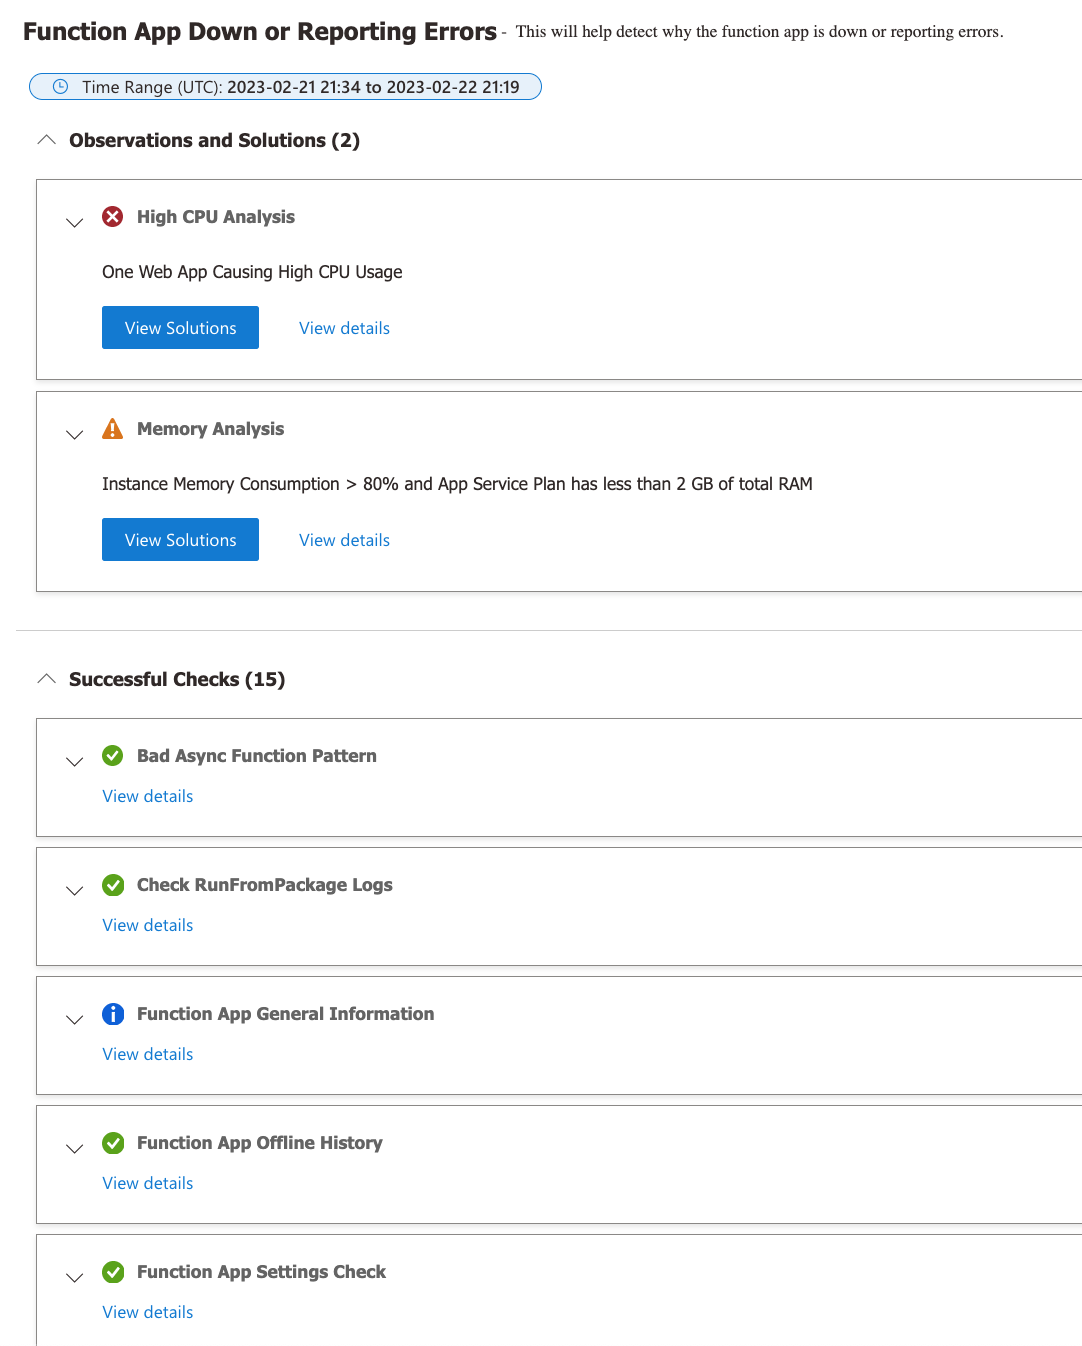
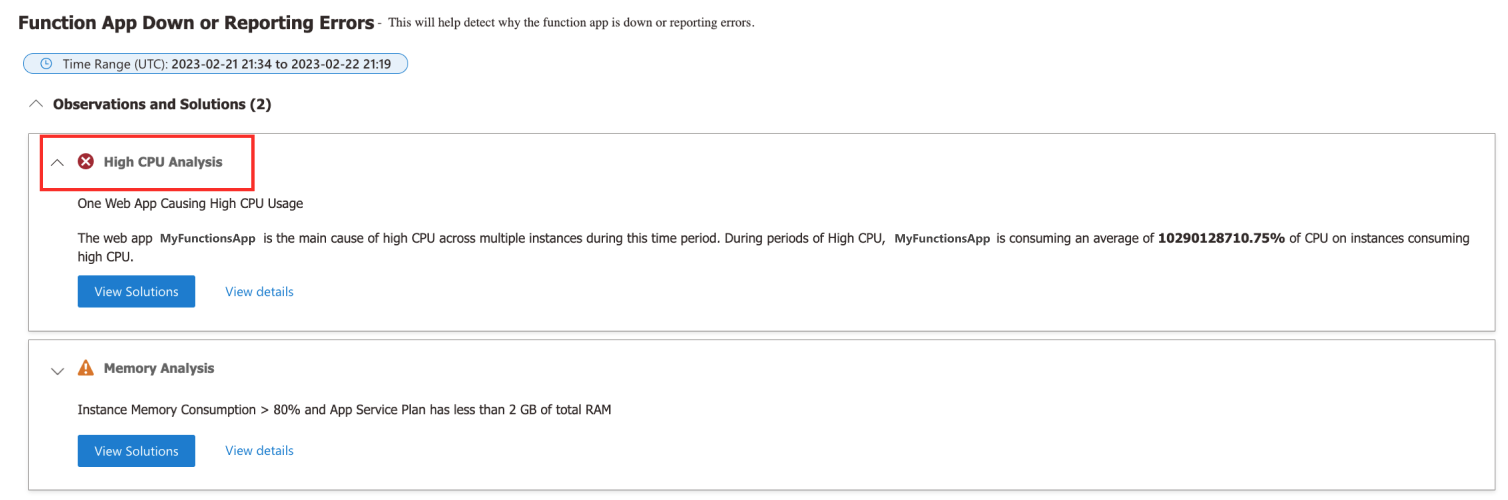
Functions App Down or Reporting Errors
The Functions App Down or Reporting Errors detector aggregates results from multiple sub-detectors that check key areas of your application, including platform health, app configuration, and dependency availability. Use this detector when your app is unresponsive or returning unexpected errors.
The following screenshot shows the checks performed and two issues that require attention:
High CPU Analysis
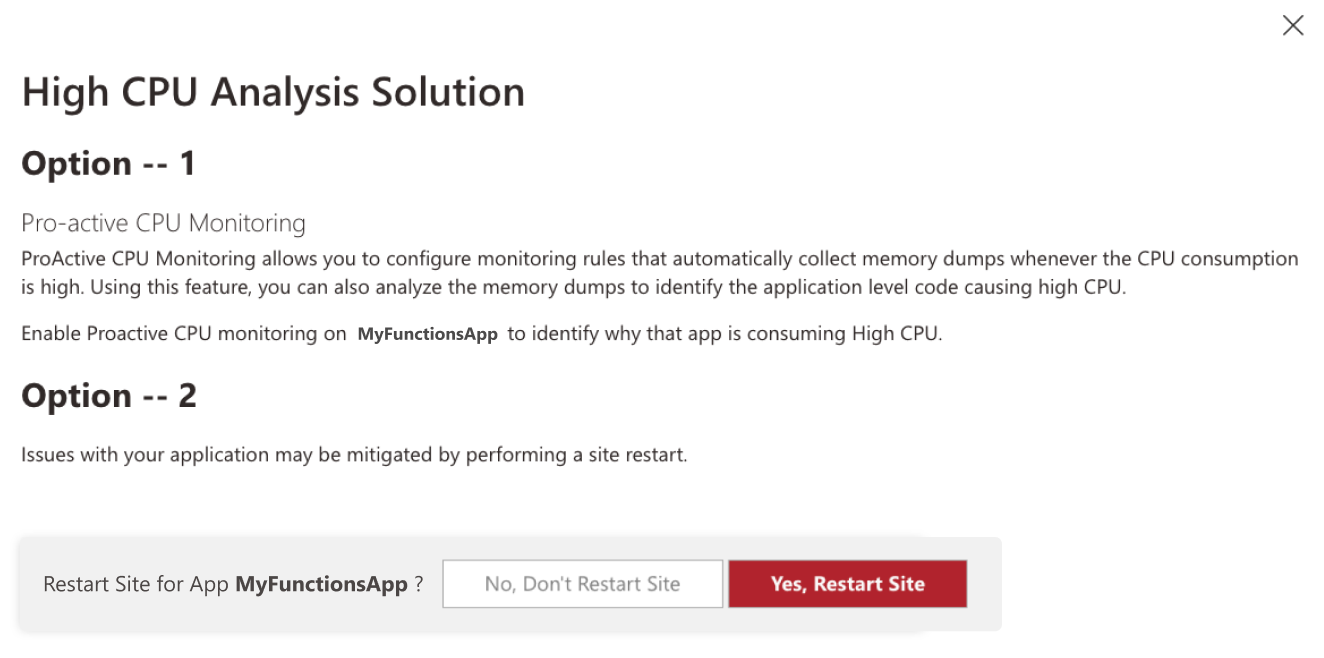
The High CPU Analysis detector identifies which apps or processes are consuming excessive CPU. High CPU usage in Durable Functions apps is often caused by large fan-out operations, tight polling loops, or compute-heavy activity functions.
When the detector identifies a high-CPU app, it shows the affected process and CPU percentage:
Select View Solutions to see recommended actions. Common suggestions include profiling your application to identify the hot path, or restarting the site to recover from a temporary spike:
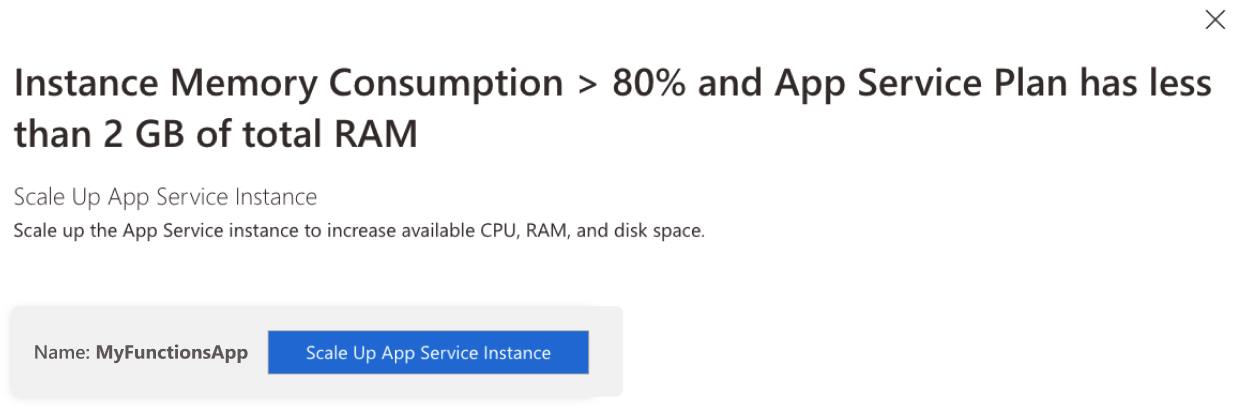
Memory Analysis
The Memory Analysis detector monitors memory consumption and flags apps that are approaching or exceeding available memory. Durable Functions apps can experience high memory usage when orchestrations process large payloads or when many orchestration instances run concurrently.
When memory usage is elevated, the detector displays a warning along with a memory usage graph over time:
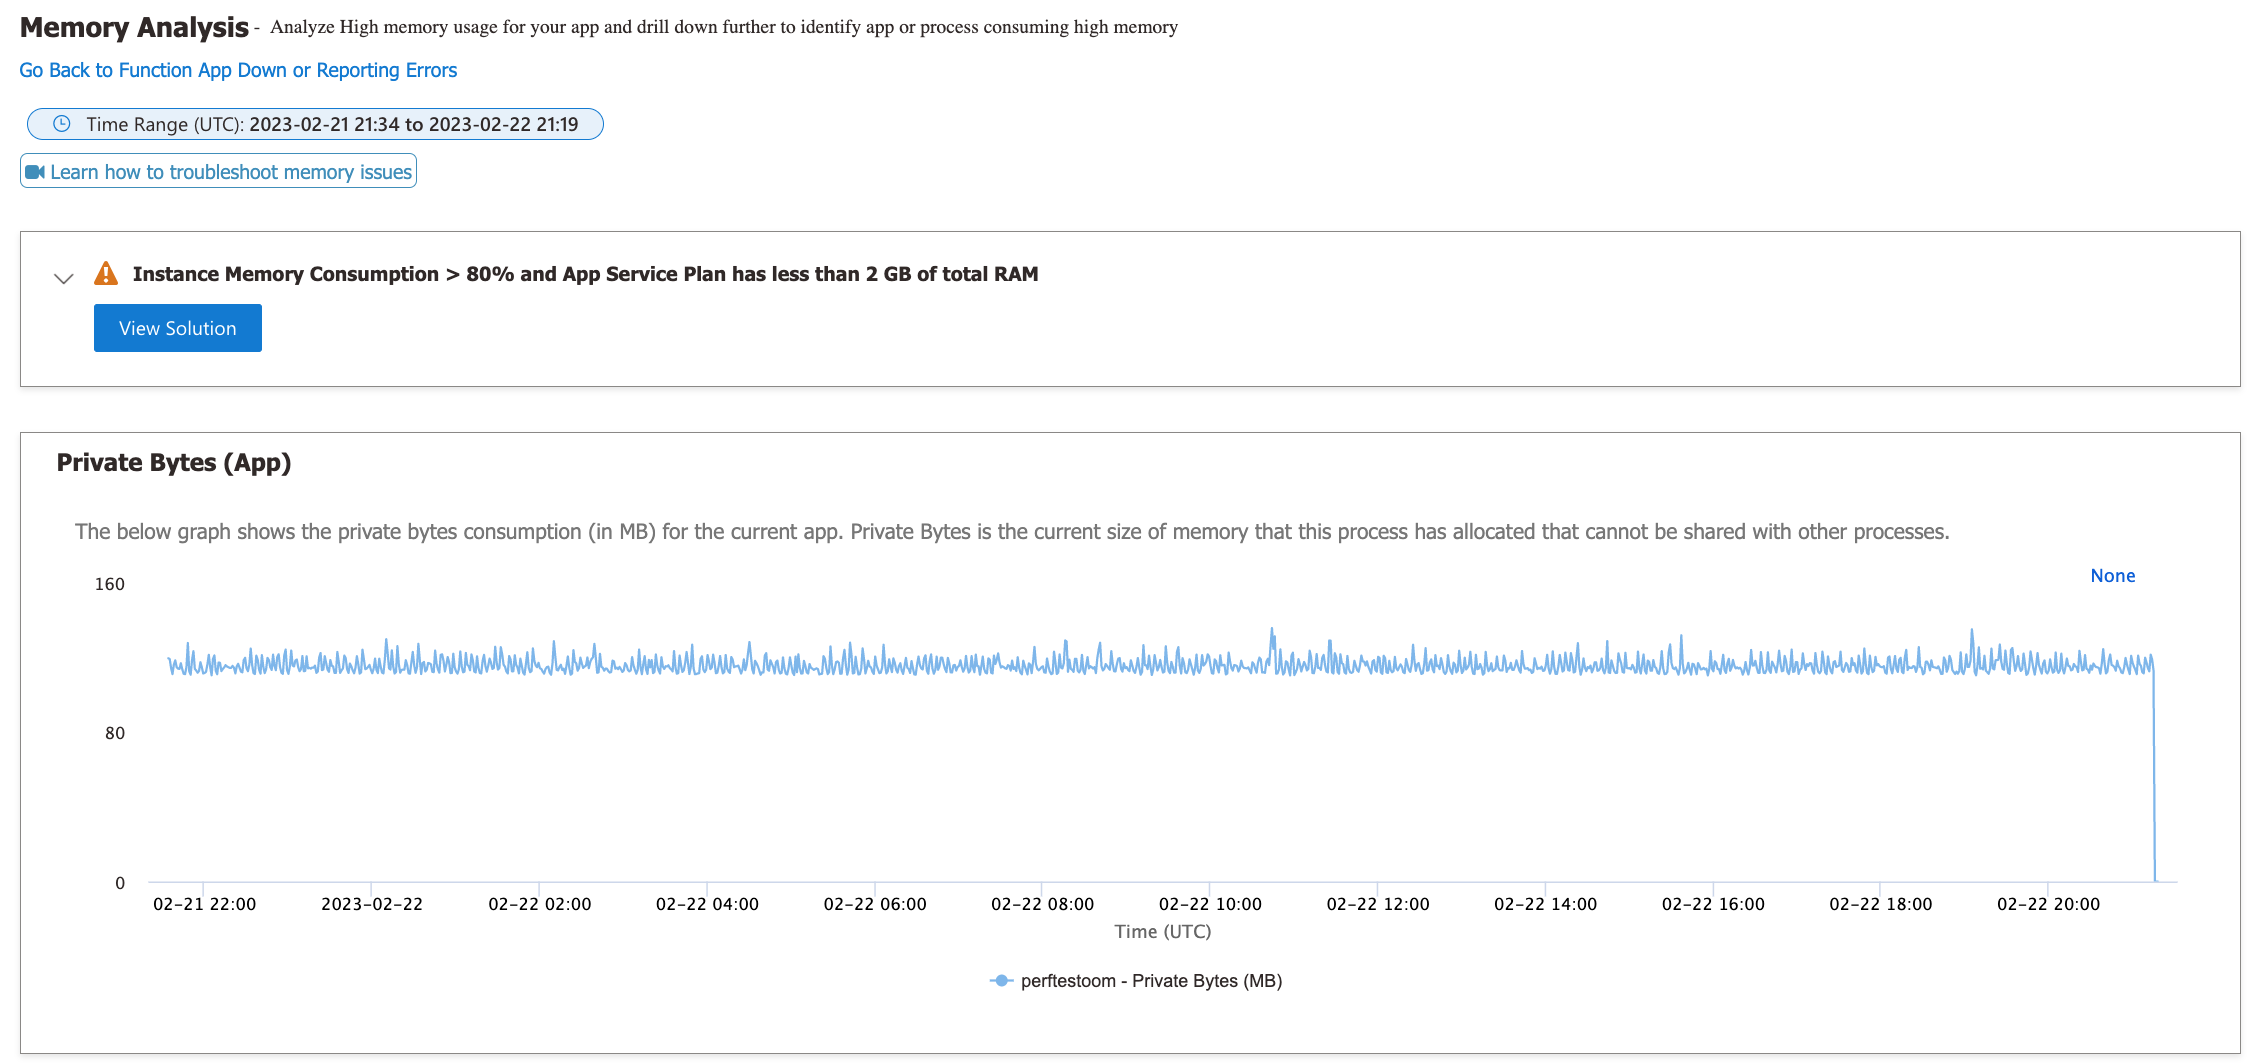
Select View Solutions to see recommended actions. Common suggestions include scaling up to a plan with more memory, or optimizing your orchestrations to reduce payload sizes: