Note
Access to this page requires authorization. You can try signing in or changing directories.
Access to this page requires authorization. You can try changing directories.
Migrating from the Azure Maps iOS SDK to the Web SDK in a WebView involves transitioning your existing map view from a native implementation to a web-based map using the Azure Maps Web SDK. This guide shows you how to migrate your code and features from the iOS SDK to the Web SDK.
Note
Azure Maps iOS SDK retirement
The Azure Maps Native SDK for iOS is now retired and no longer supported. Use this guide to migrate to the Azure Maps Web SDK.
Prerequisites
To use the Map Control in a web page, you must have one of the following prerequisites:
- An Azure Maps account.
- A subscription key or Microsoft Entra credentials. For more information, see authentication options.
Create a WebView
Add a WebView if your iOS application doesn't have one. Do so by adding the WKWebView to your storyboard or programmatically in your Swift code. Be sure it's configured to occupy the desired area of your layout.
import UIKit
import WebKit

class ViewController: UIViewController, WKNavigationDelegate {

    var webView: WKWebView!

    override func viewDidLoad() {
        super.viewDidLoad()

        // Create WKWebView instance
        webView = WKWebView(frame: view.bounds)
        webView.navigationDelegate = self
        view.addSubview(webView)

        // Load local HTML file
        loadLocalHTMLFile()
    }

    func loadLocalHTMLFile() {
        if let htmlPath = Bundle.main.path(forResource: "map", ofType: "html") {
            do {
                let htmlString = try String(contentsOfFile: htmlPath, encoding: .utf8)
                webView.loadHTMLString(htmlString, baseURL: Bundle.main.bundleURL)
            } catch {
                print("Error loading HTML file: \(error)")
            }
        } else {
            print("HTML file not found.")
        }
    }
}
Set up a map with Azure Maps Web SDK
In your HTML file, initialize a map with your subscription key. Replace <YOUR_SUBSCRIPTION_KEY> with your actual key.
<!DOCTYPE html>
<html>
   <head>
       <title>Azure Maps</title>
       <meta charset="utf-8" />
       <meta name="viewport" content="width=device-width, initial-scale=1" />
       <!-- Add references to the Azure Maps Map control JavaScript and CSS files. -->
       <link rel="stylesheet" href="https://atlas.microsoft.com/sdk/javascript/mapcontrol/3/atlas.min.css" type="text/css"/>
       <script src="https://atlas.microsoft.com/sdk/javascript/mapcontrol/3/atlas.min.js"></script>
       <style>
           html,
           body,
           #map {
               margin: 0;
               height: 100%;
               width: 100%;
           }
           body {
               display: flex;
               flex-direction: column;
           }
           main {
               flex: 1 1 auto;
           }
       </style>
       <script type="text/javascript">
           // Create an instance of the map control.
           function InitMap() {
               var map = new atlas.Map("map", {
                   center: [-122.33, 47.6],
                   zoom: 12,
                   authOptions: {
                       authType: "subscriptionKey",
                       subscriptionKey: "<YOUR_SUBSCRIPTION_KEY>"
                   }
               });

               // Wait until the map resources are ready.
               map.events.add("ready", function () {
                   // Resize the map to fill the container.
                   map.resize();
               });
           }
       </script>
   </head>
   <body onload="InitMap()">
       <main>
           <div id="map"></div>
       </main>
   </body>
</html>
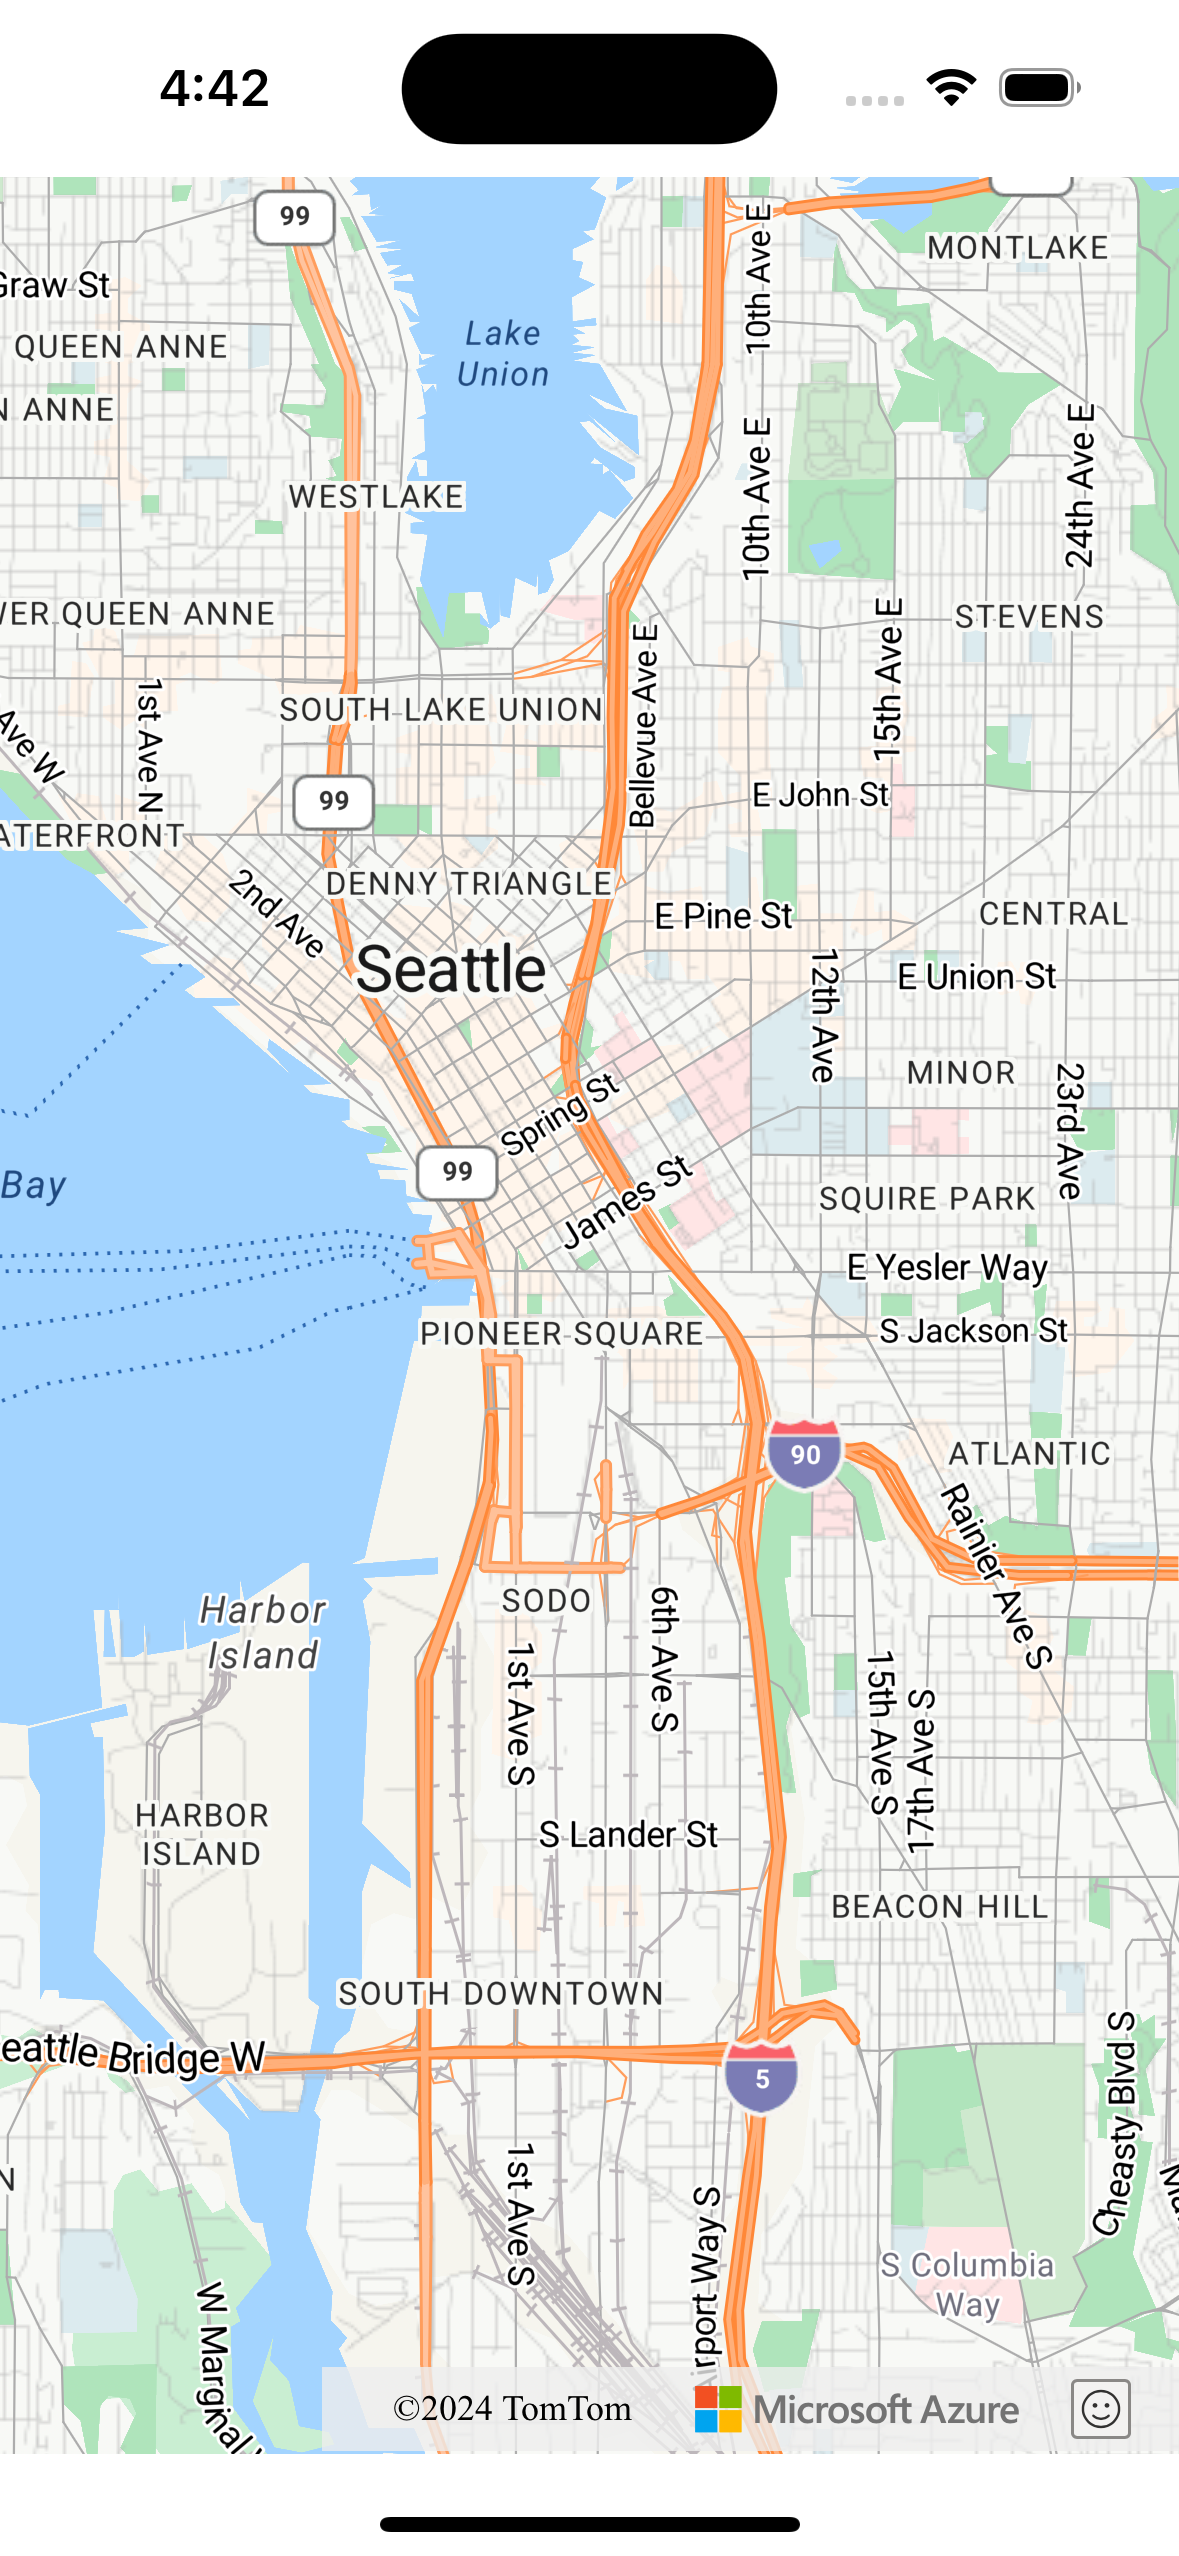
Save and run the app. A map should be shown within a WebView. Add any features or functionalities that you want to use from the Web SDK. You can refer to the Azure Maps Documentation and the Azure Maps Samples for more use cases.
Communication between native code and WebView (optional)
To enable communication between your iOS application and the WebView, you can use the WKScriptMessageHandler protocol provided by the WKWebView class. It allows you to establish a bridge for communication between JavaScript running in the WebView and your Swift code. For more information, see WKScriptMessageHandler in the iOS WebKit documentation.
Clean Up Native Map Implementation
Remove code related to the native Azure Maps iOS SDK from your project, including dependencies and initialization code related to azure-maps-ios-sdk-distribution.
Testing
Test your application thoroughly to ensure that the migration was successful. Check for issues related to map functionality, user interactions, and performance.
Next steps
Learn how to add maps to web and mobile applications using the Map Control client-side JavaScript library in Azure Maps: