Note
Access to this page requires authorization. You can try signing in or changing directories.
Access to this page requires authorization. You can try changing directories.
This guide describes how to use USGS worldwide DEM data from their SRTM mission with 30m accuracy to build an Elevation service on the Microsoft Azure Cloud.
This article describes how to:
- Create Contour line vector tiles and RGB-encoded DEM tiles.
- Create Elevation API using Azure Function and RGB-encoded DEM tiles from Azure Blob Storage.
- Create Contour line vector tile service using Azure Function and PostgreSQL.
Prerequisites
This guide requires the use of the following third-party software and data:
- USGS Data. DEM data can be downloaded as GeoTiff with 1 arc second coverage per tile through the USGS EarthExplorer. This requires an EarthExplorer account, but the data can be downloaded for free.
- The QGIS desktop GIS application is used to process and smoothen the Raster tiles. QGIS is free to download and use. This guide uses QGIS version 3.26.2-Buenos Aires.
- The rio-rgbify Python package, developed by MapBox, is used to encode the GeoTIFF as RGB.
- PostgreSQL database with the PostGIS spatial extension.
Create Contour line vector tiles and RGB-encoded DEM tiles
This guide uses the 36 tiles covering the state of Washington, available from USGS EarthExplorer.
Download raster tiles from USGS EarthExplorer
Search criteria
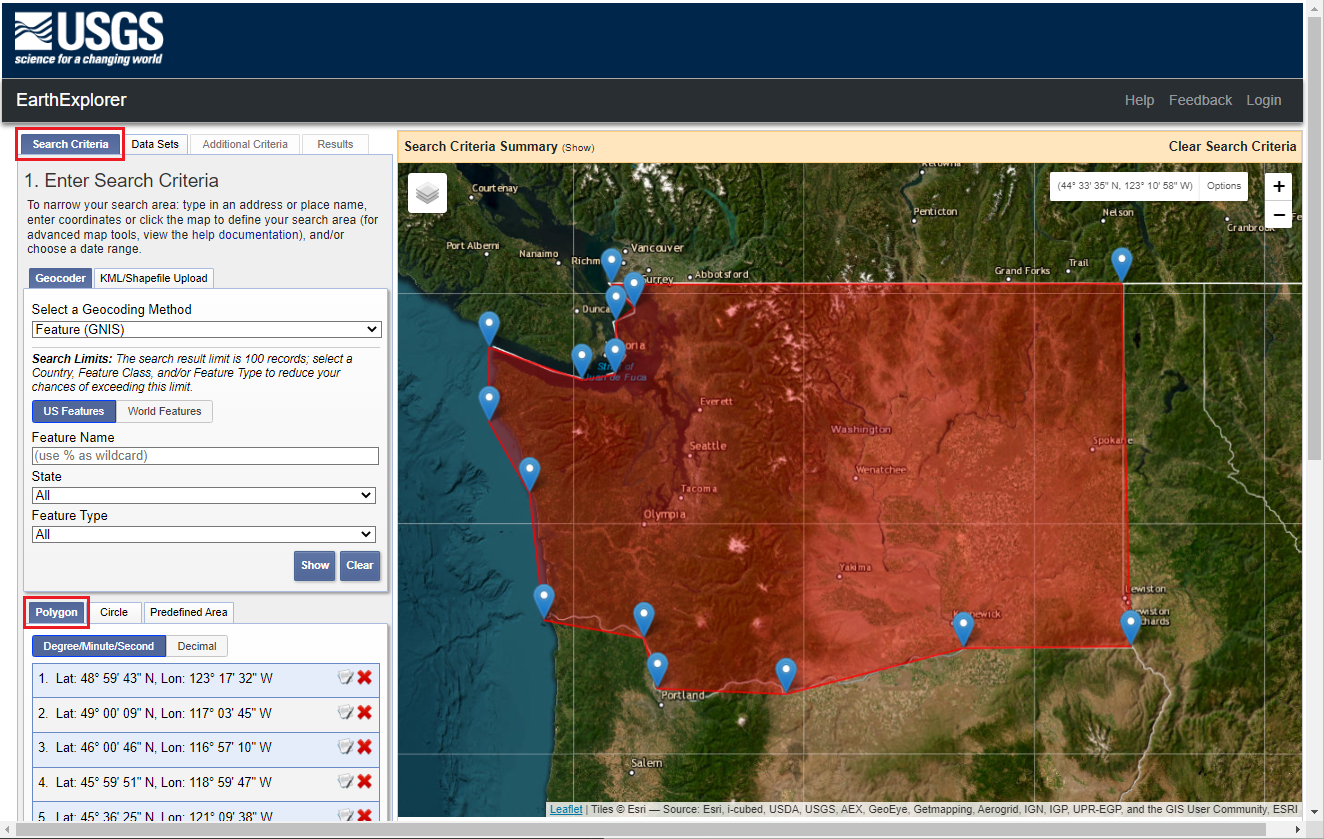
Select the region that you want raster tiles for. For demonstration purposes, this guide uses the "Polygon" method to select the region on the map.
Navigate to the USGS EarthExplorer.
In the Search Criteria tab, select Polygon then select anywhere on the map to create the boundary.

Data sets
Select the Data Sets tab.
Select SRTM 1 Arc-Second Global from the Digital Elevations section.
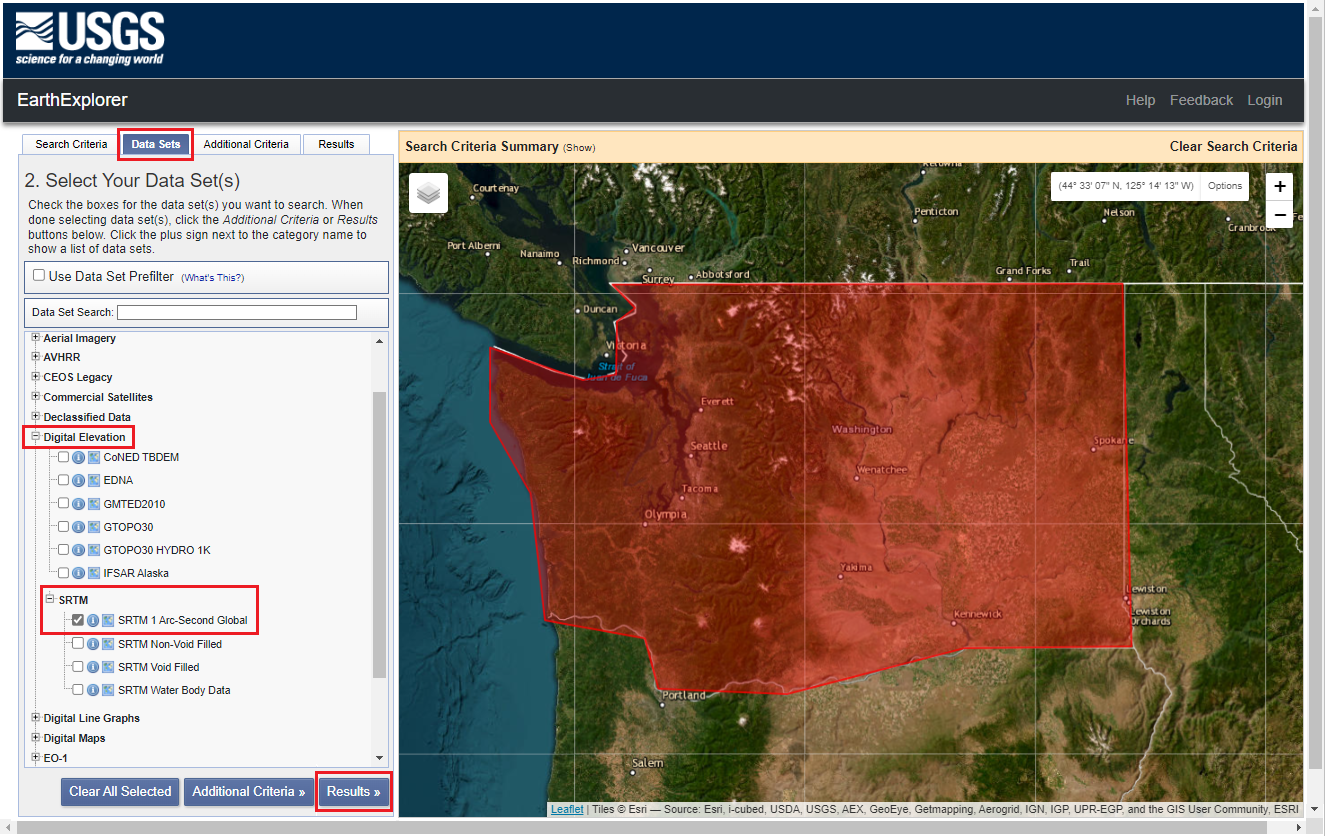

Results
Select Results >> to view the tiles for the selected region and data set.
The list of downloadable tiles appear on the results page. To download only tiles you want, select the Download Options button on the result card for each tile, selecting the option GeoTIFF 1 Arc-Second and repeat this step for the remaining tiles.
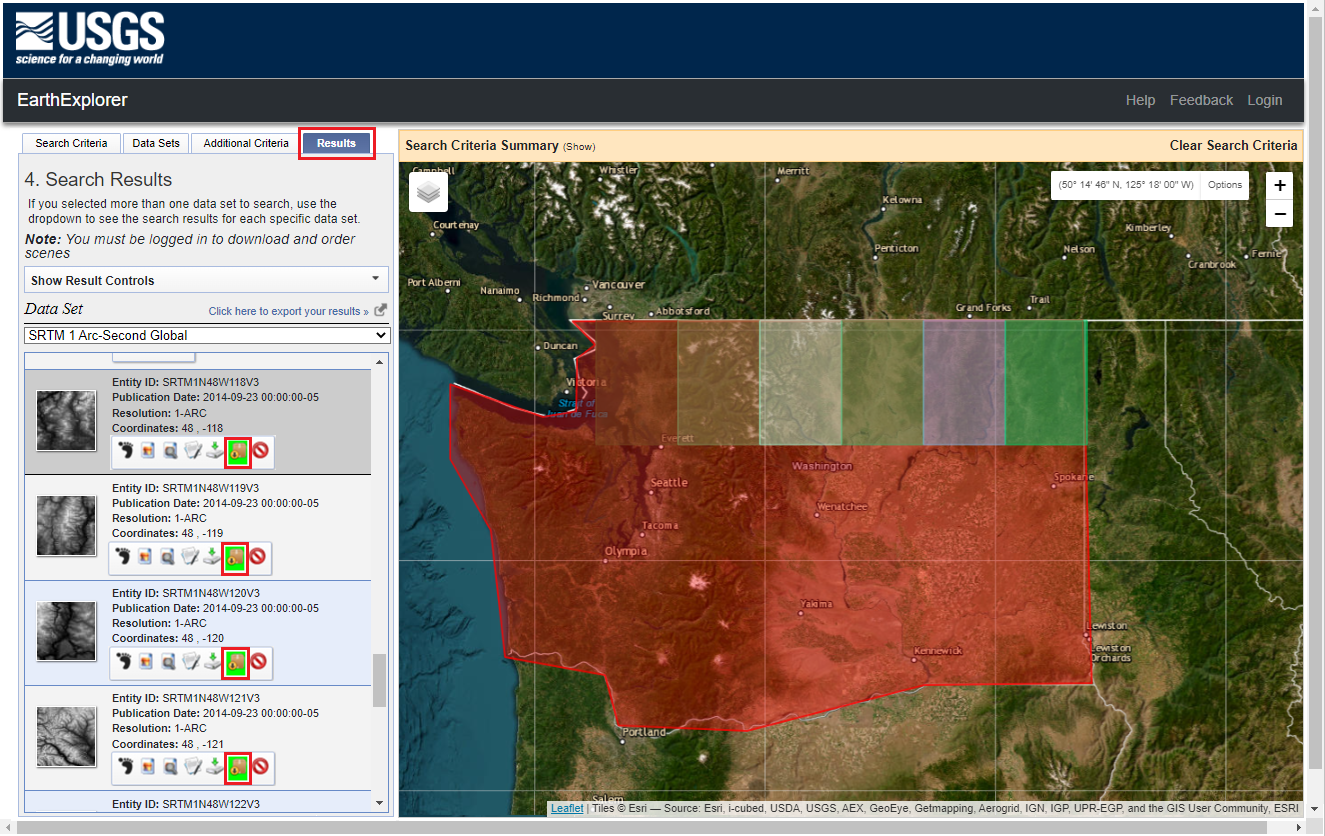
Alternatively, use the bulk download option and select GeoTIFF 1 Arc-second.

Add raster tiles to QGIS
Once you have the raster tiles you need, you can import them in QGIS.
Add raster tiles to QGIS by dragging the files to the QGIS layer tab or selecting Add Layer in the Layer menu.
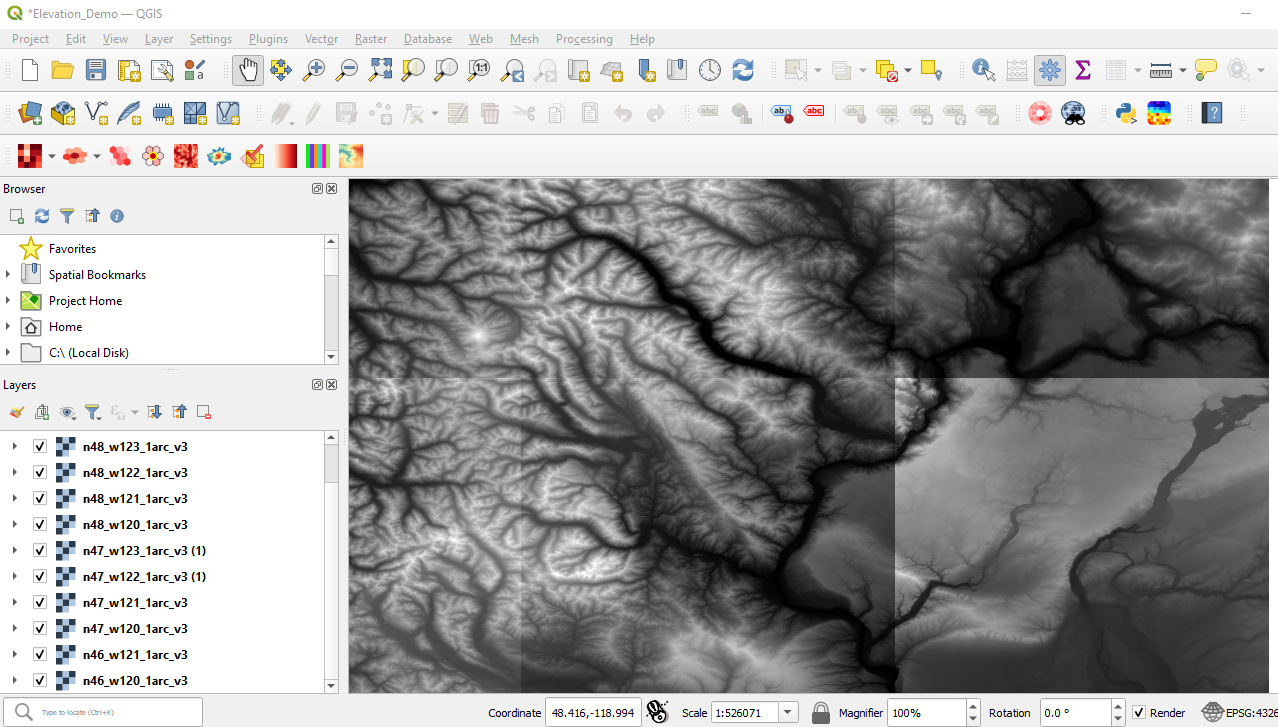
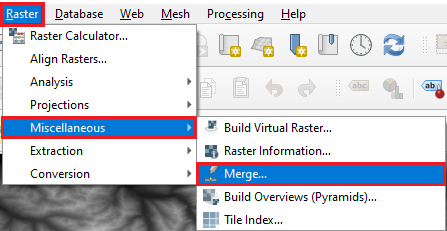
When the raster layers are loaded into QGIS, there can be different shades of tiles. Fix this by merging the raster layers, which result in a single smooth raster image in GeoTIFF format. To do this, select Miscellaneous from the Raster menu, then Merge...
Reproject the merged raster layer to EPSG:3857 (WGS84 / Pseudo-Mercator) using Save Raster Layer as right-click to access the merged raster layer in the table of content -> Export -> Save As option. EPSG:3857 is required to use it with Azure Maps Web SDK.

If you only want to create contour line vector tiles, you can skip the following steps and go to Create Contour line vector tile service using Azure Function and PostgreSQL.
To create an Elevation API, the next step is to RGB-Encode the GeoTIFF. This can be done using rio-rgbify, developed by MapBox. There are some challenges running this tool directly in Windows, so it's easier to run from WSL. Below are the steps in Ubuntu on WSL:
sudo apt get update
sudo apt get upgrade
sudo apt install python3-pip
pip install rio-rgbify
PATH="$PATH:/home/<user  /.local/bin"
# The following two steps are only necessary when mounting an external hard drive or USB flash drive:
sudo mkdir /mnt/f
sudo mount -t drvfs D: /mnt/f

rio rgbify -b -10000 -i 0.1 wa_1arc_v3_merged_3857.tif wa_1arc_v3_merged_3857_rgb.tif

# The following steps are only necessary when unmounting an external hard drive or USB flash drive:
cd \~
sudo umount /mnt/f/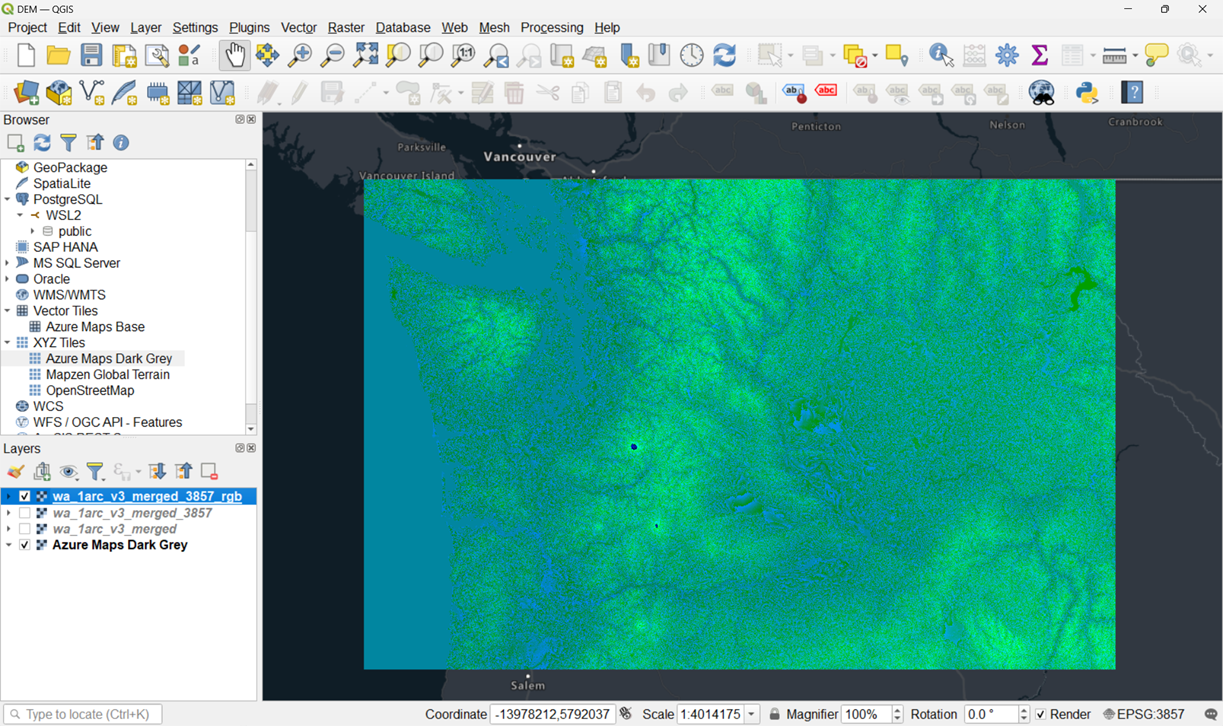
The RGB-encoded GeoTIFF allows you to retrieve R, G and B values for a pixel and calculate the elevation from these values:
elevation (m) = -10000 + ((R * 256 * 256 + G * 256 + B) * 0.1)Next, create a tile set to use with the map control and/or use it to get Elevation for any geographic coordinates within the map extent of the tile set. The tile set can be created in QGIS using the Generate XYZ tiles (Directory) tool.
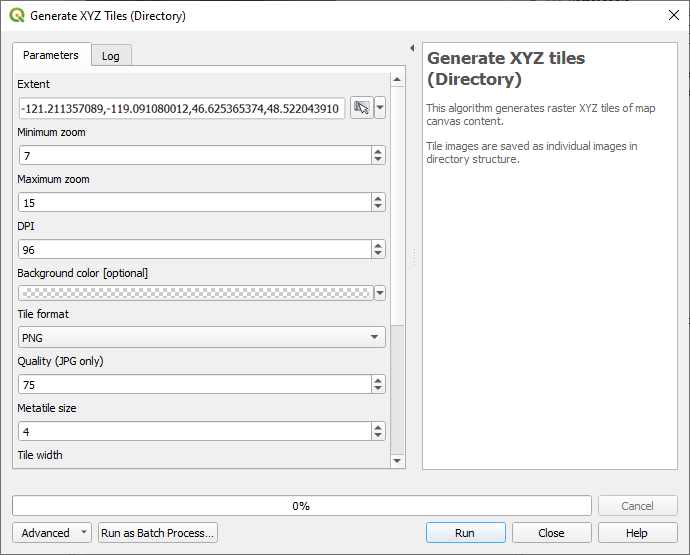
Save the location of the tile set, you'll use it in the next Section.

Create Elevation API using Azure Function and RGB-encoded DEM tiles from Azure Blob Storage
The RGB encoded DEM Tiles need to be uploaded to a database storage before it can be used with the Azure Functions to create an API.
Upload the tiles to Azure Blob Storage. Azure Storage Explorer is a useful tool for this purpose.

Uploading tiles to Azure Blob Storage can take several minutes to complete.
Once the upload is complete, you can create Azure Function to build an API that returns elevation for a given geographic coordinate.
This function receives a coordinate pair, determine the tile that covers it at zoom level 14, then determine the pixel coordinates within that tile that matches the geographic coordinates. It then retrieves the tile, gets the RGB values for that pixel, then uses the following formula to determine the elevation:
elevation (m) = -10000 + ((R * 256 * 256 + G * 256 + B) * 0.1)
import logging
import json
import azure.functions as func
from PIL import Image
import requests
from io import BytesIO
import math

def main(req: func.HttpRequest) -> func.HttpResponse:
    logging.info('Python HTTP trigger function processed a request.')

    # http://localhost:7071/api/GetElevationPoint?lng=-122.01911&lat=47.67091
    zoom = 14
    lng = float(req.params.get('lng'))
    lat = float(req.params.get('lat'))
    logging.info('Lng: ' + str(lng) + ' / lat: ' + str(lat))

    # Calculate th global pixel x and y coordinates for a lng / lat
    gx = (lng + 180) / 360
    sinLat = math.sin(lat * math.pi / 180)
    gy = 0.5 - math.log((1 + sinLat) / (1 - sinLat)) / (4 * math.pi)
    mapSize = math.ceil(256 * math.pow(2, zoom));
    gxc = min(max(gx * mapSize + 0.5, 0), mapSize - 1);
    gyc = min(max(gy * mapSize + 0.5, 0), mapSize - 1);

    # Calculate the tile x and y covering the lng / lat
    tileX = int(gxc / 256)
    tileY = int(gyc / 256)

    # Calculate the pixel coordinates for the tile covering the lng / lat
    tilePixelX = math.floor(gxc - (tileX * 256))
    tilePixelY = math.floor(gyc - (tileY * 256))

    response = requests.get("{BlobStorageURL}" + str(zoom) + "/" + str(tileX) + "/" + str(tileY) + ".png")
    im = Image.open(BytesIO(response.content))

    pix = im.load()
    r = pix[tilePixelX,tilePixelY][0]
    g = pix[tilePixelX,tilePixelY][1]
    b = pix[tilePixelX,tilePixelY][2]

    # elevation (m) = -10000 + ((R * 256 * 256 + G * 256 + B) * 0.1)
    ele = -10000 + ((r * 256 * 256 + g * 256 + b) * 0.1)

    jsonRes = {"elevation": + ele}
    logging.info('Response: ' + json.dumps(jsonRes))

    if lng and lat:
        return func.HttpResponse(
            json.dumps(jsonRes),
            mimetype="application/json",
        )
    else:
        return func.HttpResponse(
            "ERROR: Missing parameter!",
            status_code=400
        )
To see the results of the code sample, run it locally:
localhost:7071/api/GetElevationPoint?lng=-122.01911&lat=47.67091`
Create Contour line vector tile service using Azure Function and PostgreSQL
This section describes the steps to create and process contour lines in QGIS, upload them to PostgreSQL then create an Azure Function to Query PostgreSQL to return vector tiles.
In QGIS, open the merged raster tiles in the EPSG:4326 projection created in step 3 of Create Contour line vector tiles and RGB-encoded DEM tiles.
Select Extraction -> Contour from the Raster menu to open the Contour tool.
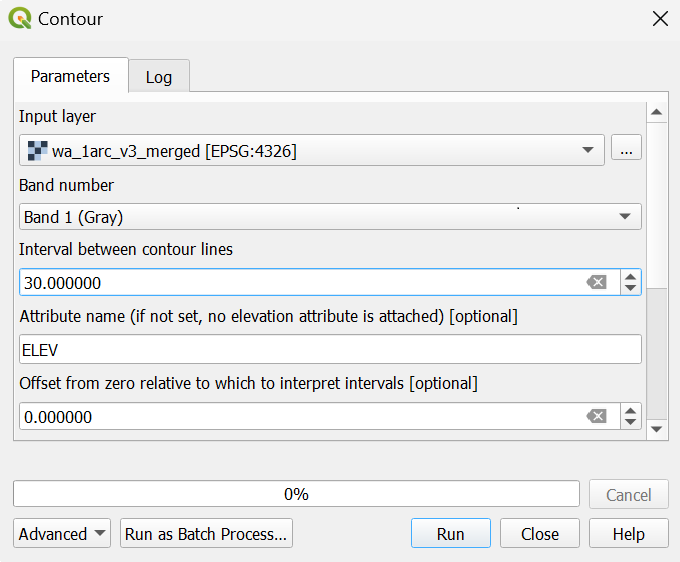
Selecting Run creates contour lines and add them as a layer to the map. some of the contour line edges may appear a little rough. This will be addressed in the next step.

Select Toolbox from the Processing menu to bring up the Processing Toolbox.
Then select Smooth in the Vector geometry section of the Processing Toolbox.
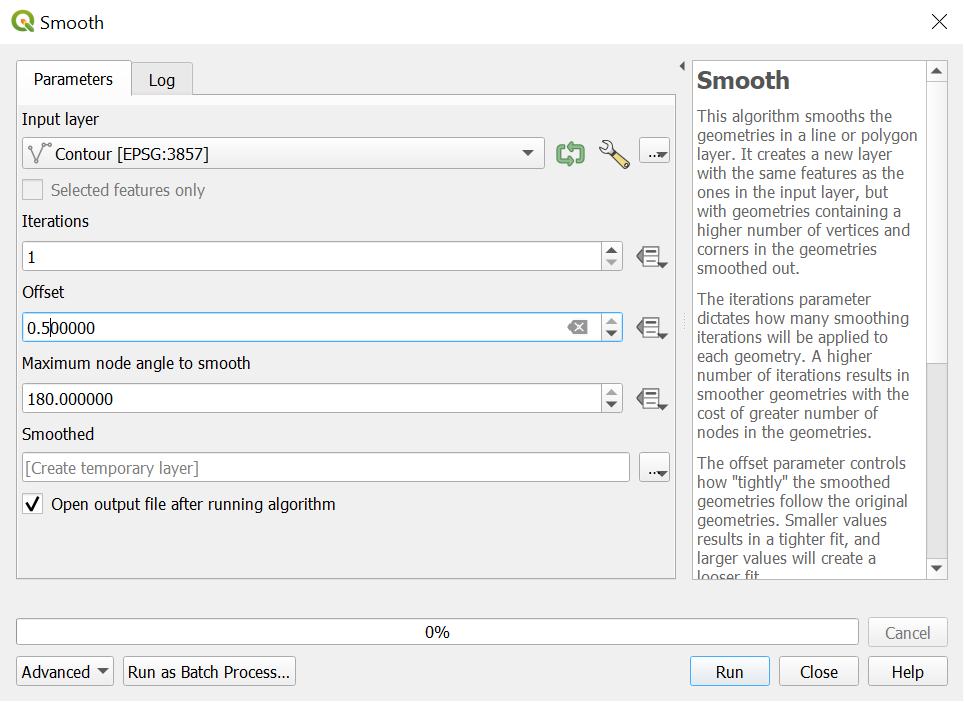
Note
Contour line smoothing can be substantially improved but at the cost of increased file-size.
Load the contour lines to the database. This guide uses the free version of PostgreSQL database that runs on localhost. You can also load them to the Azure Database for PostgreSQL.
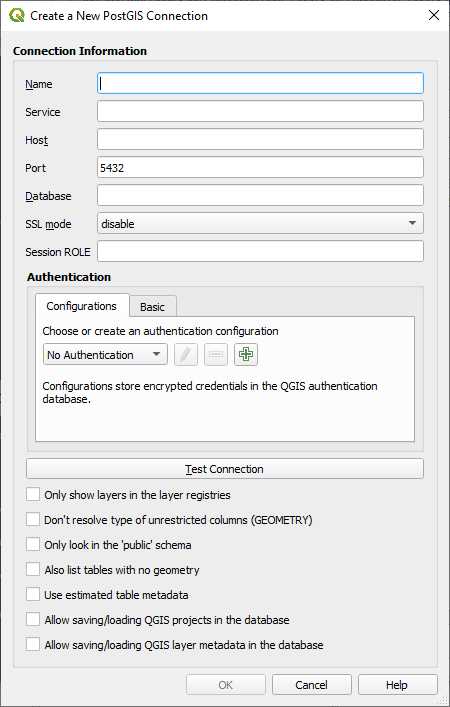
The next step requires a PostgreSQL database with PostGIS extension.
To create a connection from QGIS to PostgreSQL, select Add Layer -> Add PostGIS Layers from the Layer menu, then select the New button.
Next, load Data from QGIS to PostgreSQL using the Database Manager in QGIS. To do this, select DB Manager from the Database menu.
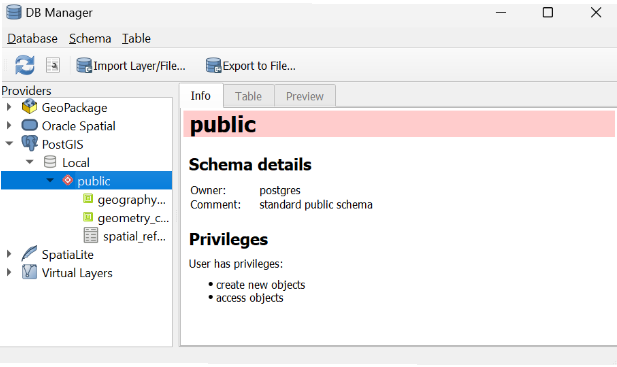
Connect to the PostGIS database and select Import Layer/File... to Import contour lines to the database.
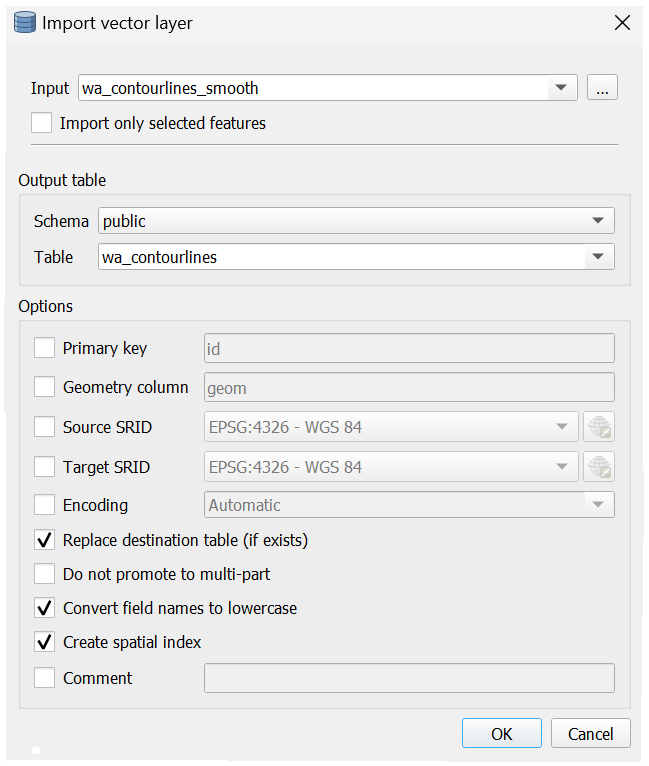
You can now use an Azure Function to Query PostgreSQL and return vector tiles for the contour lines. The tile server can be used with the Azure Maps Web SDK to create a web app that displays contour lines on the map.
import logging
from wsgiref import headers
import azure.functions as func
import psycopg2
# Database to connect to
DATABASE = {
    'user':     'postgres',
    'password': '{password}',
    'host':     'localhost',
    'port':     '5432',
    'database': '{database}'
    }
def main(req: func.HttpRequest) -> func.HttpResponse:
    logging.info('Python HTTP trigger function processed a request.')
    DATABASE_CONNECTION = None
    # get url parameters http://localhost:7071/api/tileserver?zoom={z}&x={x}&y={y}
    # http://localhost:7071/api/tileserver?zoom=16&x=10556&y=22870
    zoom = int(req.params.get('zoom'))
    x = int(req.params.get('x'))
    y = int(req.params.get('y'))
    table = req.params.get('table')
    # calculate the envelope of the tile
    # Width of world in EPSG:3857
    worldMercMax = 20037508.3427892
    worldMercMin = -1 * worldMercMax
    worldMercSize = worldMercMax - worldMercMin
    # Width in tiles
    worldTileSize = 2 ** zoom

    # Tile width in EPSG:3857
    tileMercSize = worldMercSize / worldTileSize

    # Calculate geographic bounds from tile coordinates
    # XYZ tile coordinates are in "image space" so origin is
    # top-left, not bottom right
    xmin = worldMercMin + tileMercSize * x
    xmax = worldMercMin + tileMercSize * (x + 1)
    ymin = worldMercMax - tileMercSize * (y + 1)
    ymax = worldMercMax - tileMercSize * y
    # Generate SQL to materialize a query envelope in EPSG:3857.
    # Densify the edges a little so the envelope can be
    # safely converted to other coordinate systems.
    DENSIFY_FACTOR = 4
    segSize = (xmax - xmin)/DENSIFY_FACTOR
    sql01 = 'ST_Segmentize(ST_MakeEnvelope(' + str(xmin) + ', ' + str(ymin) + ', ' + str(xmax) + ', ' + str(ymax) + ', 3857), ' + str(segSize) +')'

    # Generate a SQL query to pull a tile worth of MVT data
    # from the table of interest.
    # Materialize the bounds
    # Select the relevant geometry and clip to MVT bounds
    # Convert to MVT format
    sql02 = 'WITH bounds AS (SELECT ' + sql01 + ' AS geom, ' + sql01 + '::box2d AS b2d), mvtgeom AS (SELECT ST_AsMVTGeom(ST_Transform(t.geom, 3857), bounds.b2d) AS geom, elev FROM contourlines_smooth t, bounds WHERE ST_Intersects(t.geom, ST_Transform(bounds.geom, 4326))) SELECT ST_AsMVT(mvtgeom.*) FROM mvtgeom'

    # Run tile query SQL and return error on failure conditions
    # Make and hold connection to database
    if not DATABASE_CONNECTION:
        try:
            DATABASE_CONNECTION = psycopg2.connect(**DATABASE)
            logging.info('Connected to database.')
        except (Exception, psycopg2.Error) as error:
            logging.error('ERROR: Cannot connect to database.')
    # Query for MVT
    with DATABASE_CONNECTION.cursor() as cur:
        cur.execute(sql02)
        if not cur:
            logging.error('ERROR: SQL Query failed.')
        pbf = cur.fetchone()[0]
        logging.info('Queried database')

    if zoom and x and y:
        return func.HttpResponse(
            # f"This HTTP triggered function executed successfully.\n\nzoom={zoom}\nx={x}\ny={y}\n\nxmin={xmin}\nxmax={xmax}\nymin={ymin}\nymax={ymax}\n\nsql01={sql01}\n\nsql02={sql02}",
            bytes(pbf),
            status_code=200,
            headers={"Content-type": "application/vnd.mapbox-vector-tile","Access-Control-Allow-Origin": "*"}
        )
    else:
        return func.HttpResponse(
            "ERROR: Missing parameter!",
            status_code=400
        )
To see the results of the code sample, run it locally:
http://localhost:7071/api/tileserver?zoom={z}&x={x}&y={y}