Add a drawing tools toolbar to a map
This article shows you how to use the Drawing Tools module and display the drawing toolbar on the map. The Drawing toolbar control adds the drawing toolbar on the map. You learn how to create maps with only one and all drawing tools and how to customize the rendering of the drawing shapes in the drawing manager.
Add drawing toolbar
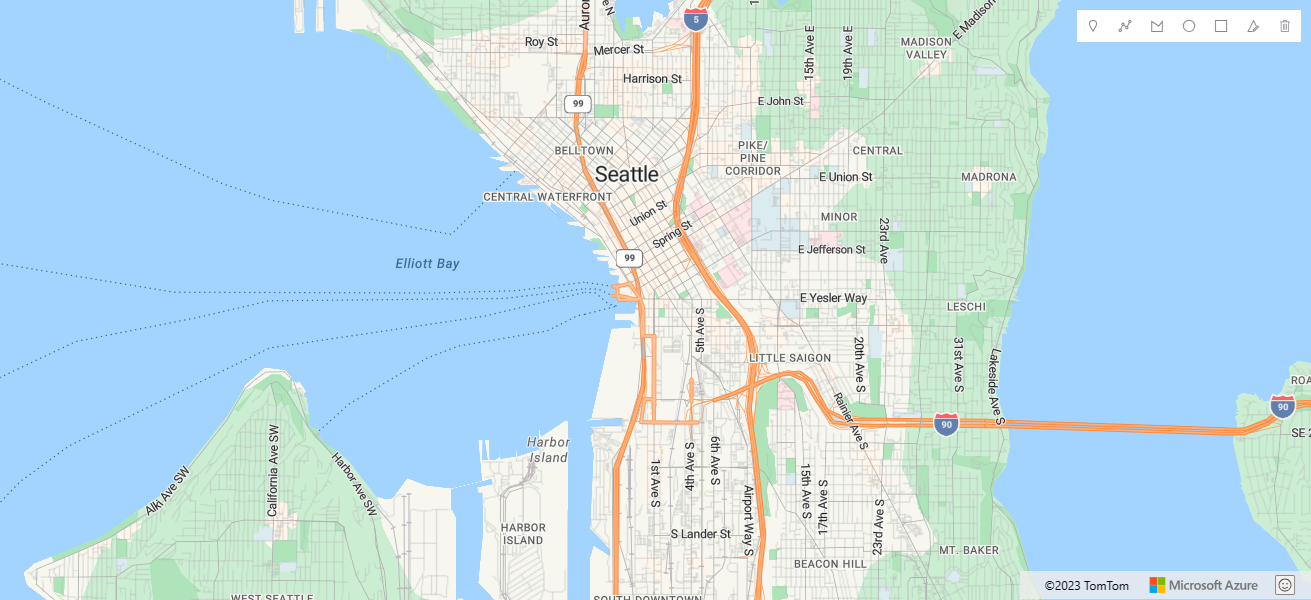
The following code creates an instance of the drawing manager and displays the toolbar on the map.
//Create an instance of the drawing manager and display the drawing toolbar.
drawingManager = new atlas.drawing.DrawingManager(map, {
        toolbar: new atlas.control.DrawingToolbar({
            position: 'top-right',
            style: 'dark'
        })
    });
For a complete working sample that demonstrates how to add a drawing toolbar to your map, see Add drawing toolbar to map in the Azure Maps Samples. For the source code for this sample, see Add drawing toolbar to map source code.
Limit displayed toolbar options
The following code creates an instance of the drawing manager and displays the toolbar with just a polygon drawing tool on the map.
//Create an instance of the drawing manager and display the drawing toolbar with polygon drawing tool.
drawingManager = new atlas.drawing.DrawingManager(map, {
        toolbar: new atlas.control.DrawingToolbar({
            position: 'top-right',
            style: 'light',
            buttons: ["draw-polygon"]
        })
    });
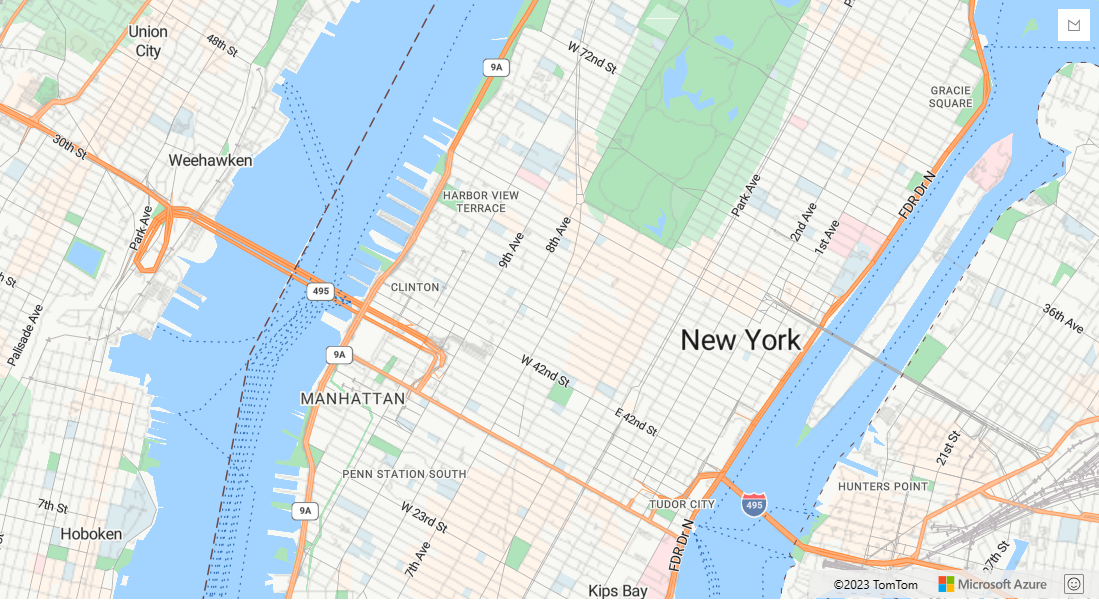
The following screenshot shows a sample of an instance of the drawing manager that displays the toolbar with just a single drawing tool on the map:
Change drawing rendering style
The style of the shapes that are drawn can be customized by retrieving the underlying layers of the drawing manager by using the drawingManager.getLayers() and drawingManager.getPreviewLayers() functions and then setting options on the individual layers. The drag handles that appear for coordinates when editing a shape are HTML markers. The style of the drag handles can be customized by passing HTML marker options into the dragHandleStyle and secondaryDragHandleStyle options of the drawing manager.
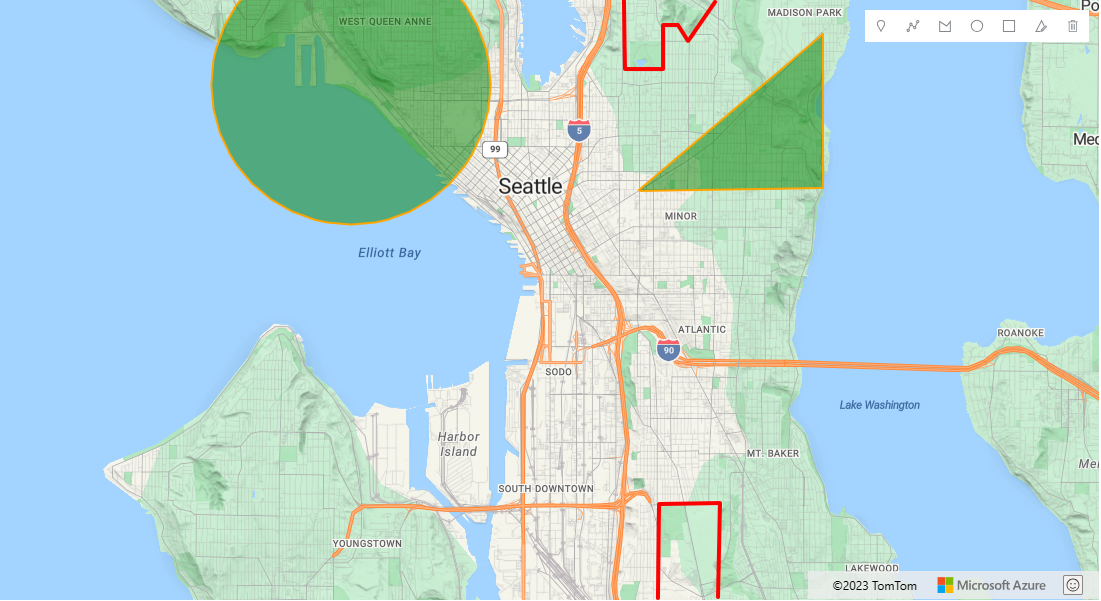
The following code gets the rendering layers from the drawing manager and modifies their options to change rendering style for drawing. In this case, points are rendered with a blue marker icon. Lines are red and four pixels wide. Polygons have a green fill color and an orange outline. It then changes the styles of the drag handles to be square icons.
//Get rendering layers of drawing manager.
var layers = drawingManager.getLayers();

//Change the icon rendered for points.
layers.pointLayer.setOptions({
    iconOptions: {
        image: 'marker-blue'
    }
});

//Change the color and width of lines.
layers.lineLayer.setOptions({
    strokeColor: 'red',
    strokeWidth: 4
});

//Change fill color of polygons.
layers.polygonLayer.setOptions({
    fillColor: 'green'
});

//Change the color of polygon outlines.
layers.polygonOutlineLayer.setOptions({
    strokeColor: 'orange'
});


//Get preview rendering layers from the drawing manager and modify line styles to be dashed.
var previewLayers = drawingManager.getPreviewLayers();
previewLayers.lineLayer.setOptions({ strokeColor: 'red', strokeWidth: 4, strokeDashArray: [3,3] });
previewLayers.polygonOutlineLayer.setOptions({ strokeColor: 'orange', strokeDashArray: [3, 3] });

//Update the style of the drag handles that appear when editing.
drawingManager.setOptions({
    //Primary drag handle that represents coordinates in the shape.
    dragHandleStyle: {
        anchor: 'center',
        htmlContent: '<svg width="15" height="15" viewBox="0 0 15 15" xmlns="http://www.w3.org/2000/svg" style="cursor:pointer"><rect x="0" y="0" width="15" height="15" style="stroke:black;fill:white;stroke-width:4px;"/></svg>',
        draggable: true
    },

    //Secondary drag handle that represents mid-point coordinates that users can grab to add new coordinates in the middle of segments.
    secondaryDragHandleStyle: {
        anchor: 'center',
        htmlContent: '<svg width="10" height="10" viewBox="0 0 10 10" xmlns="http://www.w3.org/2000/svg" style="cursor:pointer"><rect x="0" y="0" width="10" height="10" style="stroke:white;fill:black;stroke-width:4px;"/></svg>',
        draggable: true
    }
});
For a complete working sample that demonstrates how to customize the rendering of the drawing shapes in the drawing manager by accessing the rendering layers, see Change drawing rendering style in the Azure Maps Samples. For the source code for this sample, see Change drawing rendering style source code.
Note
When in edit mode, shapes can be rotated. Rotation is supported from MultiPoint, LineString, MultiLineString, Polygon, MultiPolygon, and Rectangle geometries. Point and Circle geometries can not be rotated.
Next steps
Learn how to use more features of the drawing tools module:
Learn more about the classes and methods used in this article:
Feedback
Coming soon: Throughout 2024 we will be phasing out GitHub Issues as the feedback mechanism for content and replacing it with a new feedback system. For more information see: https://aka.ms/ContentUserFeedback.
Submit and view feedback for