Note
Access to this page requires authorization. You can try signing in or changing directories.
Access to this page requires authorization. You can try changing directories.
Wind power is one alternative energy source for fossil fuels to combat against climate change. Because wind isn't consistent by nature, wind power operators need to build machine learning (ML) models to predict the wind power capacity. This prediction is necessary to meet electricity demand and ensure the grid stability. In this tutorial, we walk through how Azure Maps weather forecast data is combined with demo data for weather readings. Weather forecast data is requested by calling Azure Maps Weather service.
In this tutorial, you will:
- Create and run a Jupyter Notebook in VS Code.
- Load demo data from file.
- Call Azure Maps REST APIs in Python.
- Render location data on the map.
- Enrich the demo data with Azure Maps Daily Forecast weather data.
- Plot forecast data in graphs.
Note
The Jupyter notebook file for this project can be downloaded from the Weather Maps Jupyter Notebook repository.
Prerequisites
If you don't have an Azure subscription, create a free account before you begin.
- An Azure Maps account
- A subscription key
- Visual Studio Code
- A working knowledge of Jupyter Notebooks in VS Code
- Environment set up to work with Python in Jupyter Notebooks. For more information, see Setting up your environment.
Note
For more information on authentication in Azure Maps, see manage authentication in Azure Maps.
Install project level packages
The EV Routing and Reachable Range project has dependencies on the aiohttp and IPython python libraries. You can install these in the Visual Studio terminal using pip:
pip install aiohttp
pip install ipython
pip install pandas
Open Jupyter Notebook in Visual Studio Code
Download then open the Notebook used in this tutorial:
Open the file weatherDataMaps.ipynb in the AzureMapsJupyterSamples repository in GitHub.
Select the Download raw file button in the upper-right corner of the screen to save the file locally.
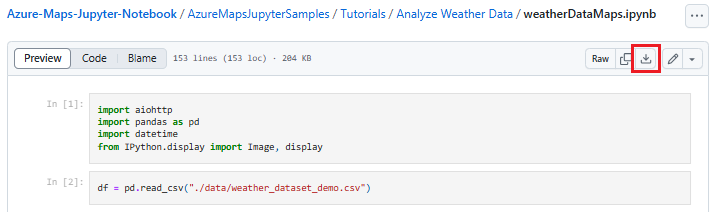
Open the downloaded Notebook in Visual Studio Code by right-clicking on the file then selecting Open with > Visual Studio Code, or through the VS Code File Explorer.
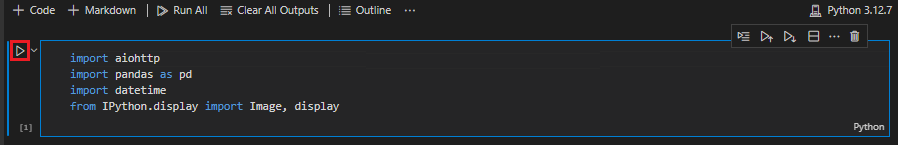
Load the required modules and frameworks
Once your code is added, you can run a cell using the Run icon to the left of the cell and the output is displayed below the code cell.
Run the following script to load all the required modules and frameworks.
import aiohttp
import pandas as pd
import datetime
from IPython.display import Image, display
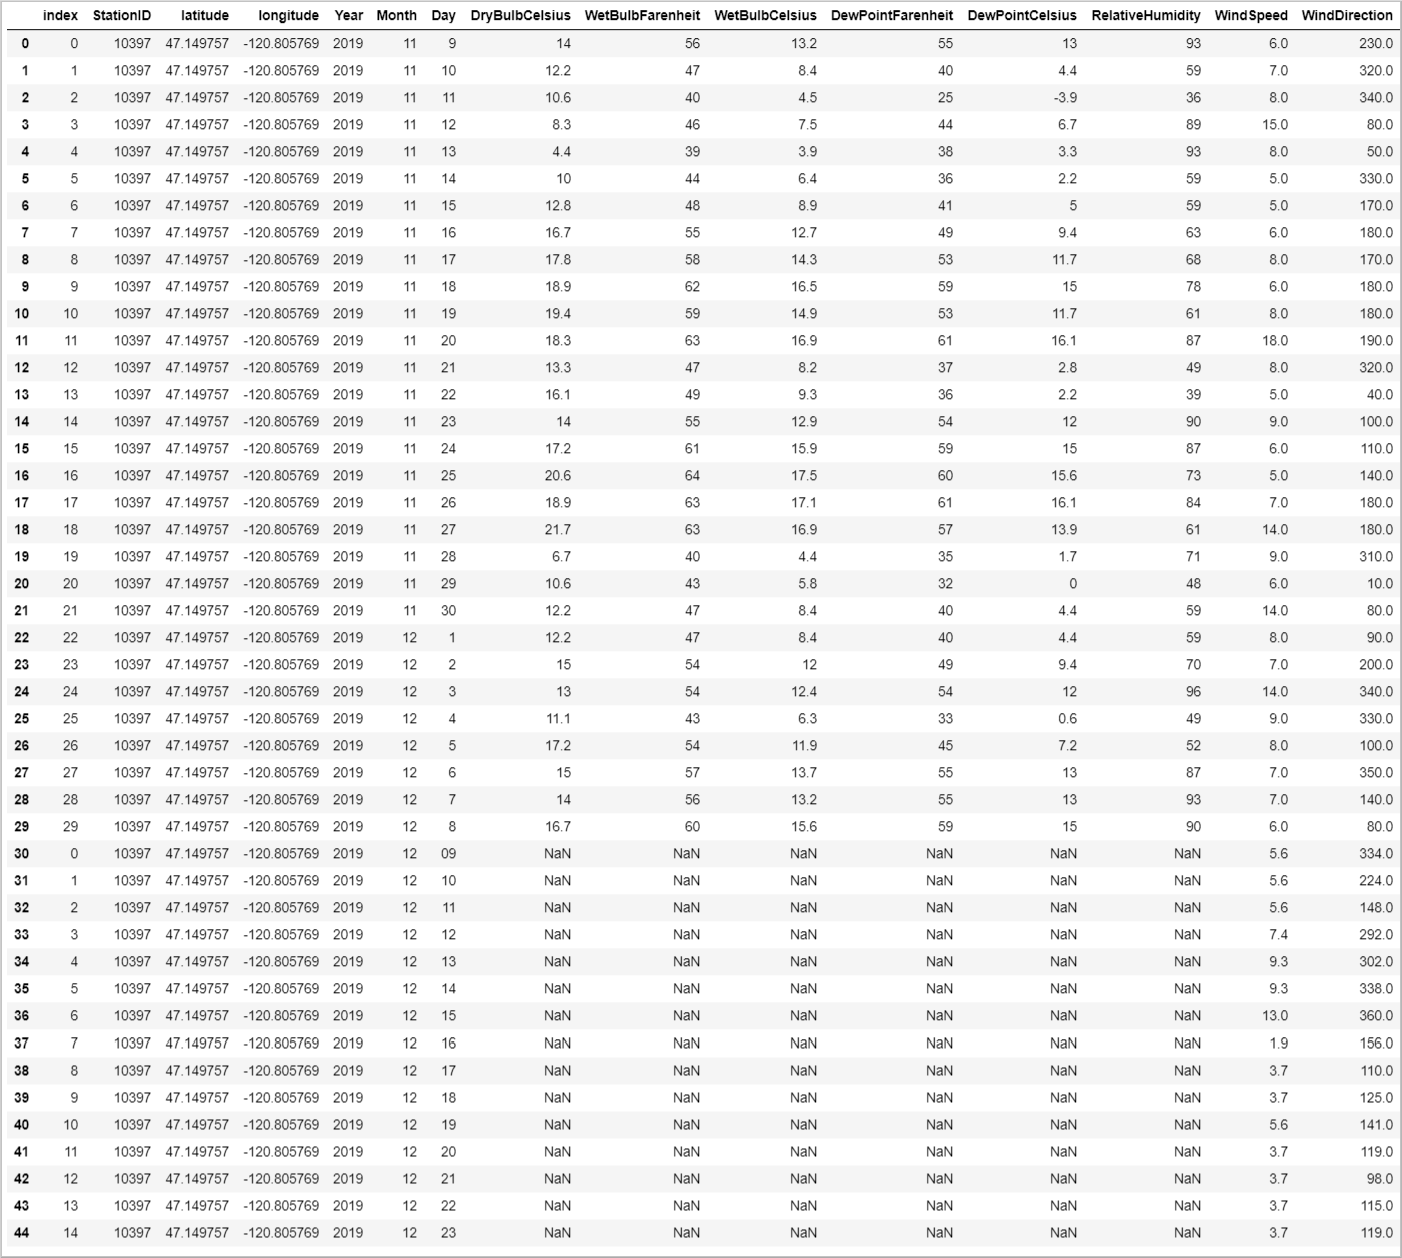
Import weather data
This tutorial uses weather data readings from sensors installed at four different wind turbines. The sample data consists of 30 days of weather readings. These readings are gathered from weather data centers near each turbine location. The demo data contains data readings for temperature, wind speed and, direction. You can download the demo data contained in weather_dataset_demo.csv from GitHub. The script below imports demo data to the Azure Notebook.
df = pd.read_csv("./data/weather_dataset_demo.csv")
Request daily forecast data
In our scenario, we would like to request daily forecast for each sensor location. The following script calls the Daily Forecast API of the Azure Maps Weather service. This API returns weather forecast for each wind turbine, for the next 15 days from the current date.
subscription_key = "Your Azure Maps key"

# Get a lists of unique station IDs and their coordinates
station_ids = pd.unique(df[['StationID']].values.ravel())
coords = pd.unique(df[['latitude','longitude']].values.ravel())

years,months,days = [],[],[]
dates_check=set()
wind_speeds, wind_direction = [], []

# Call azure maps Weather service to get daily forecast data for 15 days from current date
session = aiohttp.ClientSession()
j=-1
for i in range(0, len(coords), 2):
    wind_speeds.append([])
    wind_direction.append([])

    query = str(coords[i])+', '+str(coords[i+1])
    forecast_response = await(await session.get("https://atlas.microsoft.com/weather/forecast/daily/json?query={}&api-version=1.0&subscription-key={}&duration=15".format(query, subscription_key))).json()
    j+=1
    for day in range(len(forecast_response['forecasts'])):
            date = forecast_response['forecasts'][day]['date'][:10]
            wind_speeds[j].append(forecast_response['forecasts'][day]['day']['wind']['speed']['value'])
            wind_direction[j].append(forecast_response['forecasts'][day]['day']['windGust']['direction']['degrees'])

            if date not in dates_check:
                year,month,day= date.split('-')
                years.append(year)
                months.append(month)
                days.append(day)
                dates_check.add(date)

await session.close()
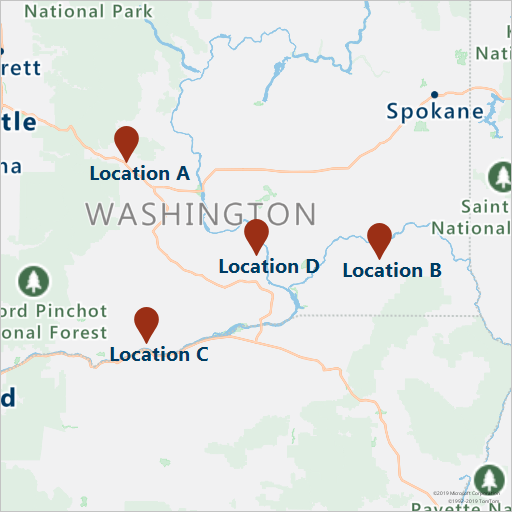
The following script renders the turbine locations on the map by calling the Get Map Image service.
# Render the turbine locations on the map by calling the Azure Maps Get Map Image service
session = aiohttp.ClientSession()
pins="default|la-25+60|ls12|lc003C62|co9B2F15||'Location A'{} {}|'Location B'{} {}|'Location C'{} {}|'Location D'{} {}".format(coords[1],coords[0],coords[3],coords[2],coords[5],coords[4], coords[7],coords[6])
image_response = "https://atlas.microsoft.com/map/static?subscription-key={}&api-version=2024-04-01&layer=basic&style=main&zoom=6¢er={},{}&pins={}".format(subscription_key,coords[7],coords[6],pins)
static_map_response = await session.get(image_response)
poi_range_map = await static_map_response.content.read()
await session.close()
display(Image(poi_range_map))
Group the forecast data with the demo data based on the station ID. The station ID is for the weather data center. This grouping augments the demo data with the forecast data.
# Group forecasted data for all locations
df = df.reset_index(drop=True)
forecast_data = pd.DataFrame(columns=['StationID','latitude','longitude','Year','Month','Day','DryBulbCelsius','WetBulbFarenheit','WetBulbCelsius','DewPointFarenheit','DewPointCelsius','RelativeHumidity','WindSpeed','WindDirection'])

for i in range(len(station_ids)):
    loc_forecast = pd.DataFrame({'StationID':station_ids[i], 'latitude':coords[0], 'longitude':coords[1], 'Year':years, 'Month':months, 'Day':days, 'WindSpeed':wind_speeds[i], 'WindDirection':wind_direction[i]})
    forecast_data = pd.concat([forecast_data,loc_forecast], axis=0, sort=False)

combined_weather_data = pd.concat([df,forecast_data])
grouped_weather_data = combined_weather_data.groupby(['StationID'])
The following table displays the combined historical and forecast data for one of the turbine locations.
# Display data for first location
grouped_weather_data.get_group(station_ids[0]).reset_index()
Plot forecast data
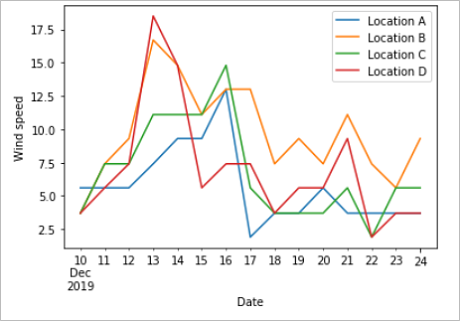
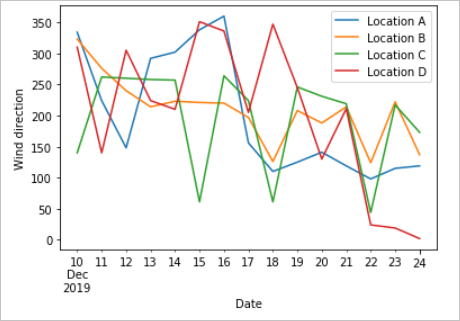
Plot the forecasted values against the days for which they're forecasted. This plot allows us to see the speed and direction changes of the wind for the next 15 days.
# Plot wind speed
curr_date = datetime.datetime.now().date()
windsPlot_df = pd.DataFrame({ 'Location A': wind_speeds[0], 'Location B': wind_speeds[1], 'Location C': wind_speeds[2], 'Location D': wind_speeds[3]}, index=pd.date_range(curr_date,periods=15))
windsPlot = windsPlot_df.plot.line()
windsPlot.set_xlabel("Date")
windsPlot.set_ylabel("Wind speed")
#Plot wind direction
windsPlot_df = pd.DataFrame({ 'Location A': wind_direction[0], 'Location B': wind_direction[1], 'Location C': wind_direction[2], 'Location D': wind_direction[3]}, index=pd.date_range(curr_date,periods=15))
windsPlot = windsPlot_df.plot.line()
windsPlot.set_xlabel("Date")
windsPlot.set_ylabel("Wind direction")
The following graphs visualize the forecast data. For the change of wind speed, see the left graph. For change in wind direction, see the right graph. This data is prediction for next 15 days from the day the data is requested.
In this tutorial, you learned how to call Azure Maps REST APIs to get weather forecast data. You also learned how to visualize the data on graphs.
To explore the Azure Maps APIs that are used in this tutorial, see:
For a complete list of Azure Maps REST APIs, see Azure Maps REST APIs.