Investigate errors by using the ITSMC dashboard
This article contains information about the IT Service Management Connector (ITSMC) dashboard. The dashboard helps you to investigate the status of your connector.
View errors
To view errors in the dashboard:
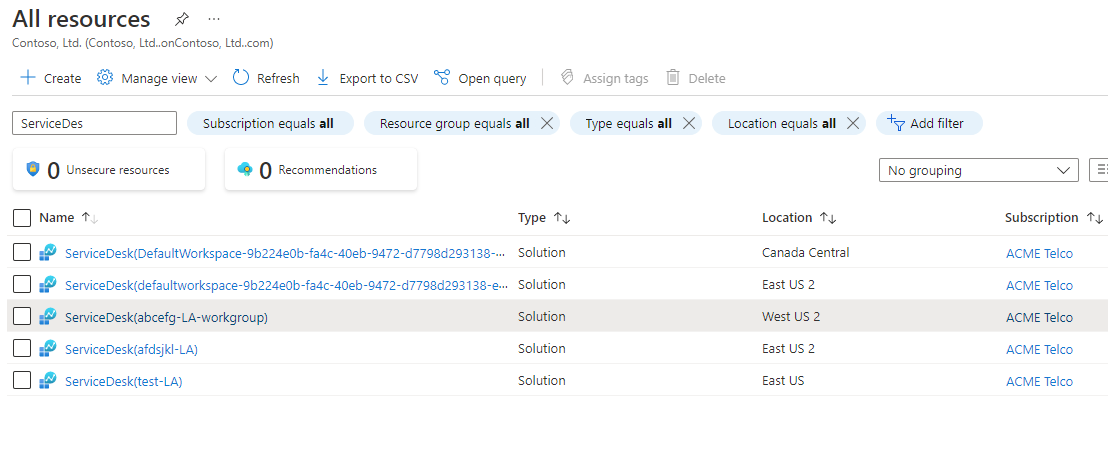
In the Azure portal, select All resources, then find and select your Service Desk.
In the Service Desk window, select View Summary.
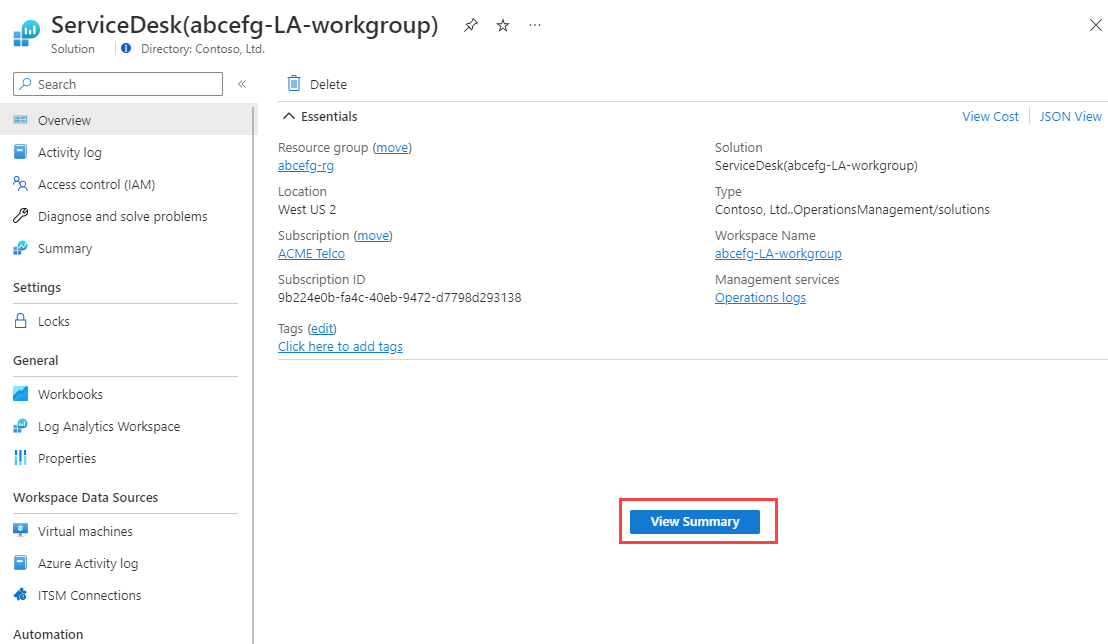
Select the graph that appears in the IT Service Management Connector section.
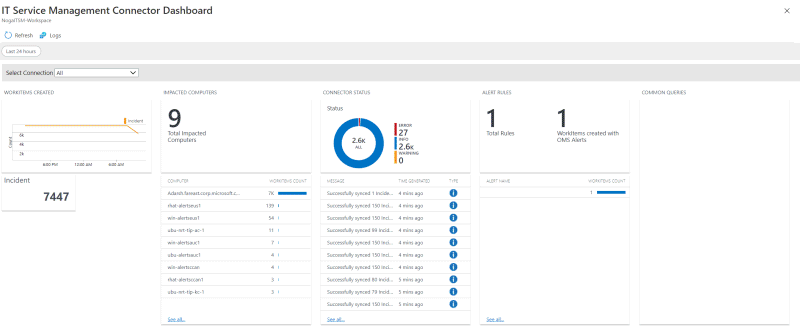
The IT Service Management Connector Dashboard opens with information about status and errors.


Understand dashboard elements
The dashboard contains information on the alerts that were sent to the ITSM tool through this connector. The dashboard is split into four parts.
Created work items
In the WORK ITEMS CREATED area, the graph and the table below it contain the count of the work items per type. If you select the graph or the table, you can see more details about the work items.

Affected computers
In the IMPACTED COMPUTERS area, the table lists computers and their associated work items. By selecting rows in the tables, you can get more details about the computers.
The table contains a limited number of rows. If you want to see all the rows, select See all.

Connector status
In the CONNECTOR STATUS area, the graph and the table below it contain messages about the status of the connector. By selecting the graph or rows in the table, you can get more details about the messages.
The table contains a limited number of rows. If you want to see all the rows, select See all.
To learn more about the messages in the table, see this article.

Alert rules
In the ALERT RULES area, the table contains information on the number of alert rules that were detected. By selecting rows in the table, you can get more details about the detected rules.
The table contains a limited number of rows. If you want to see all the rows, select See all.

Feedback
Coming soon: Throughout 2024 we will be phasing out GitHub Issues as the feedback mechanism for content and replacing it with a new feedback system. For more information see: https://aka.ms/ContentUserFeedback.
Submit and view feedback for