Note
Access to this page requires authorization. You can try signing in or changing directories.
Access to this page requires authorization. You can try changing directories.
Autoinstrumentation, also referred to as runtime monitoring, is the easiest way to enable Application Insights for Azure App Service without requiring any code changes or advanced configurations. Based on your specific scenario, evaluate whether you require more advanced monitoring through manual instrumentation.
Note
On March 31, 2025, support for instrumentation key ingestion will end. Instrumentation key ingestion will continue to work, but we'll no longer provide updates or support for the feature. Transition to connection strings to take advantage of new capabilities.
Enable Application Insights
Important
If both autoinstrumentation monitoring and manual SDK-based instrumentation are detected, only the manual instrumentation settings are honored. This arrangement prevents duplicate data from being sent. To learn more, see Troubleshoot Application Insights integration with Azure App Service.
Note
- Only .NET Core Long Term Support (LTS) releases are supported.
- Trim self-contained deployments is not supported. Use manual instrumentation instead.
Autoinstrumentation in the Azure portal
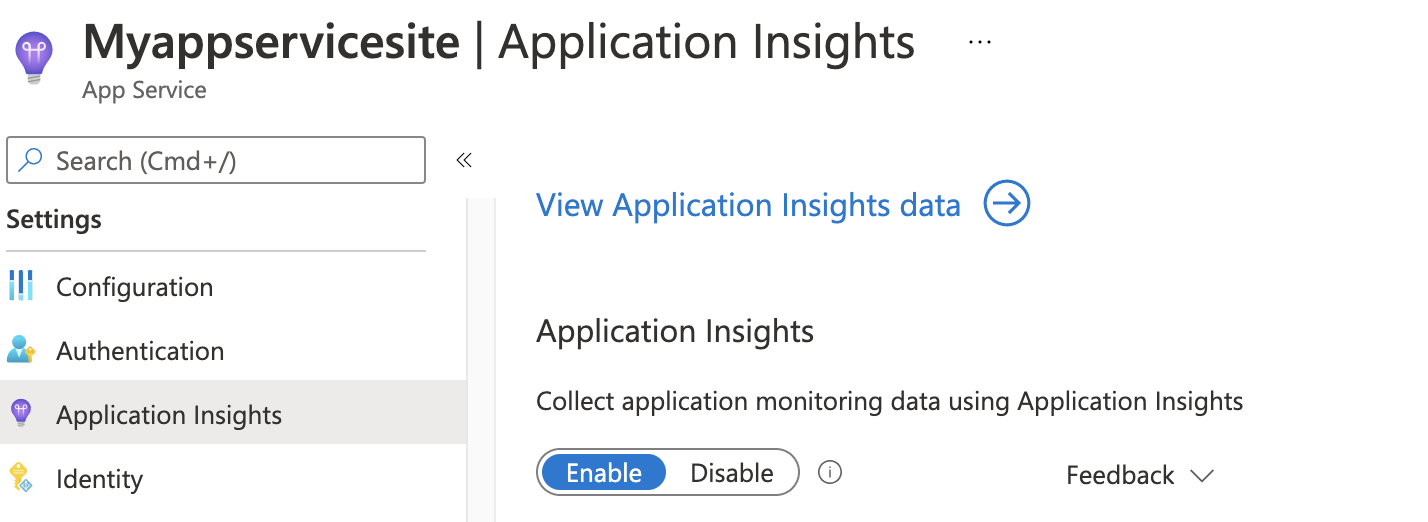
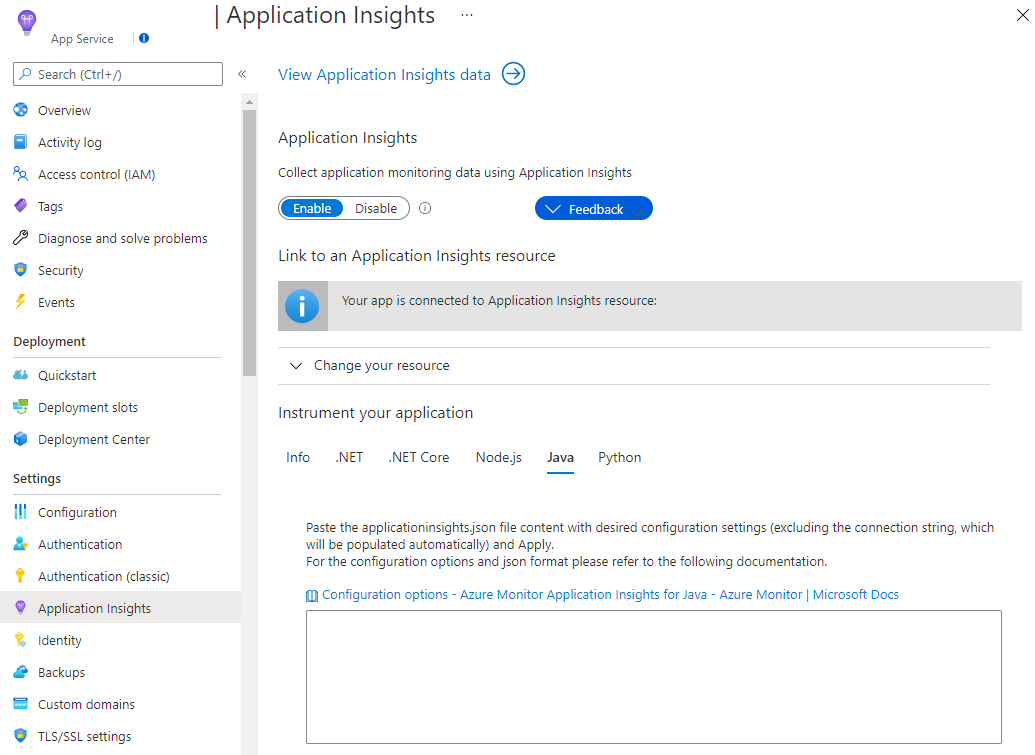
Select Application Insights in the left-hand navigation menu of your app service, then select Enable.
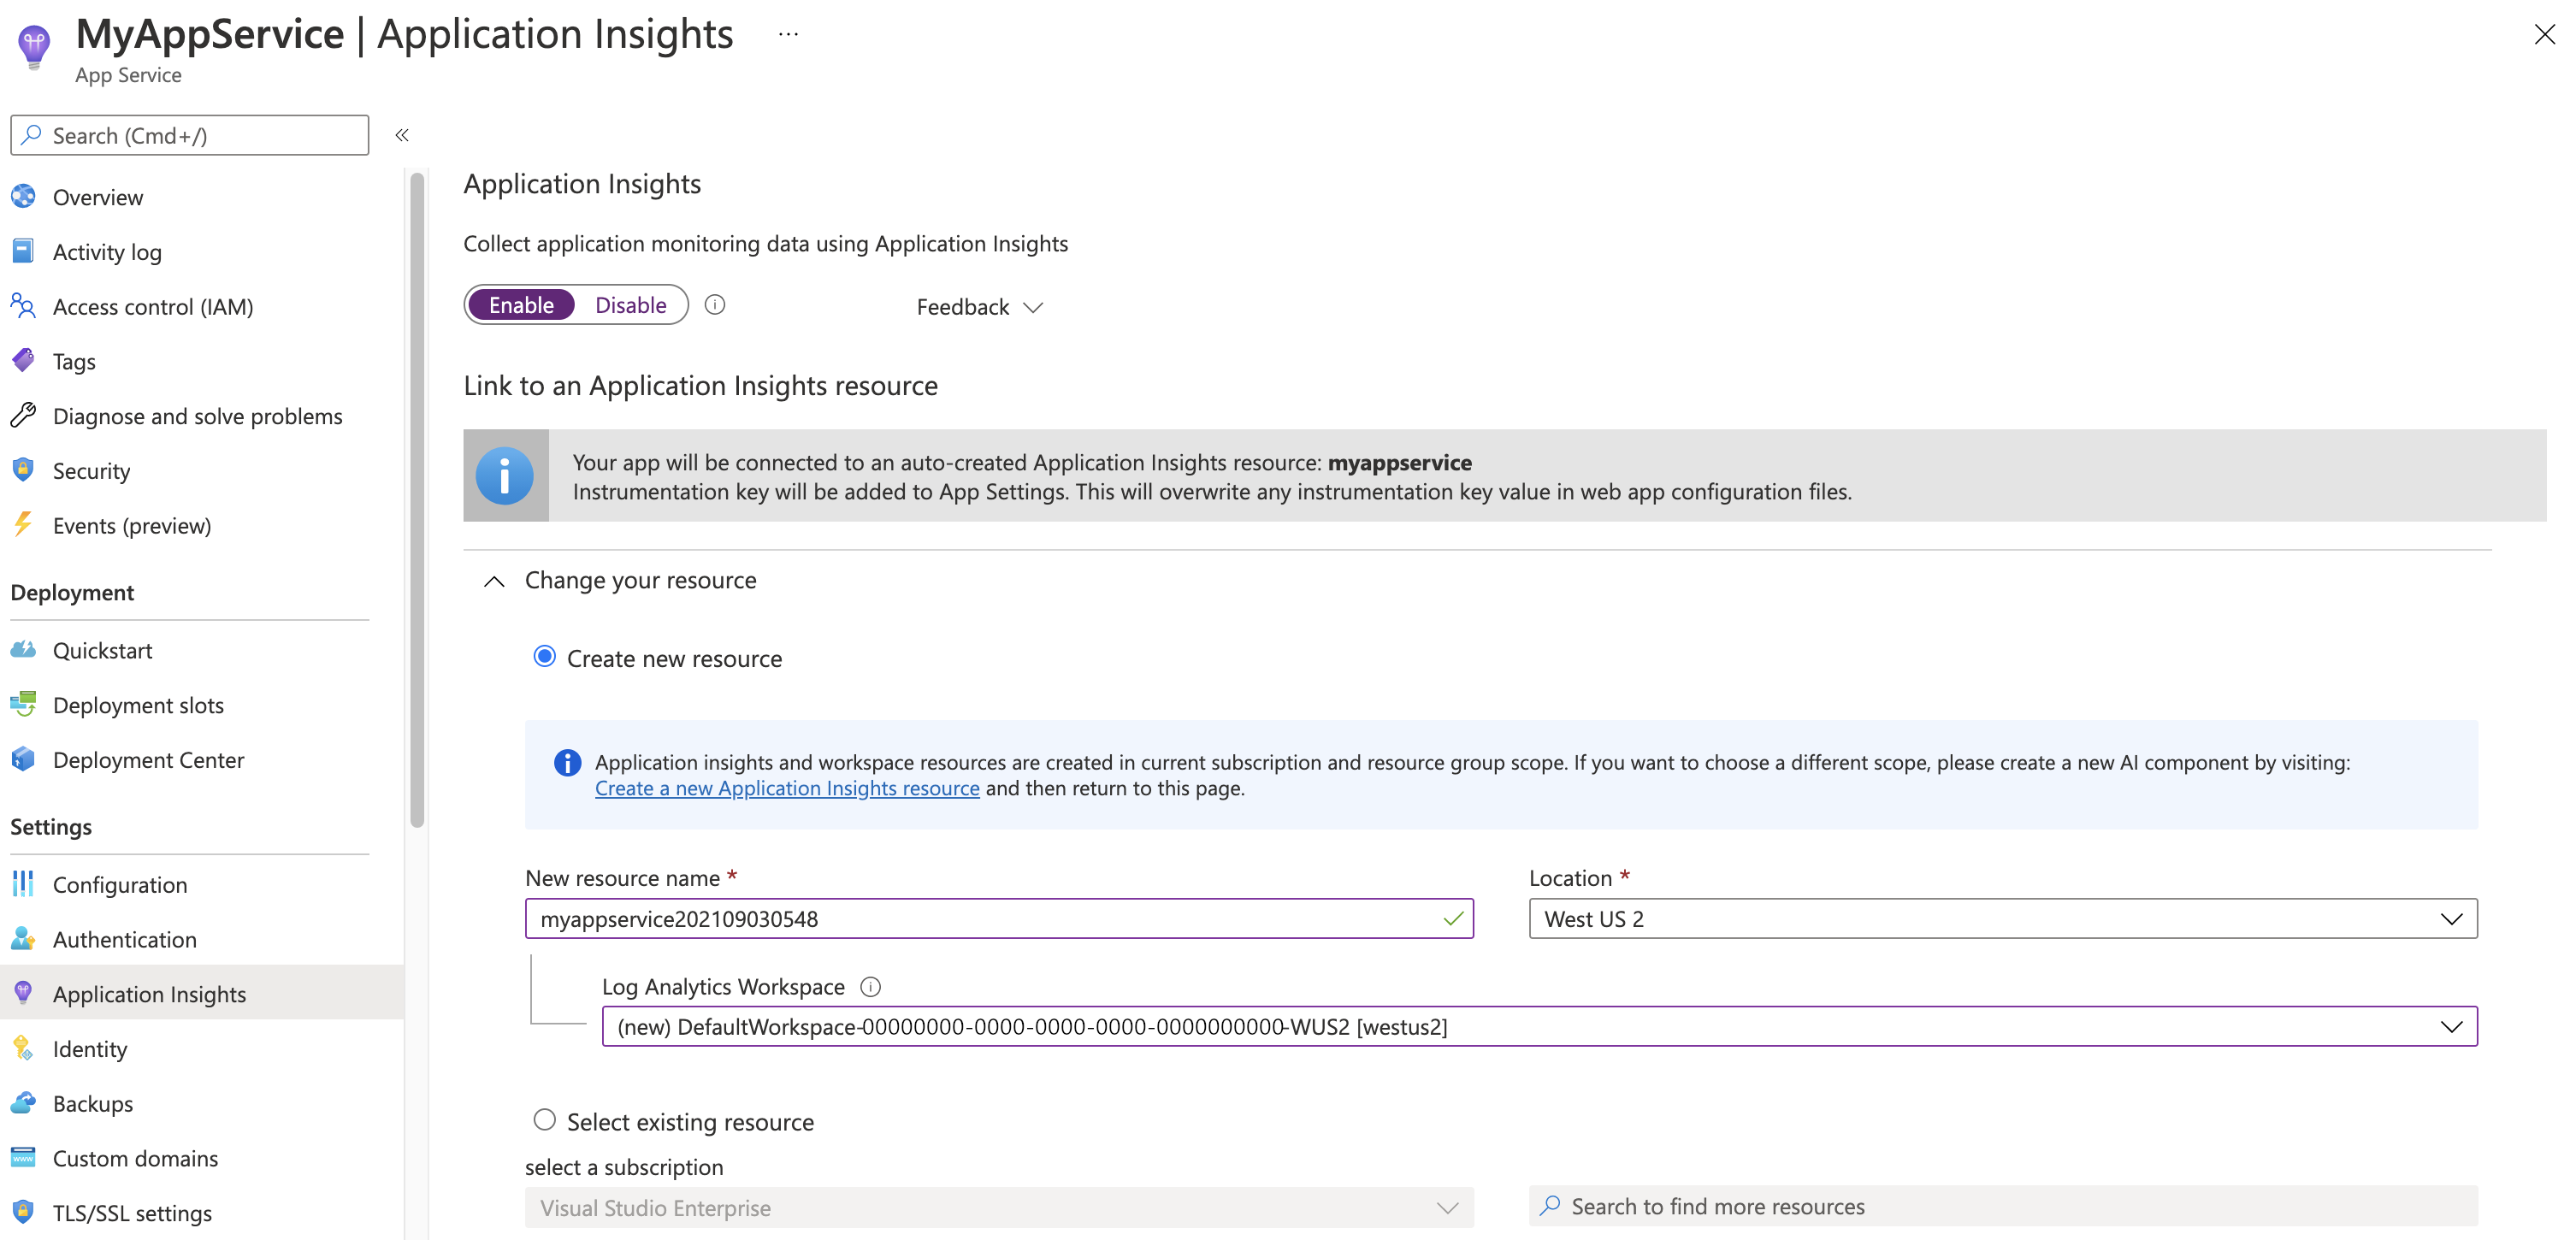
Create a new resource or select an existing Application Insights resource for this application.
Note
When you select OK to create a new resource, you're prompted to Apply monitoring settings. Selecting Continue links your new Application Insights resource to your app service. Your app service then restarts.
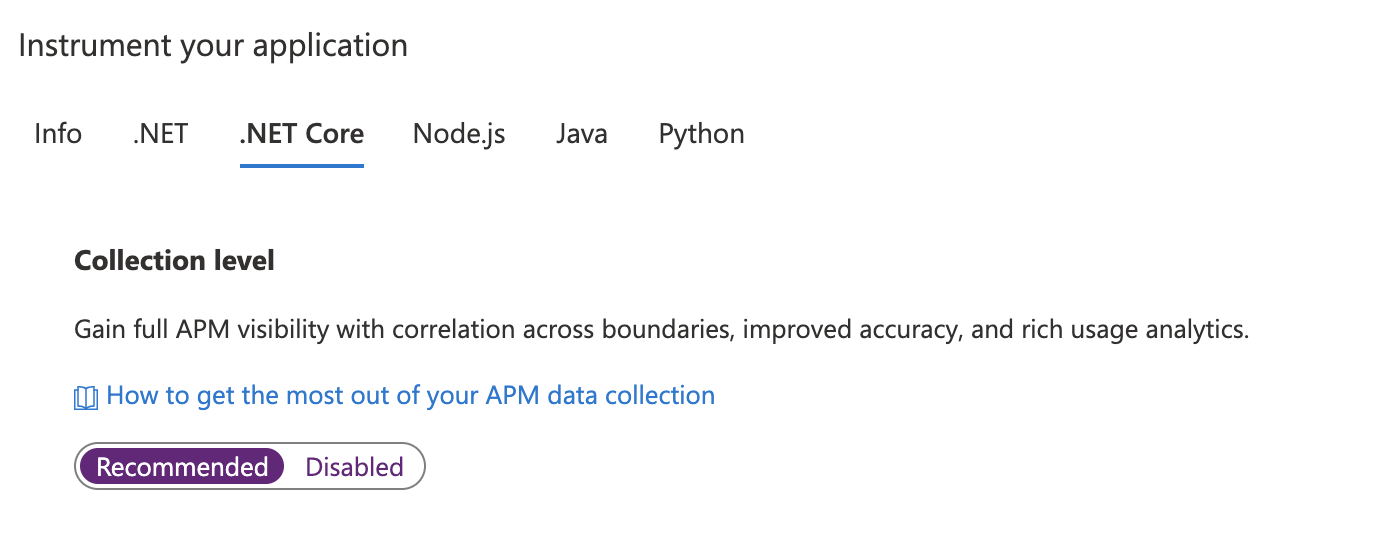
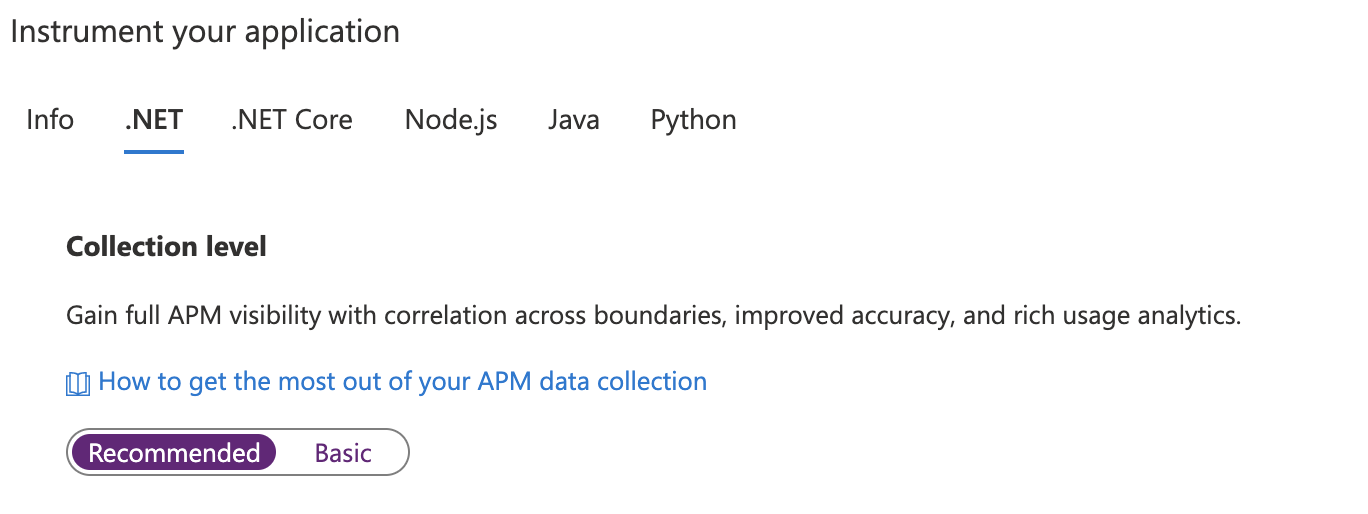
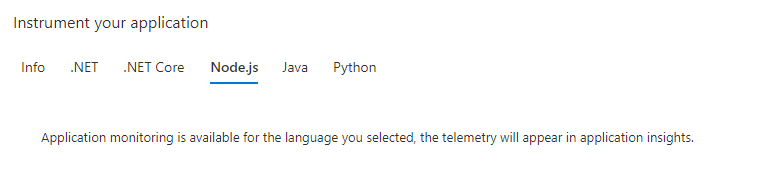
After you specify which resource to use, you can choose how you want Application Insights to collect data per platform for your application. ASP.NET Core collection options are Recommended or Disabled.

Manually upgrade the monitoring extension/agent
Upgrade from versions 2.8.9 and up
Upgrading from version 2.8.9 happens automatically, without any extra actions. The new monitoring bits are delivered in the background to the target app service, and are picked up on application restart.
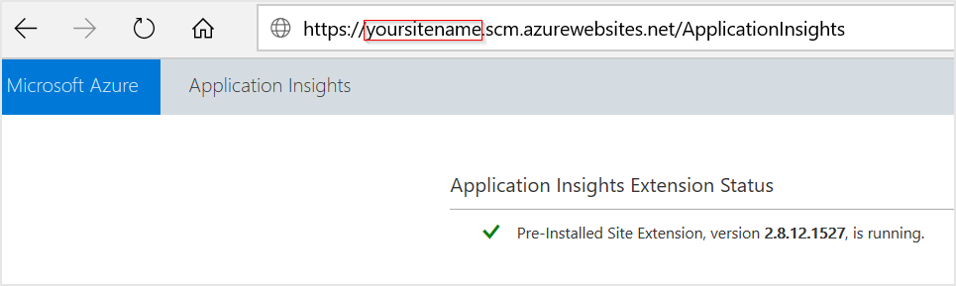
To check which version of the extension you're running, go to https://yoursitename.scm.azurewebsites.net/ApplicationInsights.
Upgrade from versions 1.0.0 - 2.6.5
Starting with version 2.8.9, the preinstalled site extension is used. If you're using an earlier version, you can update via one of two ways:
Upgrade by enabling via the Azure portal: Even if you have the Application Insights extension for App Service installed, the UI shows only the Enable button. Behind the scenes, the old private site extension is removed.
-
- Set the application settings to enable the preinstalled site extension
ApplicationInsightsAgent. For more information, see Enable through PowerShell. - Manually remove the private site extension named Application Insights extension for Azure App Service.
- Set the application settings to enable the preinstalled site extension
If the upgrade is done from a version before 2.5.1, check that the ApplicationInsights DLLs are removed from the application bin folder. For more information, see Troubleshoot Application Insights integration with Azure App Service.
Configure the monitoring extension/agent
We currently don't offer options to configure the monitoring extension for ASP.NET Core.
Enable client-side monitoring
Client-side monitoring is enabled by default for ASP.NET Core apps with Recommended collection, regardless of whether the app setting APPINSIGHTS_JAVASCRIPT_ENABLED is present.
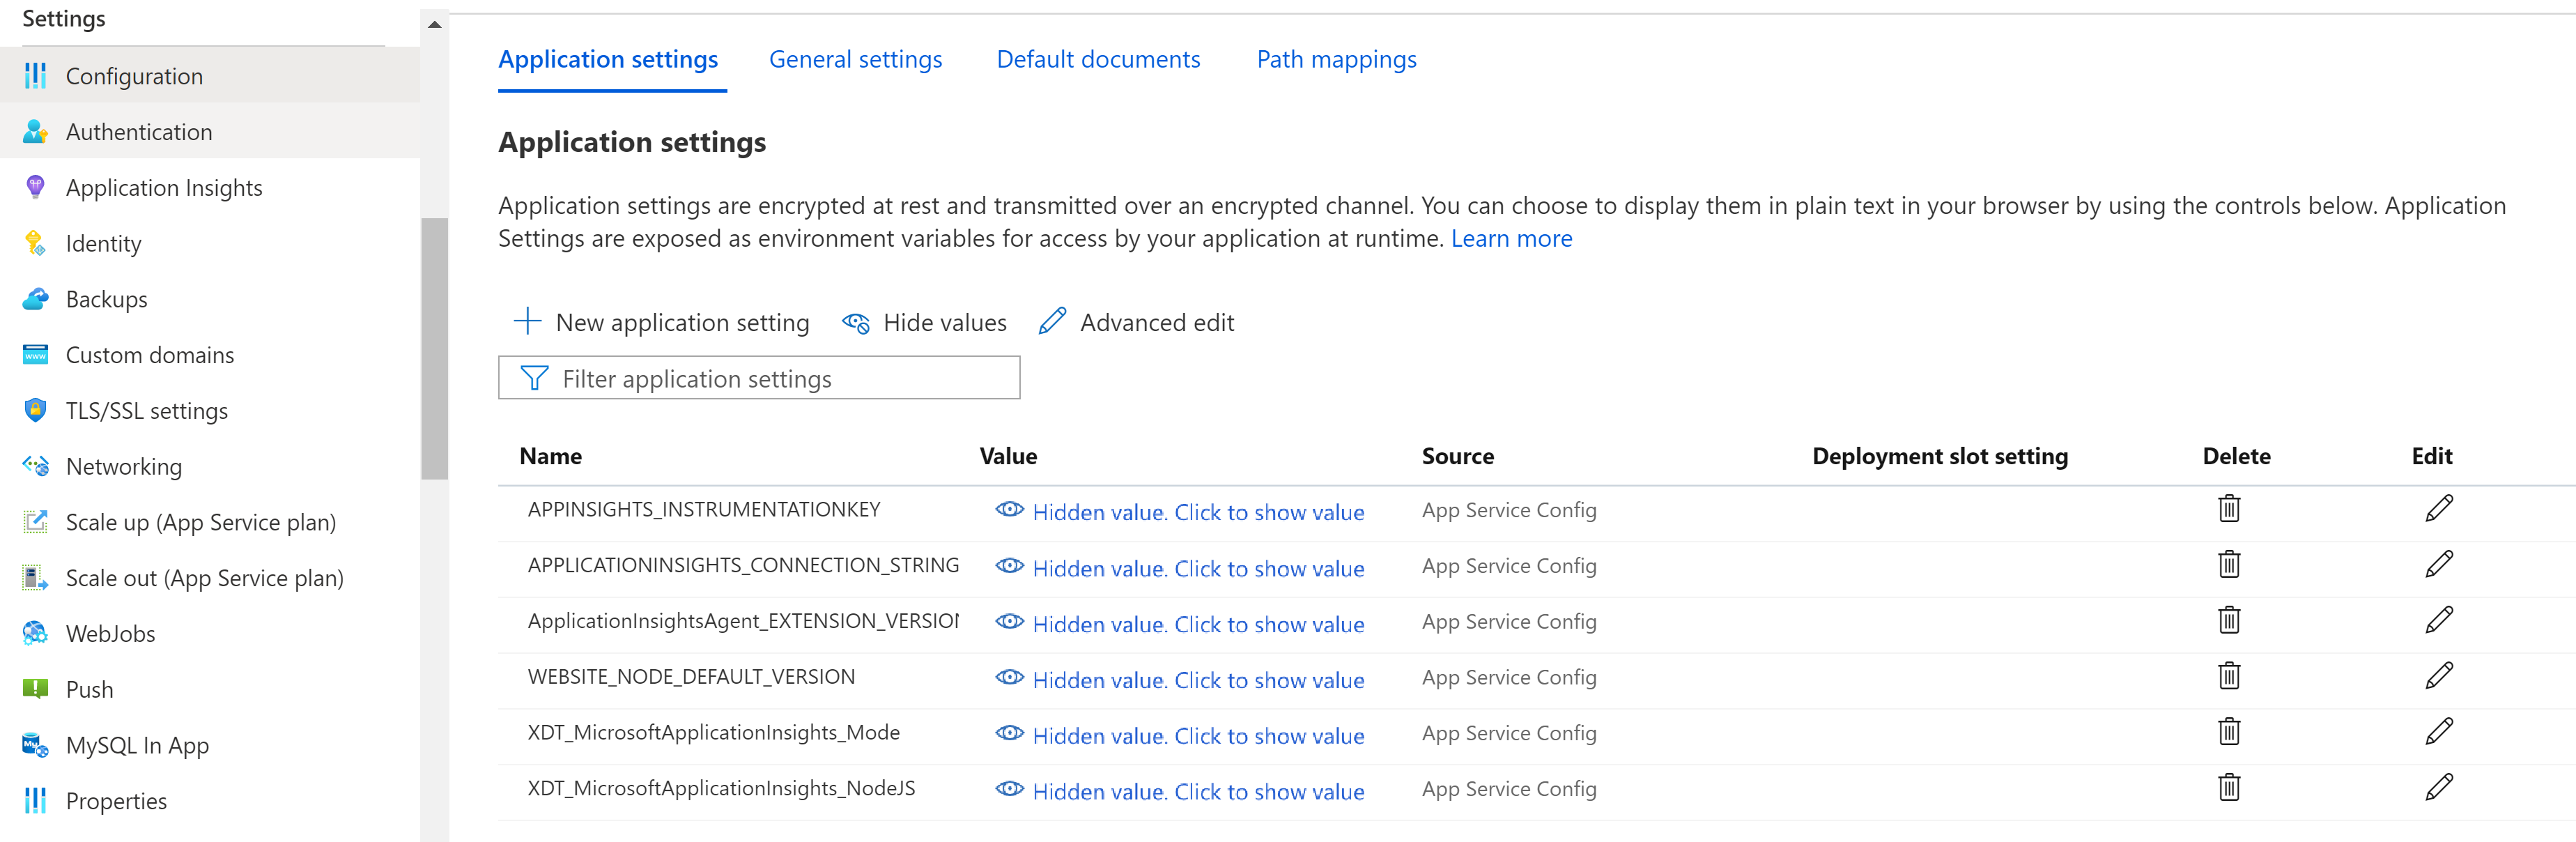
If you want to disable client-side monitoring:
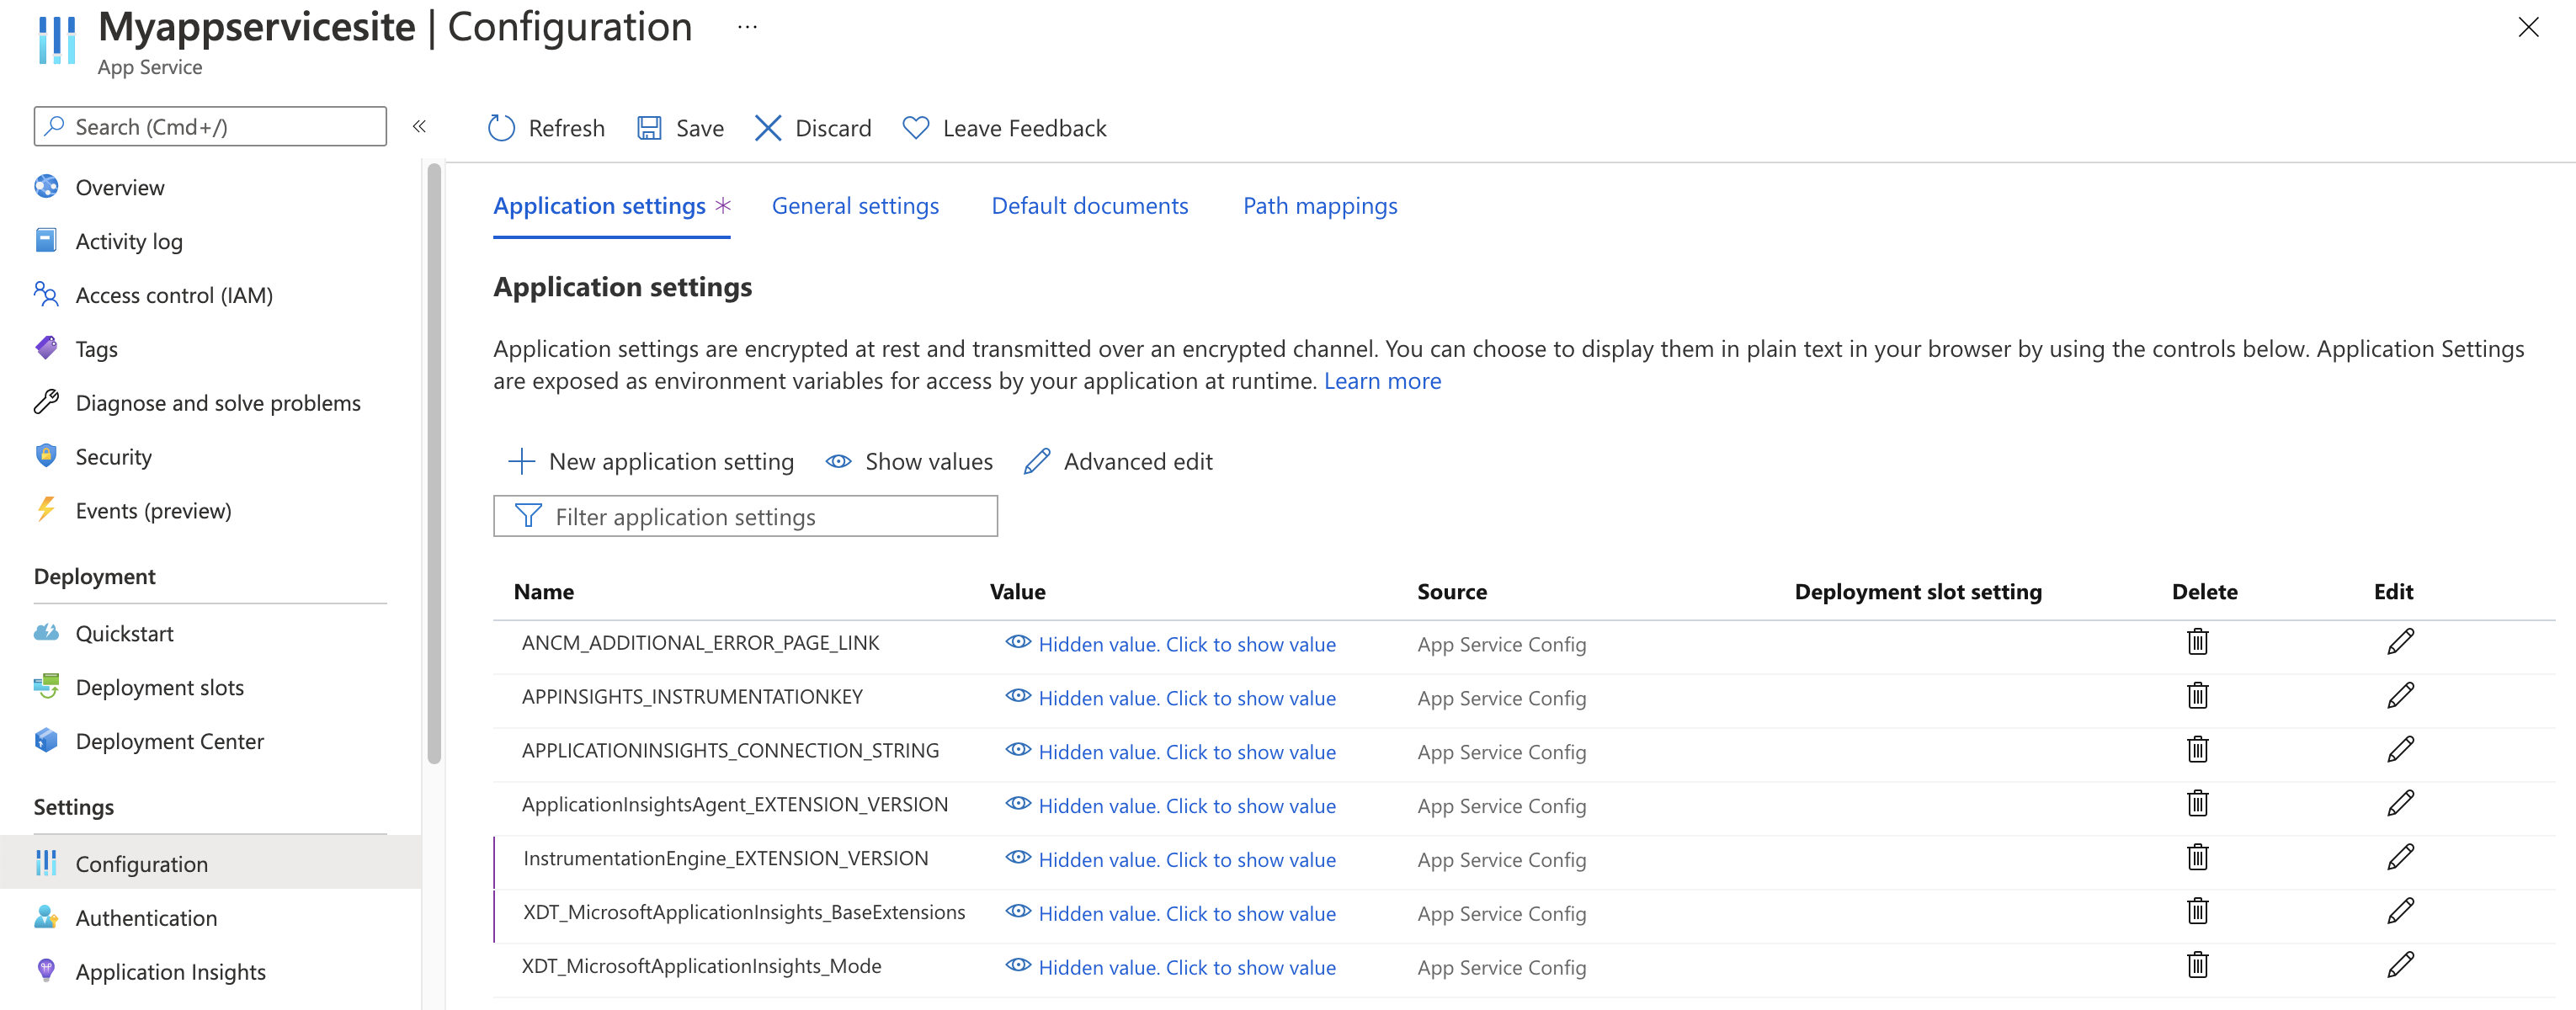
Select Settings > Configuration.
Under Application settings, create a New application setting with the following information:
- Name:
APPINSIGHTS_JAVASCRIPT_ENABLED - Value:
false
- Name:
Save the settings. Restart your app.
Automate monitoring
In order to enable telemetry collection with Application Insights, only the following Application settings need to be set:
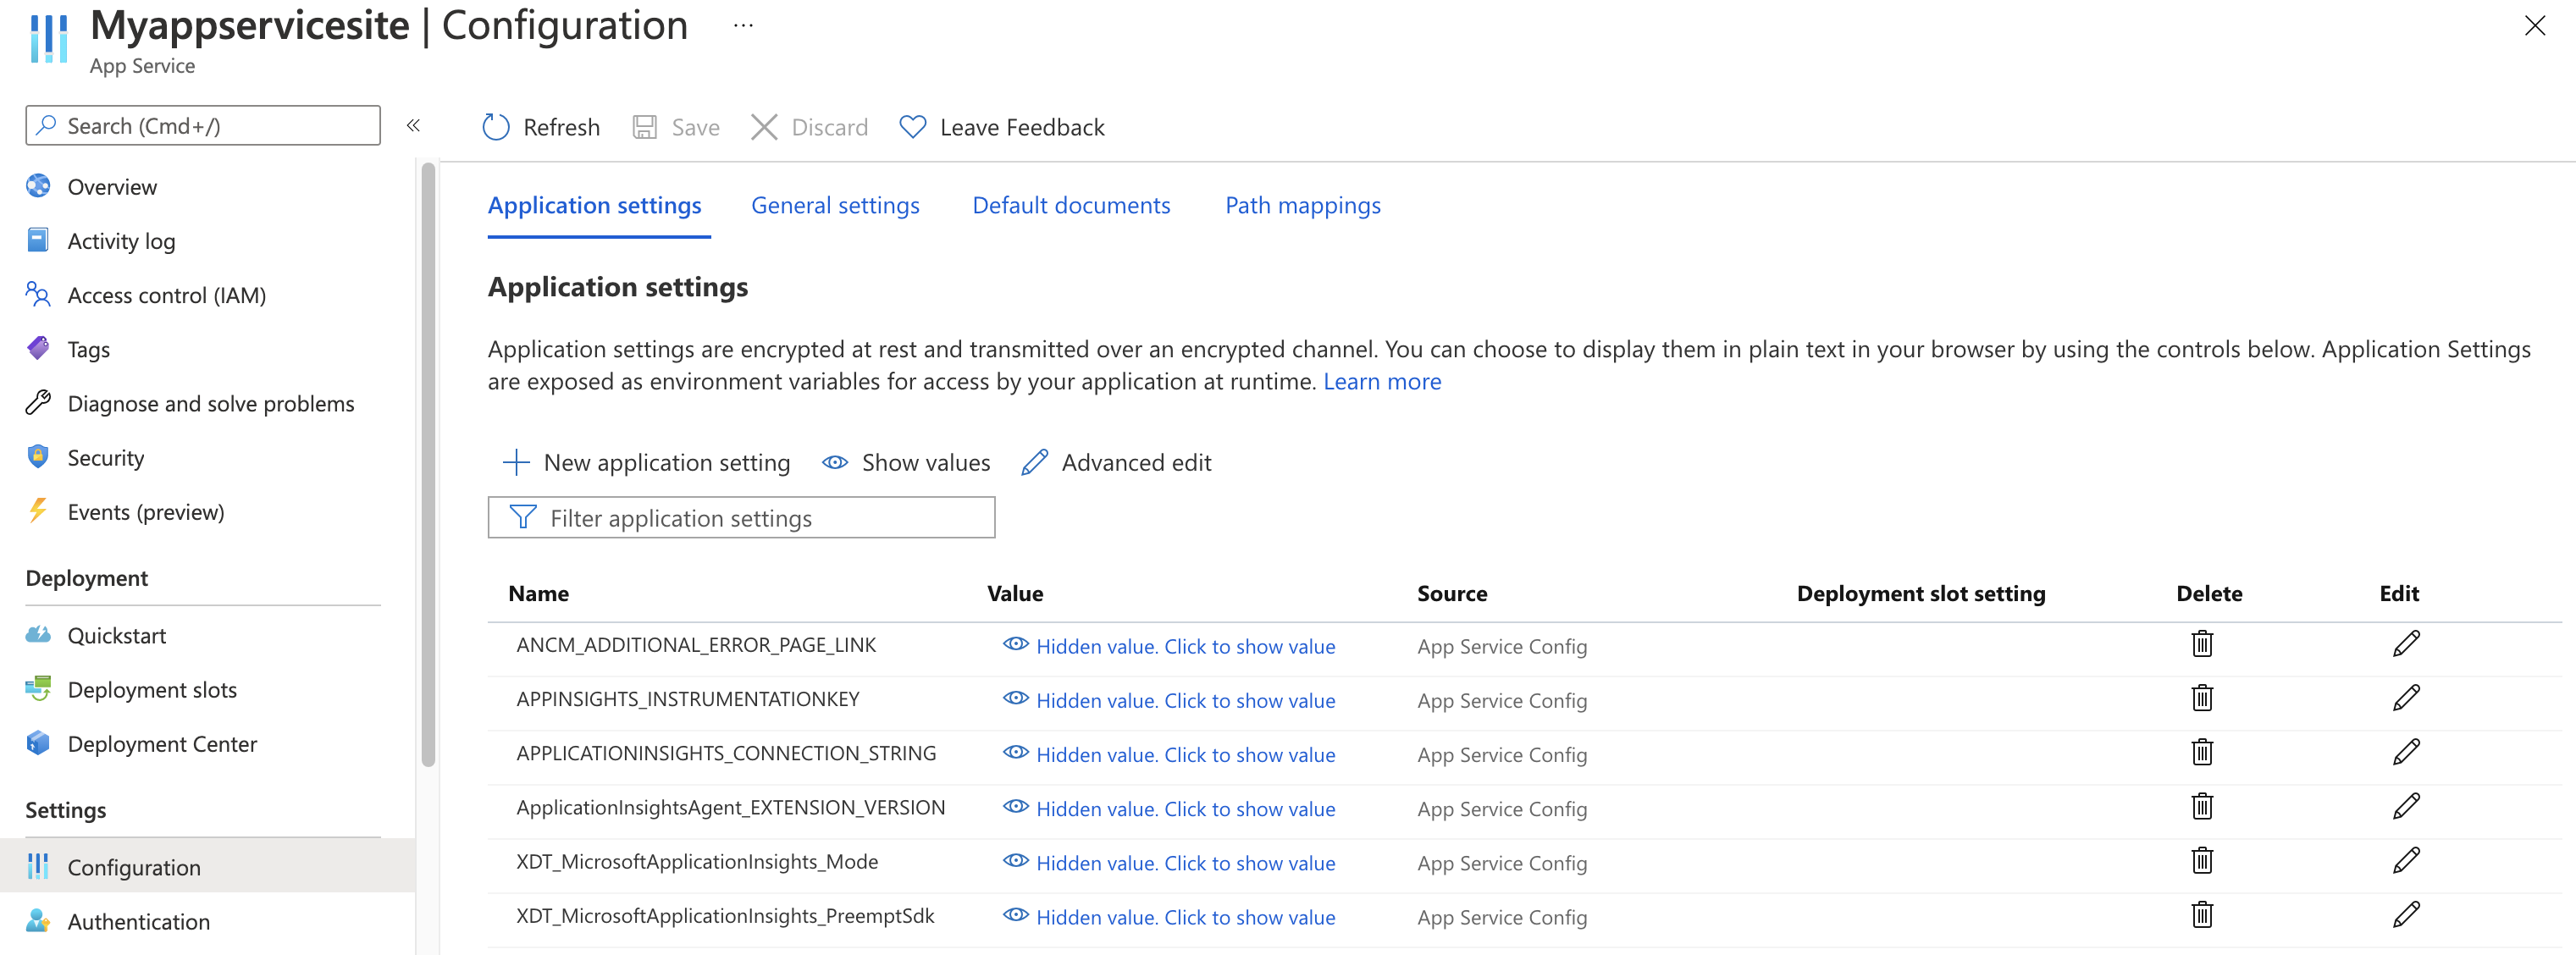
Application settings definitions
| App setting name | Definition | Value |
|---|---|---|
| ApplicationInsightsAgent_EXTENSION_VERSION | Main extension, which controls runtime monitoring. | ~2 for Windows or ~3 for Linux |
| XDT_MicrosoftApplicationInsights_Mode | In default mode, only essential features are enabled to ensure optimal performance. | disabled or recommended. |
| XDT_MicrosoftApplicationInsights_PreemptSdk | For ASP.NET Core apps only. Enables Interop (interoperation) with the Application Insights SDK. Loads the extension side by side with the SDK and uses it to send telemetry. (Disables the Application Insights SDK.) | 1 |


App Service application settings with Azure Resource Manager
Application settings for Azure App Service can be managed and configured with Azure Resource Manager templates. You can use this method when you deploy new App Service resources with Resource Manager automation or modify the settings of existing resources.
The basic structure of the application settings JSON for an App Service resource:
      "resources": [
        {
          "name": "appsettings",
          "type": "config",
          "apiVersion": "2015-08-01",
          "dependsOn": [
            "[resourceId('Microsoft.Web/sites', variables('webSiteName'))]"
          ],
          "tags": {
            "displayName": "Application Insights Settings"
          },
          "properties": {
            "key1": "value1",
            "key2": "value2"
          }
        }
      ]
Automate the creation of an Application Insights resource and link to your newly created App Service resource
To create a Resource Manager template with the default Application Insights settings, begin the process as if you were going to create a new web app with Application Insights enabled.
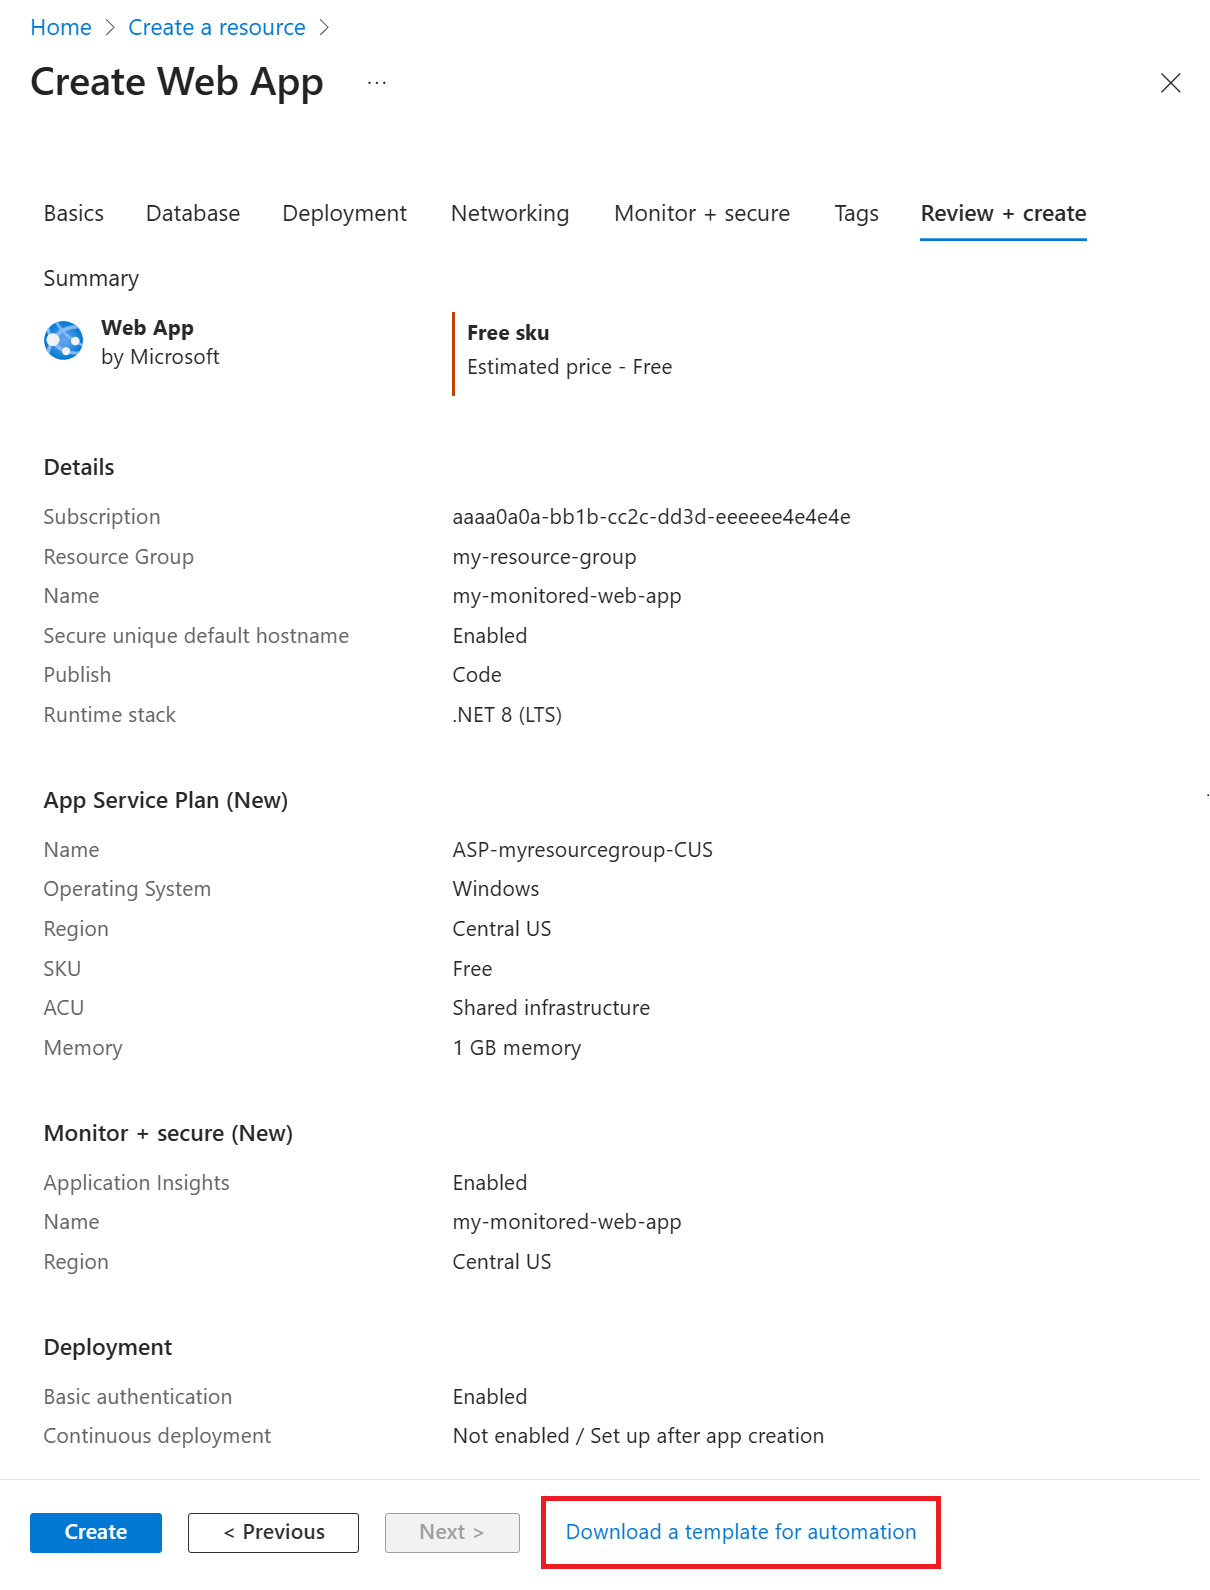
In the Azure portal, create a new Web App resource with your desired information. Enable Application Insights on the Monitor + secure tab.
Go to Review + create, then select Download a template for automation. This option generates the latest Resource Manager template with all required settings configured.

Note
The following example template is for a .NET 8 (LTS) application running on Windows. It uses the placeholders my-monitored-web-app for the name of the application and aaaa0a0a-bb1b-cc2c-dd3d-eeeeee4e4e4e for the subscription ID.
We don't recommend copying and using it directly. Instead, generate your own template based on the instructions above.
Expand to view example template
{
    "$schema": "http://schema.management.azure.com/schemas/2015-01-01/deploymentTemplate.json#",
    "contentVersion": "1.0.0.0",
    "parameters": {
        "subscriptionId": {
            "type": "string"
        },
        "resourceGroupName": {
            "type": "string"
        },
        "name": {
            "type": "string"
        },
        "location": {
            "type": "string"
        },
        "hostingPlanName": {
            "type": "string"
        },
        "serverFarmResourceGroup": {
            "type": "string"
        },
        "alwaysOn": {
            "type": "bool"
        },
        "ftpsState": {
            "type": "string"
        },
        "autoGeneratedDomainNameLabelScope": {
            "type": "string"
        },
        "sku": {
            "type": "string"
        },
        "skuCode": {
            "type": "string"
        },
        "workerSize": {
            "type": "string"
        },
        "workerSizeId": {
            "type": "string"
        },
        "numberOfWorkers": {
            "type": "string"
        },
        "currentStack": {
            "type": "string"
        },
        "phpVersion": {
            "type": "string"
        },
        "netFrameworkVersion": {
            "type": "string"
        }
    },
    "variables": {},
    "resources": [
        {
            "apiVersion": "2022-03-01",
            "name": "[parameters('name')]",
            "type": "Microsoft.Web/sites",
            "location": "[parameters('location')]",
            "tags": null,
            "dependsOn": [
                "microsoft.insights/components/my-monitored-web-app",
                "[concat('Microsoft.Web/serverfarms/', parameters('hostingPlanName'))]"
            ],
            "properties": {
                "name": "[parameters('name')]",
                "siteConfig": {
                    "appSettings": [
                        {
                            "name": "APPLICATIONINSIGHTS_CONNECTION_STRING",
                            "value": "[reference('microsoft.insights/components/my-monitored-web-app', '2015-05-01').ConnectionString]"
                        },
                        {
                            "name": "ApplicationInsightsAgent_EXTENSION_VERSION",
                            "value": "~2"
                        },
                        {
                            "name": "XDT_MicrosoftApplicationInsights_Mode",
                            "value": "default"
                        }
                    ],
                    "metadata": [
                        {
                            "name": "CURRENT_STACK",
                            "value": "[parameters('currentStack')]"
                        }
                    ],
                    "phpVersion": "[parameters('phpVersion')]",
                    "netFrameworkVersion": "[parameters('netFrameworkVersion')]",
                    "alwaysOn": "[parameters('alwaysOn')]",
                    "ftpsState": "[parameters('ftpsState')]"
                },
                "serverFarmId": "[concat('/subscriptions/', parameters('subscriptionId'),'/resourcegroups/', parameters('serverFarmResourceGroup'), '/providers/Microsoft.Web/serverfarms/', parameters('hostingPlanName'))]",
                "clientAffinityEnabled": true,
                "virtualNetworkSubnetId": null,
                "httpsOnly": true,
                "publicNetworkAccess": "Enabled",
                "autoGeneratedDomainNameLabelScope": "[parameters('autoGeneratedDomainNameLabelScope')]"
            },
            "resources": [
                {
                    "type": "Microsoft.Web/sites/basicPublishingCredentialsPolicies",
                    "apiVersion": "2022-09-01",
                    "name": "[concat(parameters('name'), '/scm')]",
                    "properties": {
                        "allow": true
                    },
                    "dependsOn": [
                        "[resourceId('Microsoft.Web/Sites', parameters('name'))]"
                    ]
                },
                {
                    "type": "Microsoft.Web/sites/basicPublishingCredentialsPolicies",
                    "apiVersion": "2022-09-01",
                    "name": "[concat(parameters('name'), '/ftp')]",
                    "properties": {
                        "allow": true
                    },
                    "dependsOn": [
                        "[resourceId('Microsoft.Web/Sites', parameters('name'))]"
                    ]
                }
            ]
        },
        {
            "apiVersion": "2018-11-01",
            "name": "[parameters('hostingPlanName')]",
            "type": "Microsoft.Web/serverfarms",
            "location": "[parameters('location')]",
            "kind": "",
            "tags": null,
            "dependsOn": [],
            "properties": {
                "name": "[parameters('hostingPlanName')]",
                "workerSize": "[parameters('workerSize')]",
                "workerSizeId": "[parameters('workerSizeId')]",
                "numberOfWorkers": "[parameters('numberOfWorkers')]",
                "zoneRedundant": false
            },
            "sku": {
                "Tier": "[parameters('sku')]",
                "Name": "[parameters('skuCode')]"
            }
        },
        {
            "apiVersion": "2020-02-02-preview",
            "name": "my-monitored-web-app",
            "type": "microsoft.insights/components",
            "location": "centralus",
            "tags": null,
            "dependsOn": [
                "newWorkspaceTemplate"
            ],
            "properties": {
                "ApplicationId": "[parameters('name')]",
                "Request_Source": "IbizaWebAppExtensionCreate",
                "Flow_Type": "Redfield",
                "Application_Type": "web",
                "WorkspaceResourceId": "/subscriptions/aaaa0a0a-bb1b-cc2c-dd3d-eeeeee4e4e4e/resourceGroups/DefaultResourceGroup-CUS/providers/Microsoft.OperationalInsights/workspaces/DefaultWorkspace-aaaa0a0a-bb1b-cc2c-dd3d-eeeeee4e4e4e-CUS"
            }
        },
        {
            "type": "Microsoft.Resources/deployments",
            "apiVersion": "2021-04-01",
            "name": "newWorkspaceTemplate",
            "resourceGroup": "DefaultResourceGroup-CUS",
            "subscriptionId": "[parameters('subscriptionId')]",
            "properties": {
                "mode": "Incremental",
                "template": {
                    "$schema": "https://schema.management.azure.com/schemas/2015-01-01/deploymentTemplate.json#",
                    "contentVersion": "1.0.0.0",
                    "parameters": {},
                    "variables": {},
                    "resources": [
                        {
                            "apiVersion": "2020-08-01",
                            "name": "DefaultWorkspace-aaaa0a0a-bb1b-cc2c-dd3d-eeeeee4e4e4e-CUS",
                            "type": "Microsoft.OperationalInsights/workspaces",
                            "location": "centralus",
                            "properties": {}
                        }
                    ]
                }
            }
        }
    ]
}
Enable through PowerShell
To enable the application monitoring through PowerShell, only the underlying application settings must be changed. The following sample enables application monitoring for a website called my-monitored-web-app in the resource group my-resource-group. It configures data to be sent to the InstrumentationKey=012345678-abcd-ef01-2345-6789abcd connection string.
Note
We recommend that you use the Azure Az PowerShell module to interact with Azure. To get started, see Install Azure PowerShell. To learn how to migrate to the Az PowerShell module, see Migrate Azure PowerShell from AzureRM to Az.
Note
For Windows, set ApplicationInsightsAgent_EXTENSION_VERSION to ~2.
For Linux, set ApplicationInsightsAgent_EXTENSION_VERSION to ~3.
$app = Get-AzWebApp -ResourceGroupName "my-resource-group" -Name "my-monitored-web-app" -ErrorAction Stop
$newAppSettings = @{} # Case-insensitive hash map
$app.SiteConfig.AppSettings | %{$newAppSettings[$_.Name] = $_.Value} # Preserve non-Application-Insights application settings.
$newAppSettings["APPLICATIONINSIGHTS_CONNECTION_STRING"] = "InstrumentationKey=aaaa0a0a-bb1b-cc2c-dd3d-eeeeee4e4e4e"; # Set the Application Insights connection string
$newAppSettings["ApplicationInsightsAgent_EXTENSION_VERSION"] = "~3"; # Enable the ApplicationInsightsAgent.
$app = Set-AzWebApp -AppSettings $newAppSettings -ResourceGroupName $app.ResourceGroup -Name $app.Name -ErrorAction Stop
Troubleshooting
See the dedicated troubleshooting article.
Next steps
- Review frequently asked questions (FAQ): Monitoring in Azure App Service for .NET, Node.js, Python, and Java applications FAQ.
- Enable the .NET Profiler for Azure App Service apps on your live app.
- Enable Azure diagnostics to be sent to Application Insights.
- Monitor service health metrics to make sure your service is available and responsive.
- Receive alert notifications whenever operational events happen or metrics cross a threshold.
- Set up availability tests for your application.