Note
Access to this page requires authorization. You can try signing in or changing directories.
Access to this page requires authorization. You can try changing directories.
Note
The Java Profiler feature is in preview, starting from 3.4.0.
The Java Profiler provides a system for:
- Generating JDK Flight Recorder (JFR) profiles on demand from the Java Virtual Machine (JVM).
- Generating JFR profiles automatically when certain trigger conditions are met from JVM, such as CPU or memory breaching a configured threshold.
Overview
The Java Profiler uses the JFR profiler provided by the JVM to record profiling data, allowing users to download the JFR recordings at a later time and analyze them to identify the cause of performance issues.
This data is gathered on demand when trigger conditions are met. The available triggers are thresholds over CPU usage, Memory consumption, and Request (service-level agreement triggers). Request triggers monitor Spans generated by OpenTelemetry and allow the user to configure service-level agreement (SLA) requirements over the duration of those Spans.
When a threshold is reached, a profile of the configured type and duration is gathered and uploaded. This profile is then visible within the performance pane of the associated Application Insights Portal UI.
Warning
The JFR profiler by default executes the "profile-without-env-data" profile. A JFR file is a series of events emitted by the JVM. The "profile-without-env-data" configuration, is similar to the "profile" configuration that ships with the JVM, however has had some events disabled that have the potential to contain sensitive deployment information such as environment variables, arguments provided to the JVM and processes running on the system.
The flags that are no longer available are:
- jdk.JVMInformation
- jdk.InitialSystemProperty
- jdk.OSInformation
- jdk.InitialEnvironmentVariable
- jdk.SystemProcess
However, you should review all enabled flags to ensure that profiles don't contain sensitive data.
See Configuring Profile Contents on setting a custom profiler configuration.
Prerequisites
JVM with Java Flight Recorder (JFR) capability
- Java 8 update 262+
- Java 11+
Warning
OpenJ9 JVM is not supported
Usage
Triggers
For more detailed description of the various triggers available, see Profile production applications in Azure with Application Insights Profiler for .NET.
The ApplicationInsights Java Agent monitors CPU, memory, and request duration such as a business transaction. If it breaches a configured threshold, a profile is triggered.
Profile now
A Profile now button is located in the profiler user interface (see Configure Application Insights Profiler for .NET). Selecting this button immediately requests a profile in all agents that are attached to the Application Insights instance. The default profiling duration is two minutes. You can change it by overriding periodicRecordingDurationSeconds (see Configuration file).
Warning
Invoking Profile now will enable the profiler feature, and Application Insights will apply default CPU and memory SLA triggers. When your application breaches those SLAs, Application Insights will gather Java profiles. If you wish to disable profiling later on, you can do so within the trigger menu shown in Installation.
CPU
CPU threshold is a percentage of the usage of all available cores on the system.
As an example, if one core of an eight core machine were saturated the CPU percentage would be considered 12.5%.
Memory
Memory percentage is the current Tenured memory region (OldGen) occupancy against the maximum possible size of the region.
Occupancy is evaluated after a tenured collection is performed. The maximum size of the tenured region is the size it would be if the Java Virtual Machine (JVM) heap grew to its maximum size.
For instance, take the following scenario:
- The Java heap could grow to a maximum of 1,024 mb.
- The Tenured Generation could grow to 90% of the heap.
- The maximum possible size of tenured would be 922 mb.
- Your threshold was set via the user interface to 75%, therefore your threshold would be 75% of 922 mb, 691 mb.
In this scenario, a profile occurs in the following circumstances:
- Full garbage collection is executed
- The Tenured regions occupancy is above 691 mb after collection
Request
SLA triggers are based on OpenTelemetry, and they initiate a profile if certain criteria are fulfilled.
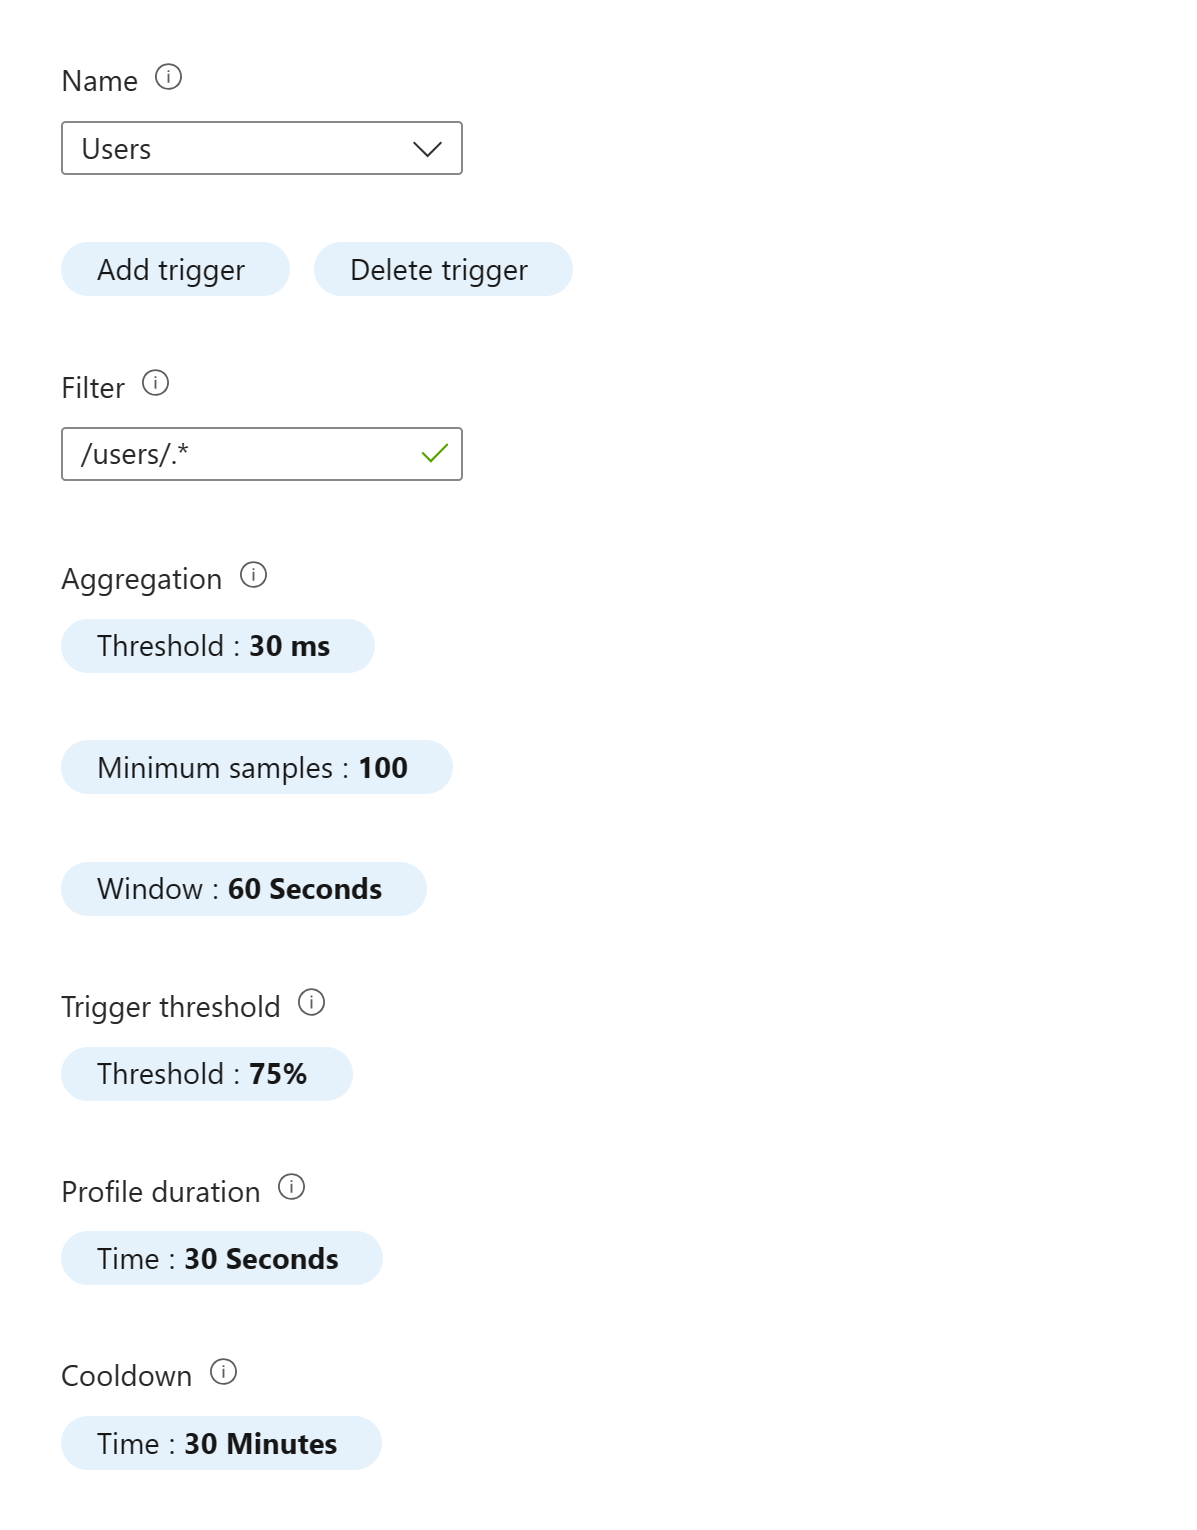
Each individual trigger configuration is formed as follows:
Name- A unique identifier for the trigger.Filter- Filters the requests of interest for the trigger.Aggregation- Calculates the ratio of requests that breached a given threshold.Threshold- A minimum value (in milliseconds) at which a request breach is determined to occur.Minimum samples- The minimum number of samples that must be collected for the aggregation to produce data, this setting is to prevent triggering off of small sample sizes.Window- Rolling time window (in milliseconds).
Threshold- The threshold value (percentage) applied to the aggregation output. If this value is exceeded, a profile is initiated.
For instance, the following scenario would trigger a profile if: more than 75% of requests to a specific endpoint (/users/.*) take longer than 30 ms within a 60-second window, when at least 100 samples were gathered.
Installation
The following steps guide you through enabling the profiling component on the agent and configuring resource limits that trigger a profile if breached.
Configure the resource thresholds that cause a profile to be collected:
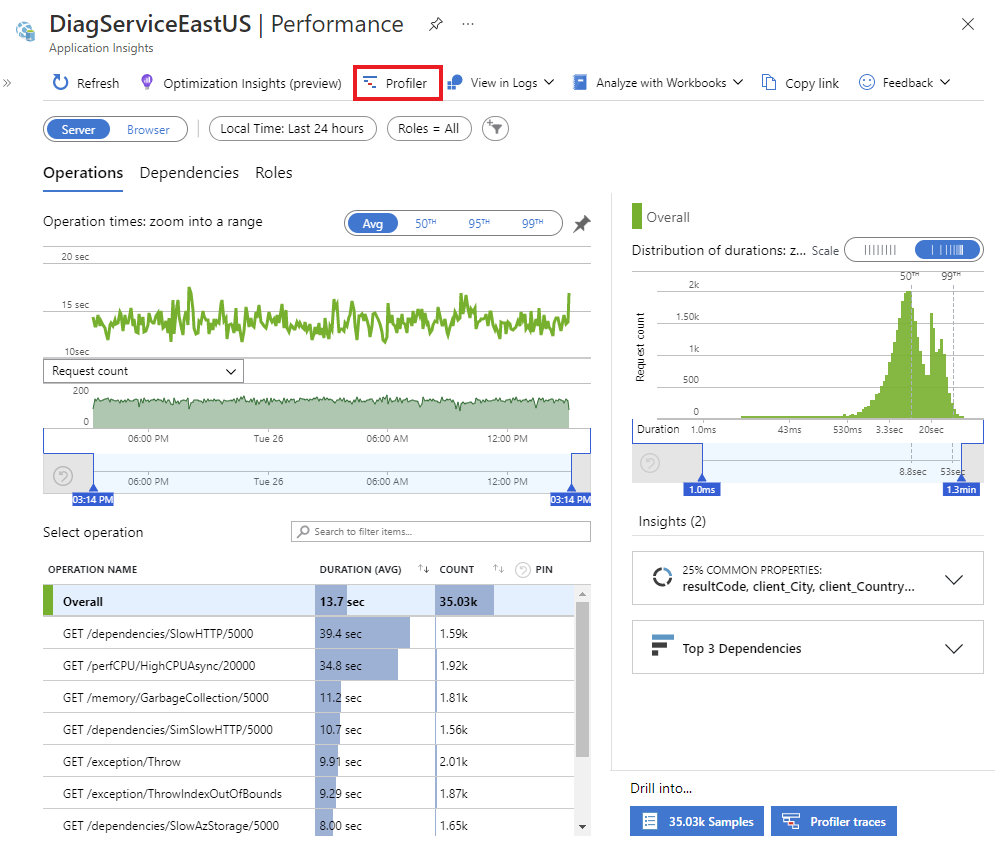
Browse to the Performance -> Profiler section of the Application Insights instance.

Warning
The Profiler traces button at bottom right is not supported for Java.
Select Triggers
Configure the required CPU, Memory, or Request triggers (if enabled) and select Apply.
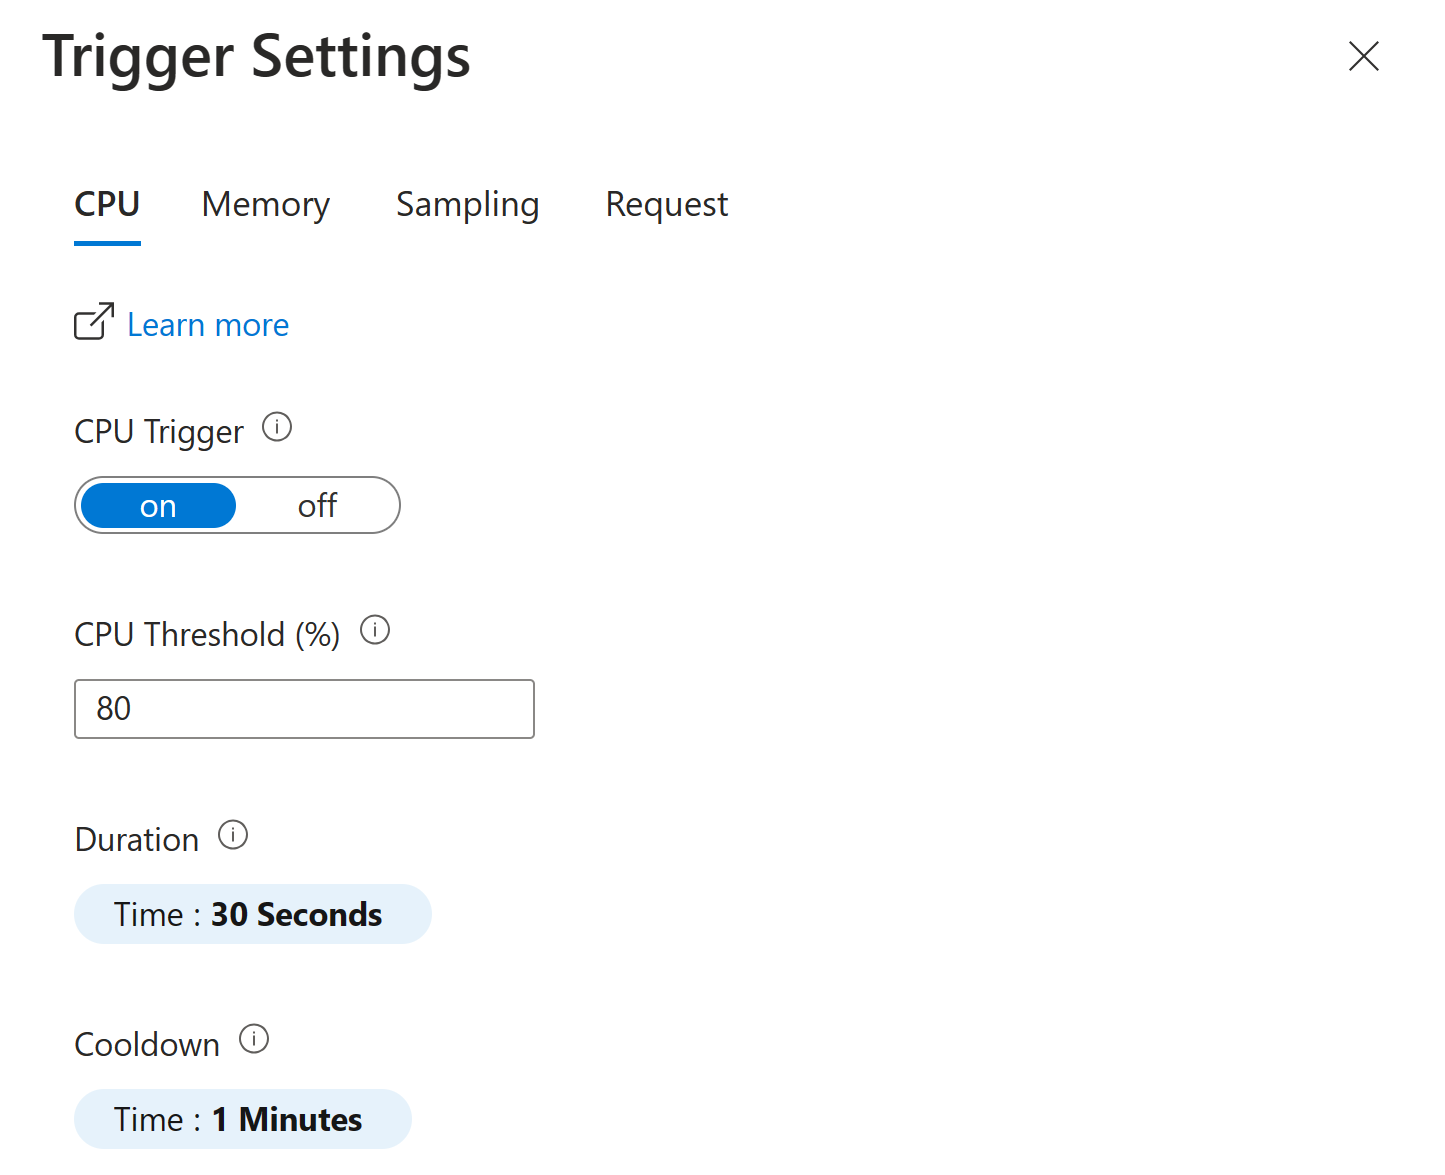
Warning
The Java Profiler does not support the "Sampling" trigger. Configuring this will have no effect.
After these steps are completed, the agent will monitor the resource usage of your process and trigger a profile when the threshold is exceeded. When a profile is triggered and completed, it's viewable from the Application Insights instance within the Performance -> Profiler section. From that screen the profile can be downloaded, once download the JFR recording file can be opened and analyzed within a tool of your choosing, for example Oracle JDK Mission Control (JMC).

Configuration
Configuration of the Java Profiler triggering settings, such as thresholds and profiling periods, are set in the Application Insights UI under Performance > Profiler > Triggers, as described in Installation.
Additionally, many parameters can be configured using environment variables and the applicationinsights.json configuration file.
Configuring Profile Contents
If you wish to provide a custom profile configuration, alter the memoryTriggeredSettings, and cpuTriggeredSettings to provide the path to a .jfc file with your required configuration.
Profiles can be generated/edited in the JDK Mission Control (JMC) user interface under the Window->Flight Recording Template Manager menu and control over individual flags is found inside Edit->Advanced of this user interface.
Environment variables
APPLICATIONINSIGHTS_PREVIEW_PROFILER_ENABLED: boolean (default:true)Enables/disables the profiling feature. By default the feature is enabled within the agent (since agent 3.4.9). However, even though this feature is enabled within the agent, profiles aren't gathered unless enabled within the Portal as described in Installation.
Configuration file
Example configuration:
{
  "preview": {
    "profiler": {
      "enabled": true,
      "cpuTriggeredSettings": "profile-without-env-data",
      "memoryTriggeredSettings": "profile-without-env-data",
      "manualTriggeredSettings": "profile-without-env-data",
      "enableRequestTriggering": true,
      "periodicRecordingDurationSeconds": 60
    }
  }
}
memoryTriggeredSettings This configuration is used if a memory profile is requested.
This value can be one of:
profile-without-env-data(default value). A profile with certain sensitive events disabled, see Warning section for details.profile. Uses theprofile.jfcconfiguration that ships with JFR.- A path to a custom jfc configuration file on the file system, for example,
/tmp/myconfig.jfc.
cpuTriggeredSettings This configuration is used if a cpu profile is requested.
This value can be one of:
profile-without-env-data(default value). A profile with certain sensitive events disabled, see Warning section for details.profile. Uses theprofile.jfcjfc configuration that ships with JFR.- A path to a custom jfc configuration file on the file system, for example,
/tmp/myconfig.jfc.
manualTriggeredSettings This configuration is used if a manual profile is requested.
This value can be one of:
profile-without-env-data(default value). A profile with certain sensitive events disabled, see Warning section for details.profile. Uses theprofile.jfcjfc configuration that ships with JFR.- A path to a custom jfc configuration file on the file system, for example,
/tmp/myconfig.jfc.
enableRequestTriggering Whether JFR profiling should be triggered based on request configuration.
This value can be one of:
trueProfiling is triggered if a request trigger threshold is breached.false(default value). Request configuration doesn't trigger profiling.
periodicRecordingDurationSeconds Profiling recording duration in seconds when a profiling session is started by using the Profile now button. The default value is 120.
Next steps
- To review frequently asked questions (FAQ), see Java Profiler FAQ