Note
Access to this page requires authorization. You can try signing in or changing directories.
Access to this page requires authorization. You can try changing directories.
The Microsoft Azure Monitor Application Insights JavaScript SDK collects usage data, which allows you to monitor and analyze the performance of JavaScript web applications. This is commonly referred to as Real User Monitoring or RUM.
The Application Insights JavaScript SDK has a base SDK and several plugins for more capabilities.

We collect page views by default. But if you want to also collect clicks by default, consider adding the Click Analytics Auto-Collection plug-in:
- If you're adding a framework extension, which you can add after you follow the steps to get started, you can optionally add Click Analytics when you add the framework extension.
- If you're not adding a framework extension, add the Click Analytics plug-in after you follow the steps to get started.
We provide the Debug plugin and Performance plugin for debugging/testing. In rare cases, it's possible to build your own extension by adding a custom plugin.
Prerequisites
- Azure subscription: Create an Azure subscription for free
- Application Insights resource: Create an Application Insights resource
- An application that uses JavaScript
Get started
Follow the steps in this section to instrument your application with the Application Insights JavaScript SDK.
Tip
Good news! We're making it even easier to enable JavaScript with JavaScript (Web) SDK Loader Script injection by configuration.
Add the JavaScript code
Two methods are available to add the code to enable Application Insights via the Application Insights JavaScript SDK:
| Method | When would I use this method? |
|---|---|
| JavaScript (Web) SDK Loader Script | For most customers, we recommend the JavaScript (Web) SDK Loader Script because you never have to update the SDK and you get the latest updates automatically. Also, you have control over which pages you add the Application Insights JavaScript SDK to. |
| npm package | You want to bring the SDK into your code and enable IntelliSense. This option is only needed for developers who require more custom events and configuration. This method is required if you plan to use the React, React Native, or Angular Framework Extension. |
Paste the JavaScript (Web) SDK Loader Script at the top of each page for which you want to enable Application Insights.
Preferably, you should add it as the first script in your
<head>section so that it can monitor any potential issues with all of your dependencies.If Internet Explorer 8 is detected, JavaScript SDK v2.x is automatically loaded.
<script type="text/javascript">
!(function (cfg){function e(){cfg.onInit&&cfg.onInit(n)}var x,w,D,t,E,n,C=window,O=document,b=C.location,q="script",I="ingestionendpoint",L="disableExceptionTracking",j="ai.device.";"instrumentationKey"[x="toLowerCase"](),w="crossOrigin",D="POST",t="appInsightsSDK",E=cfg.name||"appInsights",(cfg.name||C[t])&&(C[t]=E),n=C[E]||function(g){var f=!1,m=!1,h={initialize:!0,queue:[],sv:"8",version:2,config:g};function v(e,t){var n={},i="Browser";function a(e){e=""+e;return 1===e.length?"0"+e:e}return n[j+"id"]=i[x](),n[j+"type"]=i,n["ai.operation.name"]=b&&b.pathname||"_unknown_",n["ai.internal.sdkVersion"]="javascript:snippet_"+(h.sv||h.version),{time:(i=new Date).getUTCFullYear()+"-"+a(1+i.getUTCMonth())+"-"+a(i.getUTCDate())+"T"+a(i.getUTCHours())+":"+a(i.getUTCMinutes())+":"+a(i.getUTCSeconds())+"."+(i.getUTCMilliseconds()/1e3).toFixed(3).slice(2,5)+"Z",iKey:e,name:"Microsoft.ApplicationInsights."+e.replace(/-/g,"")+"."+t,sampleRate:100,tags:n,data:{baseData:{ver:2}},ver:undefined,seq:"1",aiDataContract:undefined}}var n,i,t,a,y=-1,T=0,S=["js.monitor.azure.com","js.cdn.applicationinsights.io","js.cdn.monitor.azure.com","js0.cdn.applicationinsights.io","js0.cdn.monitor.azure.com","js2.cdn.applicationinsights.io","js2.cdn.monitor.azure.com","az416426.vo.msecnd.net"],o=g.url||cfg.src,r=function(){return s(o,null)};function s(d,t){if((n=navigator)&&(~(n=(n.userAgent||"").toLowerCase()).indexOf("msie")||~n.indexOf("trident/"))&&~d.indexOf("ai.3")&&(d=d.replace(/(\/)(ai\.3\.)([^\d]*)$/,function(e,t,n){return t+"ai.2"+n})),!1!==cfg.cr)for(var e=0;e<S.length;e++)if(0<d.indexOf(S[e])){y=e;break}var n,i=function(e){var a,t,n,i,o,r,s,c,u,l;h.queue=[],m||(0<=y&&T+1<S.length?(a=(y+T+1)%S.length,p(d.replace(/^(.*\/\/)([\w\.]*)(\/.*)$/,function(e,t,n,i){return t+S[a]+i})),T+=1):(f=m=!0,s=d,!0!==cfg.dle&&(c=(t=function(){var e,t={},n=g.connectionString;if(n)for(var i=n.split(";"),a=0;a<i.length;a++){var o=i[a].split("=");2===o.length&&(t[o[0][x]()]=o[1])}return t[I]||(e=(n=t.endpointsuffix)?t.location:null,t[I]="https://"+(e?e+".":"")+"dc."+(n||"services.visualstudio.com")),t}()).instrumentationkey||g.instrumentationKey||"",t=(t=(t=t[I])&&"/"===t.slice(-1)?t.slice(0,-1):t)?t+"/v2/track":g.endpointUrl,t=g.userOverrideEndpointUrl||t,(n=[]).push((i="SDK LOAD Failure: Failed to load Application Insights SDK script (See stack for details)",o=s,u=t,(l=(r=v(c,"Exception")).data).baseType="ExceptionData",l.baseData.exceptions=[{typeName:"SDKLoadFailed",message:i.replace(/\./g,"-"),hasFullStack:!1,stack:i+"\nSnippet failed to load ["+o+"] -- Telemetry is disabled\nHelp Link: https://go.microsoft.com/fwlink/?linkid=2128109\nHost: "+(b&&b.pathname||"_unknown_")+"\nEndpoint: "+u,parsedStack:[]}],r)),n.push((l=s,i=t,(u=(o=v(c,"Message")).data).baseType="MessageData",(r=u.baseData).message='AI (Internal): 99 message:"'+("SDK LOAD Failure: Failed to load Application Insights SDK script (See stack for details) ("+l+")").replace(/\"/g,"")+'"',r.properties={endpoint:i},o)),s=n,c=t,JSON&&((u=C.fetch)&&!cfg.useXhr?u(c,{method:D,body:JSON.stringify(s),mode:"cors"}):XMLHttpRequest&&((l=new XMLHttpRequest).open(D,c),l.setRequestHeader("Content-type","application/json"),l.send(JSON.stringify(s)))))))},a=function(e,t){m||setTimeout(function(){!t&&h.core||i()},500),f=!1},p=function(e){var n=O.createElement(q),e=(n.src=e,t&&(n.integrity=t),n.setAttribute("data-ai-name",E),cfg[w]);return!e&&""!==e||"undefined"==n[w]||(n[w]=e),n.onload=a,n.onerror=i,n.onreadystatechange=function(e,t){"loaded"!==n.readyState&&"complete"!==n.readyState||a(0,t)},cfg.ld&&cfg.ld<0?O.getElementsByTagName("head")[0].appendChild(n):setTimeout(function(){O.getElementsByTagName(q)[0].parentNode.appendChild(n)},cfg.ld||0),n};p(d)}cfg.sri&&(n=o.match(/^((http[s]?:\/\/.*\/)\w+(\.\d+){1,5})\.(([\w]+\.){0,2}js)$/))&&6===n.length?(d="".concat(n[1],".integrity.json"),i="@".concat(n[4]),l=window.fetch,t=function(e){if(!e.ext||!e.ext[i]||!e.ext[i].file)throw Error("Error Loading JSON response");var t=e.ext[i].integrity||null;s(o=n[2]+e.ext[i].file,t)},l&&!cfg.useXhr?l(d,{method:"GET",mode:"cors"}).then(function(e){return e.json()["catch"](function(){return{}})}).then(t)["catch"](r):XMLHttpRequest&&((a=new XMLHttpRequest).open("GET",d),a.onreadystatechange=function(){if(a.readyState===XMLHttpRequest.DONE)if(200===a.status)try{t(JSON.parse(a.responseText))}catch(e){r()}else r()},a.send())):o&&r();try{h.cookie=O.cookie}catch(k){}function e(e){for(;e.length;)!function(t){h[t]=function(){var e=arguments;f||h.queue.push(function(){h[t].apply(h,e)})}}(e.pop())}var c,u,l="track",d="TrackPage",p="TrackEvent",l=(e([l+"Event",l+"PageView",l+"Exception",l+"Trace",l+"DependencyData",l+"Metric",l+"PageViewPerformance","start"+d,"stop"+d,"start"+p,"stop"+p,"addTelemetryInitializer","setAuthenticatedUserContext","clearAuthenticatedUserContext","flush"]),h.SeverityLevel={Verbose:0,Information:1,Warning:2,Error:3,Critical:4},(g.extensionConfig||{}).ApplicationInsightsAnalytics||{});return!0!==g[L]&&!0!==l[L]&&(e(["_"+(c="onerror")]),u=C[c],C[c]=function(e,t,n,i,a){var o=u&&u(e,t,n,i,a);return!0!==o&&h["_"+c]({message:e,url:t,lineNumber:n,columnNumber:i,error:a,evt:C.event}),o},g.autoExceptionInstrumented=!0),h}(cfg.cfg),(C[E]=n).queue&&0===n.queue.length?(n.queue.push(e),n.trackPageView({})):e();})({
  src: "https://js.monitor.azure.com/scripts/b/ai.3.gbl.min.js",
  // name: "appInsights", // Global SDK Instance name defaults to "appInsights" when not supplied
  // ld: 0, // Defines the load delay (in ms) before attempting to load the sdk. -1 = block page load and add to head. (default) = 0ms load after timeout,
  // useXhr: 1, // Use XHR instead of fetch to report failures (if available),
  // dle: true, // Prevent the SDK from reporting load failure log
  crossOrigin: "anonymous", // When supplied this will add the provided value as the cross origin attribute on the script tag
  // onInit: null, // Once the application insights instance has loaded and initialized this callback function will be called with 1 argument -- the sdk instance (DON'T ADD anything to the sdk.queue -- As they won't get called)
  // sri: false, // Custom optional value to specify whether fetching the snippet from integrity file and do integrity check
  cfg: { // Application Insights Configuration
    connectionString: "YOUR_CONNECTION_STRING"
}});
</script>
(Optional) Add or update optional JavaScript (Web) SDK Loader Script configuration, if you need to optimize the loading of your web page or resolve loading errors.

JavaScript (Web) SDK Loader Script configuration
| Name | Type | Required? | Description |
|---|---|---|---|
| src | string | Required | The full URL for where to load the SDK from. This value is used for the "src" attribute of a dynamically added <script /> tag. You can use the public CDN location or your own privately hosted one. |
| name | string | Optional | The global name for the initialized SDK. Use this setting if you need to initialize two different SDKs at the same time. The default value is appInsights, so window.appInsights is a reference to the initialized instance.Note: If you assign a name value or if a previous instance is assigned to the global name appInsightsSDK, the SDK initialization code requires it to be in the global namespace as window.appInsightsSDK=<name value> to ensure the correct JavaScript (Web) SDK Loader Script skeleton, and proxy methods are initialized and updated. |
| ld | number in ms | Optional | Defines the load delay to wait before attempting to load the SDK. Use this setting when the HTML page is failing to load because the JavaScript (Web) SDK Loader Script is loading at the wrong time. The default value is 0ms after timeout. If you use a negative value, the script tag is immediately added to the <head> region of the page and blocks the page load event until the script is loaded or fails. |
| useXhr | boolean | Optional | This setting is used only for reporting SDK load failures. For example, this setting is useful when the JavaScript (Web) SDK Loader Script is preventing the HTML page from loading, causing fetch() to be unavailable. Reporting first attempts to use fetch() if available and then fallback to XHR. Set this setting to true to bypass the fetch check. This setting is necessary only in environments where fetch can't transmit failure events, for example, when the JavaScript (Web) SDK Loader Script fails to load successfully. |
| crossOrigin | string | Optional | By including this setting, the script tag added to download the SDK includes the crossOrigin attribute with this string value. Use this setting when you need to provide support for CORS. When not defined (the default), no crossOrigin attribute is added. Recommended values aren't defined (the default), "", or "anonymous". For all valid values, see the cross origin HTML attribute documentation. |
| onInit | function(aiSdk) { ... } | Optional | This callback function is called after the main SDK script is successfully loaded and initialized from the CDN (based on the src value). This callback function is useful when you need to insert a telemetry initializer. It's passed one argument, which is a reference to the SDK instance that's being called for and is also called before the first initial page view. If the SDK is already loaded and initialized, this callback is still called. NOTE: During the processing of the sdk.queue array, this callback is called. You can't add any more items to the queue because they're ignored and dropped. (Added as part of JavaScript (Web) SDK Loader Script version 5--the sv:"5" value within the script). |
| cr | boolean | Optional | If the SDK fails to load and the endpoint value defined for src is the public CDN location, this configuration option attempts to immediately load the SDK from one of the following backup CDN endpoints:
If the SDK successfully loads from a backup CDN endpoint, it loads from the first available one, which is determined when the server performs a successful load check. If the SDK fails to load from any of the backup CDN endpoints, the SDK Failure error message appears. When not defined, the default value is true. If you don't want to load the SDK from the backup CDN endpoints, set this configuration option to false.If you're loading the SDK from your own privately hosted CDN endpoint, this configuration option isn't applicable. |
Paste the connection string in your environment
To paste the connection string in your environment, follow these steps:
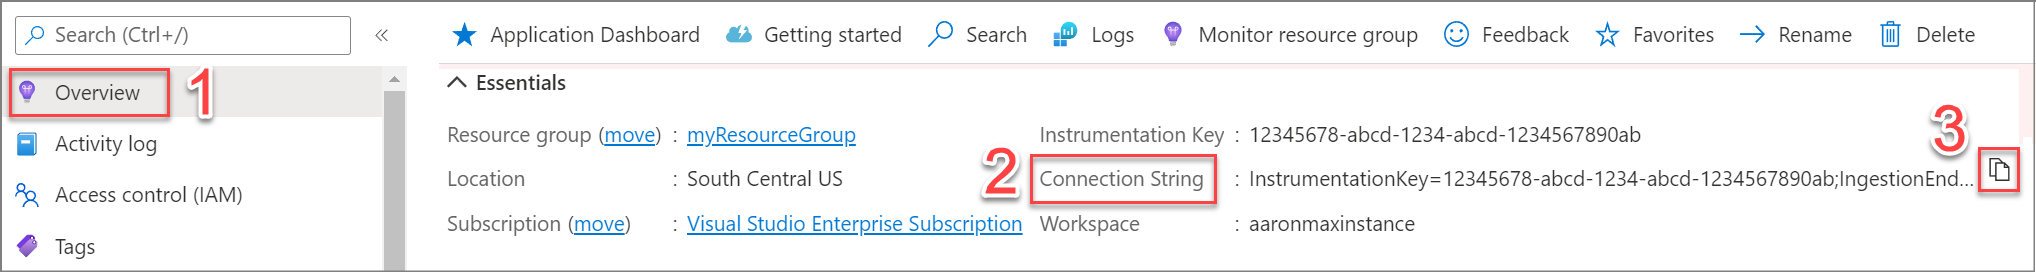
Navigate to the Overview pane of your Application Insights resource.
Locate the Connection String.
Select the Copy to clipboard icon to copy the connection string to the clipboard.
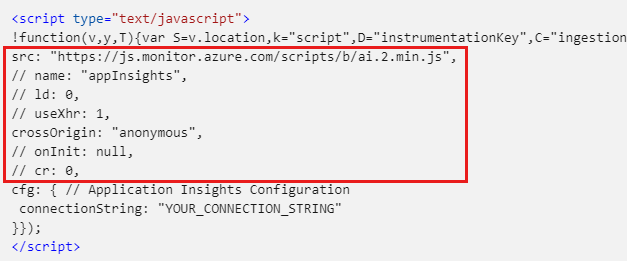
Replace the placeholder
"YOUR_CONNECTION_STRING"in the JavaScript code with your connection string copied to the clipboard.The
connectionStringformat must follow "InstrumentationKey=xxxx;....". If the string provided doesn't meet this format, the SDK load process fails.The connection string isn't considered a security token or key. For more information, see Do new Azure regions require the use of connection strings?.
Note
The Application Insights JavaScript SDK requires the connection string to be provided during initialization and configuration. This connection string is visible in plain text in client browsers, and there is no straightforward way to use Microsoft Entra ID-based authentication for browser telemetry. We recommend that you consider creating a separate Application Insights resource with local authentication enabled for JavaScript browser-based telemetry if you need to secure the service telemetry separately using Microsoft Entra ID-based authentication.

(Optional) Add SDK configuration
The optional SDK configuration is passed to the Application Insights JavaScript SDK during initialization.
To add SDK configuration, add each configuration option directly under connectionString. For example:

(Optional) Add advanced SDK configuration
If you want to use the extra features provided by plugins for specific frameworks and optionally enable the Click Analytics plug-in, see:
Confirm data is flowing
Go to your Application Insights resource that you enabled the SDK for.
In the Application Insights resource menu on the left, under Investigate, select the Transaction search pane.
Open the Event types dropdown menu and select Select all to clear the checkboxes in the menu.
From the Event types dropdown menu, select:
- Page View for Azure Monitor Application Insights Real User Monitoring
- Custom Event for the Click Analytics Auto-Collection plug-in.
It might take a few minutes for data to show up in the portal. If the only data you see showing up is a load failure exception, see Troubleshoot SDK load failure for JavaScript web apps.
In some cases, if multiple instances of different versions of Application Insights are running on the same page, errors can occur during initialization. For these cases and the error message that appears, see Running multiple versions of the Application Insights JavaScript SDK in one session. If you encounter one of these errors, try changing the namespace by using the
namesetting. For more information, see JavaScript (Web) SDK Loader Script configuration.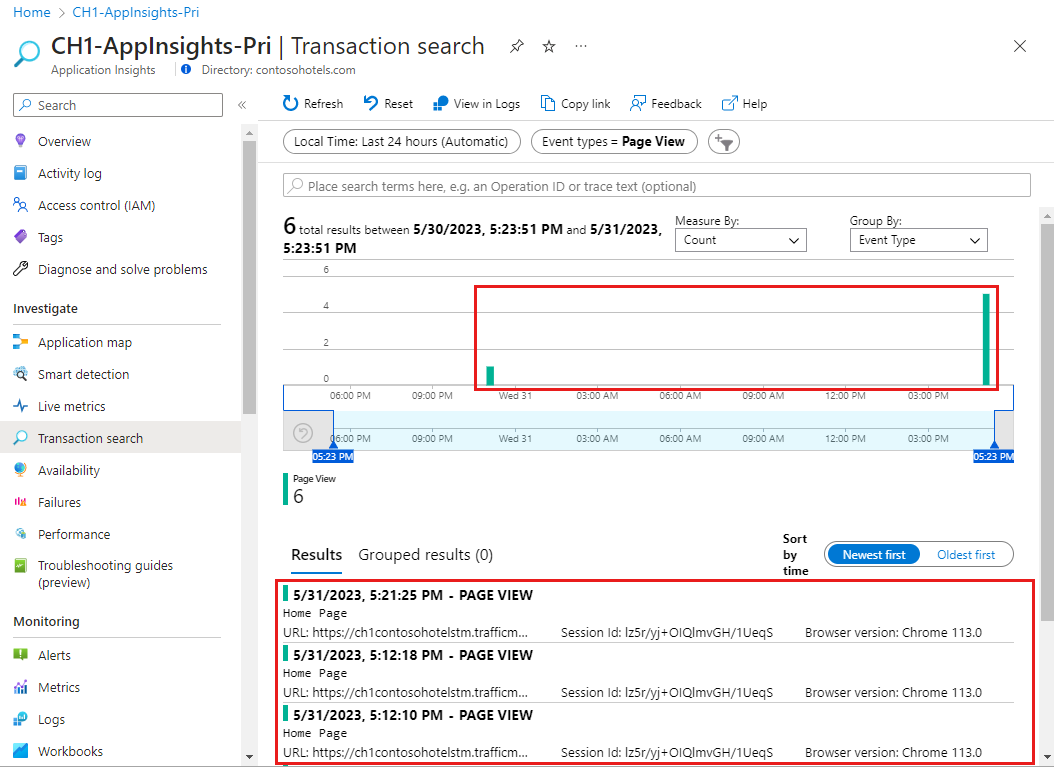
If you want to query data to confirm data is flowing:
Select Logs in the left pane.
When you select Logs, the Queries dialog opens, which contains sample queries relevant to your data.
Select Run for the sample query you want to run.
If needed, you can update the sample query or write a new query by using Kusto Query Language (KQL).
For essential KQL operators, see Learn common KQL operators.

Support
- If you can't run the application or you aren't getting data as expected, see the dedicated troubleshooting article.
- For common question about the JavaScript SDK, see the FAQ.
- For Azure support issues, open an Azure support ticket.
- For a list of open issues related to the Application Insights JavaScript SDK, see the GitHub Issues Page.
- Use the Telemetry Viewer extension to list out the individual events in the network payload and monitor the internal calls within Application Insights.
Next steps
- To review frequently asked questions (FAQ), see JavaScript SDK FAQ
- Explore Application Insights usage experiences
- Track page views
- Track custom events and metrics
- Insert a JavaScript telemetry initializer
- Add JavaScript SDK configuration
- See the detailed release notes on GitHub for updates and bug fixes
- Query data in Log Analytics