Analyze product usage with HEART
This article describes how to enable and use the Heart Workbook on Azure Monitor. The HEART workbook is based on the HEART measurement framework, which was originally introduced by Google. Several Microsoft internal teams use HEART to deliver better software.
Overview
HEART is an acronym that stands for happiness, engagement, adoption, retention, and task success. It helps product teams deliver better software by focusing on five dimensions of customer experience:
- Happiness: Measure of user attitude
- Engagement: Level of active user involvement
- Adoption: Target audience penetration
- Retention: Rate at which users return
- Task success: Productivity empowerment
These dimensions are measured independently, but they interact with each other.
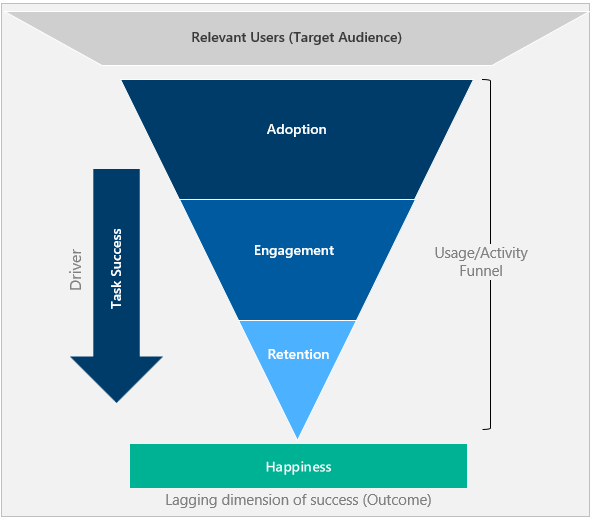
- Adoption, engagement, and retention form a user activity funnel. Only a portion of users who adopt the tool come back to use it.
- Task success is the driver that progresses users down the funnel and moves them from adoption to retention.
- Happiness is an outcome of the other dimensions and not a stand-alone measurement. Users who have progressed down the funnel and are showing a higher level of activity are ideally happier.
Get started
Prerequisites
- Azure subscription: Create an Azure subscription for free
- Application Insights resource: Create an Application Insights resource
- Click Analytics: Set up the Click Analytics Autocollection plug-in.
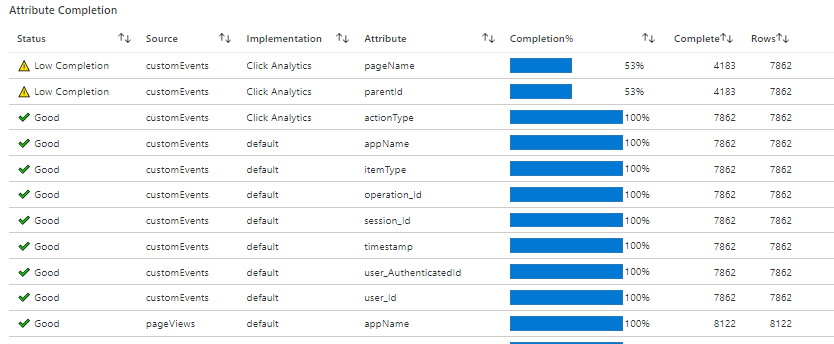
- Specific attributes: Instrument the following attributes to calculate HEART metrics.
| Source | Attribute | Description |
|---|---|---|
| customEvents | session_Id | Unique session identifier |
| customEvents | appName | Unique Application Insights app identifier |
| customEvents | itemType | Category of customEvents record |
| customEvents | timestamp | Datetime of event |
| customEvents | operation_Id | Correlate telemetry events |
| customEvents | user_Id | Unique user identifier |
| customEvents ¹ | parentId | Name of feature |
| customEvents ¹ | pageName | Name of page |
| customEvents ¹ | actionType | Category of Click Analytics record |
| pageViews | user_AuthenticatedId | Unique authenticated user identifier |
| pageViews | session_Id | Unique session identifier |
| pageViews | appName | Unique Application Insights app identifier |
| pageViews | timestamp | Datetime of event |
| pageViews | operation_Id | Correlate telemetry events |
| pageViews | user_Id | Unique user identifier |
- If you're setting up the authenticated user context, instrument the below attributes:
| Source | Attribute | Description |
|---|---|---|
| customEvents | user_AuthenticatedId | Unique authenticated user identifier |
Footnotes
¹: To emit these attributes, use the Click Analytics Autocollection plug-in via npm.
Tip
To understand how to effectively use the Click Analytics plug-in, see Feature extensions for the Application Insights JavaScript SDK (Click Analytics).
Open the workbook
You can find the workbook in the gallery under Public Templates. The workbook appears in the section Product Analytics using the Click Analytics Plugin.
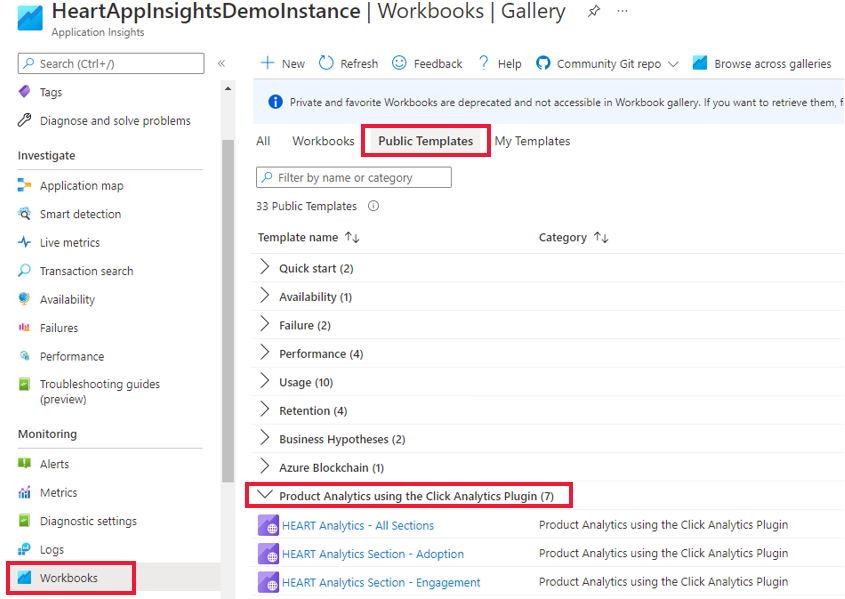
There are seven workbooks.
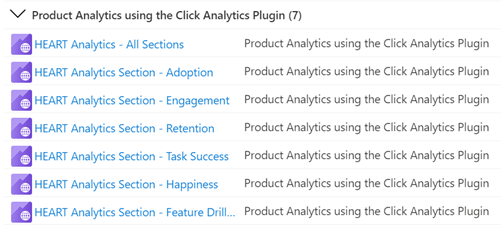
You only have to interact with the main workbook, HEART Analytics - All Sections. This workbook contains the other six workbooks as tabs. You can also access the individual workbooks related to each tab through the gallery.
Confirm that data is flowing
To validate that data is flowing as expected to light up the metrics accurately, select the Development Requirements tab.
Important
Unless you set the authenticated user context, you must select Anonymous Users from the ConversionScope dropdown to see telemetry data.
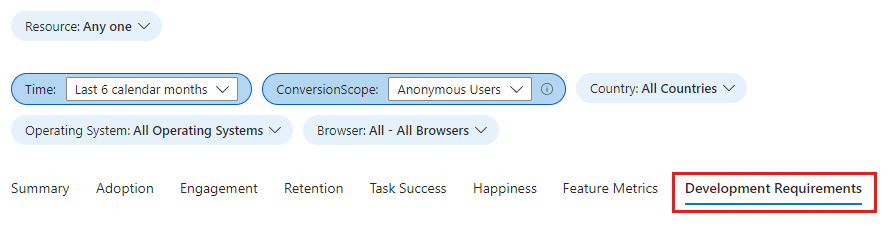
If data isn't flowing as expected, this tab shows the specific attributes with issues.
Workbook structure
The workbook shows metric trends for the HEART dimensions split over seven tabs. Each tab contains descriptions of the dimensions, the metrics contained within each dimension, and how to use them.
The tabs are:
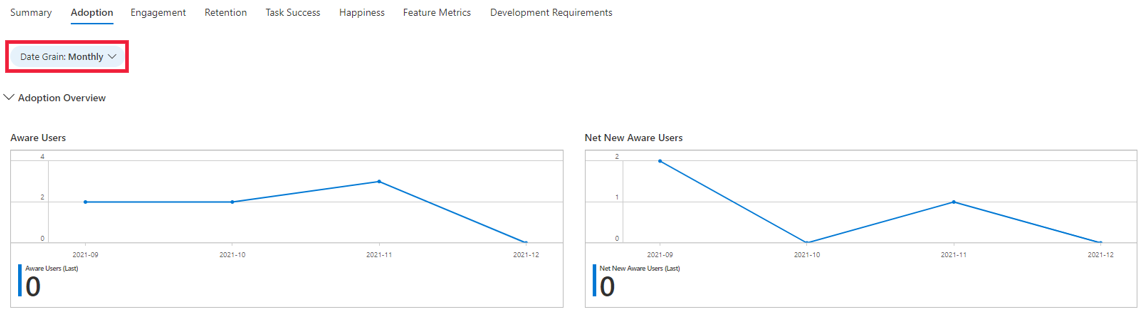
- Summary: Summarizes usage funnel metrics for a high-level view of visits, interactions, and repeat usage.
- Adoption: Helps you understand the penetration among the target audience, acquisition velocity, and total user base.
- Engagement: Shows frequency, depth, and breadth of usage.
- Retention: Shows repeat usage.
- Task success: Enables understanding of user flows and their time distributions.
- Happiness: We recommend using a survey tool to measure customer satisfaction score (CSAT) over a five-point scale. On this tab, we've provided the likelihood of happiness via usage and performance metrics.
- Feature metrics: Enables understanding of HEART metrics at feature granularity.
Warning
The HEART workbook is currently built on logs and effectively are log-based metrics. The accuracy of these metrics are negatively affected by sampling and filtering.
How HEART dimensions are defined and measured
Happiness
Happiness is a user-reported dimension that measures how users feel about the product offered to them.
A common approach to measure happiness is to ask users a CSAT question like How satisfied are you with this product? Users' responses on a three- or a five-point scale (for example, no, maybe, and yes) are aggregated to create a product-level score that ranges from 1 to 5. Because user-initiated feedback tends to be negatively biased, HEART tracks happiness from surveys displayed to users at predefined intervals.
Common happiness metrics include values such as Average Star Rating and Customer Satisfaction Score. Send these values to Azure Monitor by using one of the custom ingestion methods described in Custom sources.
Engagement
Engagement is a measure of user activity. Specifically, user actions are intentional, such as clicks. Active usage can be broken down into three subdimensions:
- Activity frequency: Measures how often a user interacts with the product. For example, users typically interact daily, weekly, or monthly.
- Activity breadth: Measures the number of features users interact with over a specific time period. For example, users interacted with a total of five features in June 2021.
- Activity depth: Measures the number of features users interact with each time they launch the product. For example, users interacted with two features on every launch.
Measuring engagement can vary based on the type of product being used. For example, a product like Microsoft Teams is expected to have a high daily usage, which makes it an important metric to track. But for a product like a paycheck portal, measurement might make more sense at a monthly or weekly level.
Important
A user who performs an intentional action, such as clicking a button or typing an input, is counted as an active user. For this reason, engagement metrics require the Click Analytics plug-in for Application Insights to be implemented in the application.
Adoption
Adoption enables understanding of penetration among the relevant users, who you're gaining as your user base, and how you're gaining them. Adoption metrics are useful for measuring:
- Newly released products.
- Newly updated products.
- Marketing campaigns.
Retention
A retained user is a user who was active in a specified reporting period and its previous reporting period. Retention is typically measured with the following metrics.
| Metric | Definition | Question answered |
|---|---|---|
| Retained users | Count of active users who were also active the previous period | How many users are staying engaged with the product? |
| Retention | Proportion of active users from the previous period who are also active this period | What percent of users are staying engaged with the product? |
Important
Because active users must have at least one telemetry event with an action type, retention metrics require the Click Analytics plug-in for Application Insights to be implemented in the application.
Task success
Task success tracks whether users can do a task efficiently and effectively by using the product's features. Many products include structures that are designed to funnel users through completing a task. Some examples include:
- Adding items to a cart and then completing a purchase.
- Searching a keyword and then selecting a result.
- Starting a new account and then completing account registration.
A successful task meets three requirements:
- Expected task flow: The intended task flow of the feature was completed by the user and aligns with the expected task flow.
- High performance: The intended functionality of the feature was accomplished in a reasonable amount of time.
- High reliability: The intended functionality of the feature was accomplished without failure.
A task is considered unsuccessful if any of the preceding requirements isn't met.
Important
Task success metrics require the Click Analytics plug-in for Application Insights to be implemented in the application.
Set up a custom task by using the following parameters.
| Parameter | Description |
|---|---|
| First step | The feature that starts the task. In the cart/purchase example, Adding items to a cart is the first step. |
| Expected task duration | The time window to consider a completed task a success. Any tasks completed outside of this constraint are considered a failure. Not all tasks necessarily have a time constraint. For such tasks, select No Time Expectation. |
| Last step | The feature that completes the task. In the cart/purchase example, Purchasing items from the cart is the last step. |
Frequently asked questions
How do I view the data at different grains (daily, monthly, or weekly)?
You can select the Date Grain filter to change the grain. The filter is available across all the dimension tabs.
How do I access insights from my application that aren't available on the HEART workbooks?
You can dig into the data that feeds the HEART workbook if the visuals don't answer all your questions. To do this task, under the Monitoring section, select Logs and query the customEvents table. Some of the Click Analytics attributes are contained within the customDimensions field. A sample query is shown here.
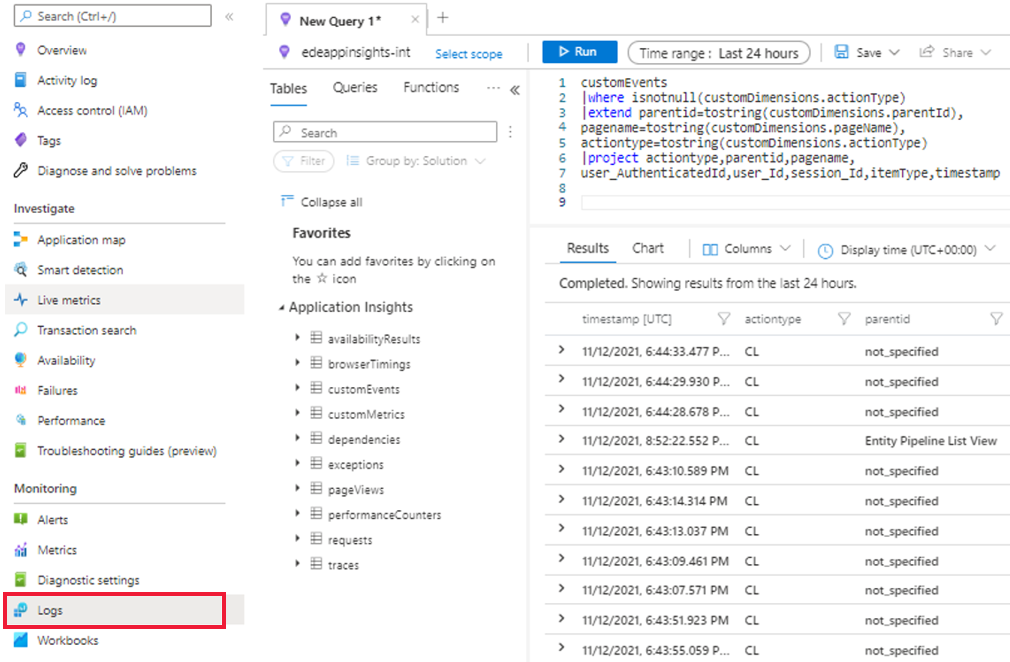
To learn more about Logs in Azure Monitor, see Azure Monitor Logs overview.
Can I edit visuals in the workbook?
Yes. When you select the public template of the workbook:
Select Edit and make your changes.
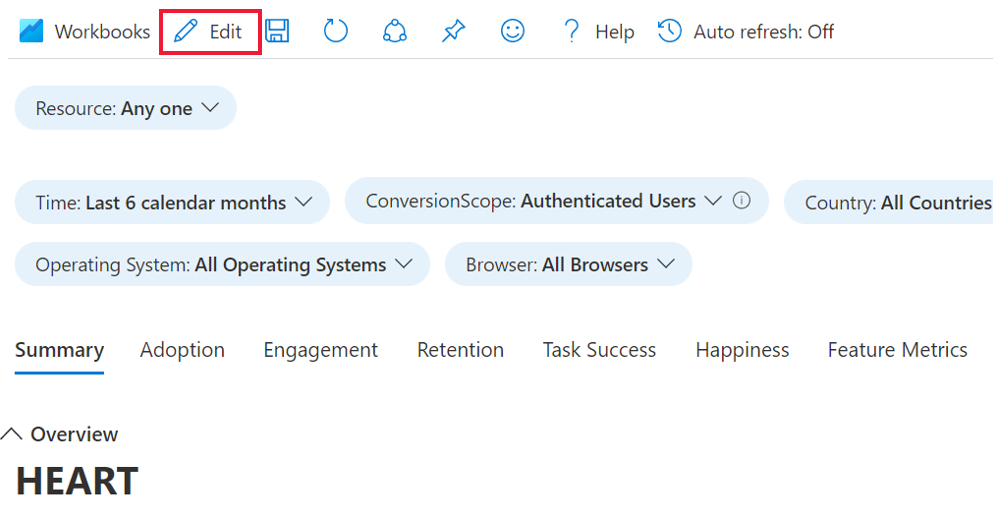
After you make your changes, select Done Editing, and then select the Save icon.
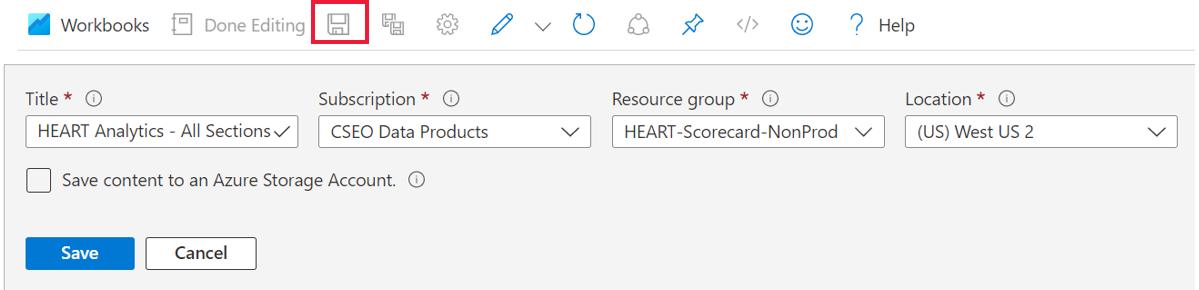
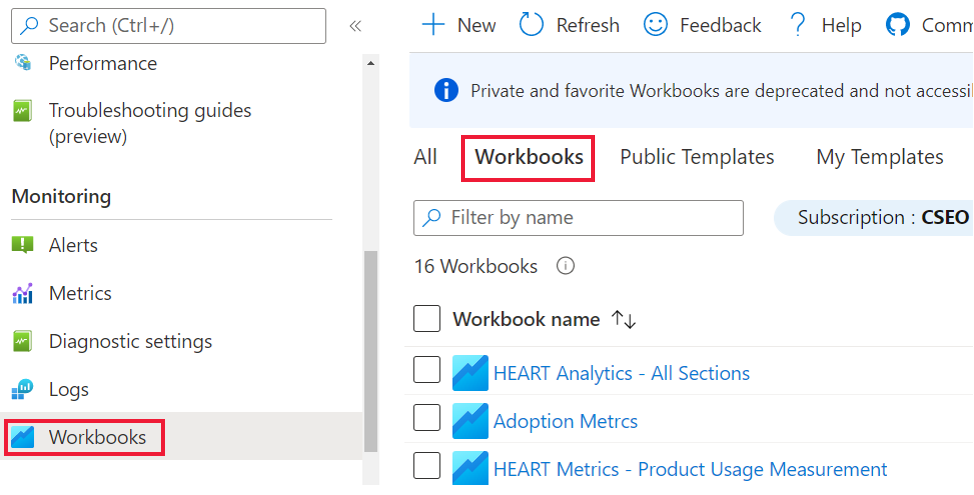
To view your saved workbook, under Monitoring, go to the Workbooks section and then select the Workbooks tab.
A copy of your customized workbook appears there. You can make any further changes you want in this copy.
For more on editing workbook templates, see Azure Workbooks templates.
Next steps
- Check out the GitHub repository and npm Package for the Click Analytics Autocollection plug-in.
- Use Events Analysis in the Usage experience to analyze top clicks and slice by available dimensions.
- Find click data under the content field within the
customDimensionsattribute in theCustomEventstable in Log Analytics. See sample app for more guidance. - Learn more about the Google HEART framework.
Feedback
Coming soon: Throughout 2024 we will be phasing out GitHub Issues as the feedback mechanism for content and replacing it with a new feedback system. For more information see: https://aka.ms/ContentUserFeedback.
Submit and view feedback for