Note
Access to this page requires authorization. You can try signing in or changing directories.
Access to this page requires authorization. You can try changing directories.
The Live Data feature in Container insights gives you direct access to your Azure Kubernetes Service (AKS) container logs (stdout/stderror), events, and pod metrics. It exposes direct access to kubectl logs -c, kubectl get events, and kubectl top pods. A console pane shows the logs, events, and metrics generated by the container engine to help with troubleshooting issues in real time.
Note
AKS uses Kubernetes cluster-level logging architectures. The container logs are located inside /var/log/containers on the node. To access a node, see Connect to Azure Kubernetes Service (AKS) cluster nodes.
This article provides an overview of this feature and helps you understand how to use it.
For help with setting up or troubleshooting the Live Data feature, see the Setup guide. This feature directly accesses the Kubernetes API. For more information about the authentication model, see The Kubernetes API.
View AKS resource live logs
Note
You must be on a machine on the same private network to access live logs from a private cluster.
To view the live logs for pods, deployments, replica sets, stateful sets, daemon sets, jobs, or cron jobs with or without Container insights from the AKS resource view:
- In the Azure portal, navigate to your AKS cluster resource.
- From the service menu, under Kubernetes resources, select Workloads.
- Select a pod, deployment, replica set, stateful set, daemon set, or job from the respective tab.
- From the overview pane, select Live Logs, and then select a pod to start collecting the live data.
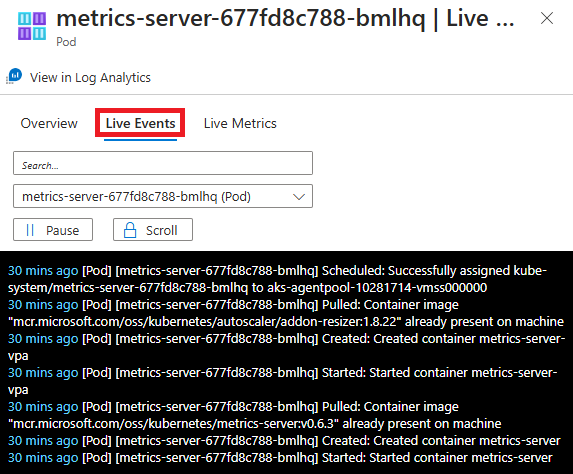
View events
You can view real-time event data as it's generated by the container engine when you select a container, pod, node, replica set, stateful set, daemon set, job, cron job, or deployment. To view events:
In the Azure portal, navigate to your AKS cluster resource.
From the service menu, under Monitoring, select Insights.
Select an object from the performance grid from the respective tab.
From the overview pane, select Live Events. If the AKS cluster is configured with single sign-on by using Microsoft Entra ID, you're prompted to authenticate on first use during that browser session. Select your account and finish authentication with Azure.

Note
To view the data from your Log Analytics workspace, select View in Log Analytics. The log search results potentially show Nodes, Daemon Sets, Replica Sets, Stateful Sets, Jobs, Cron Jobs, Pods, and Containers. These logs might no longer exist. The log search results for Stateful Sets shows the data for the pods in a stateful set. Attempting to search logs for a container that isn't available in kubectl will also fail here. To learn more about viewing historical logs, events, and metrics, see How to query logs from Container insights.
Filter events
While you view events, you can also limit the results using the pill below the search bar. Depending on the resource you select, the pill lists a node, pod, namespace, or cluster to choose from.
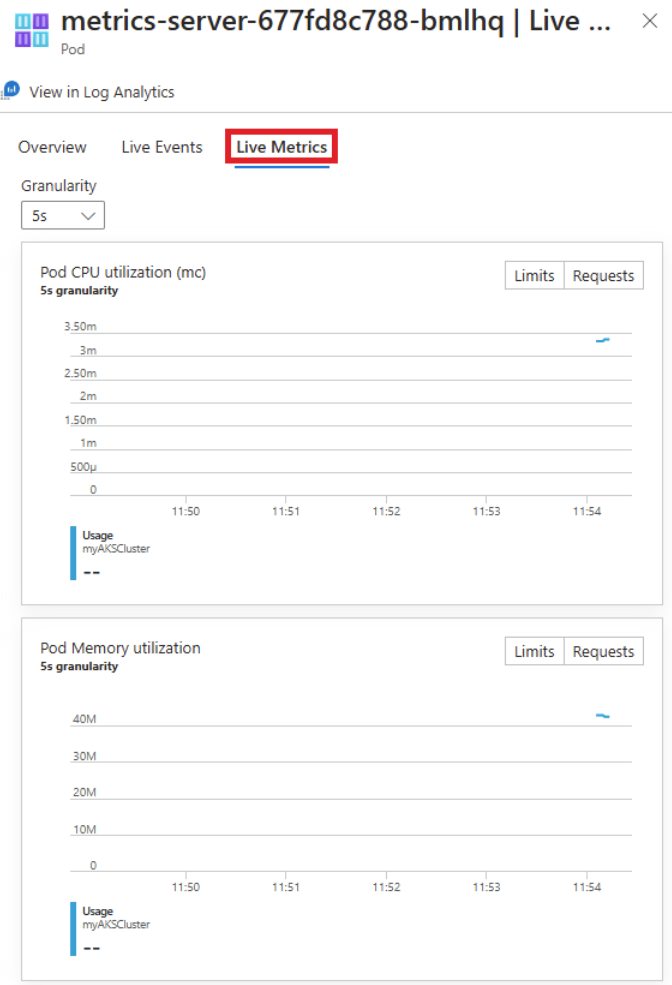
View metrics
You can view real-time metric data as it's generated by the container engine from the Nodes or Controllers view only when a Pod is selected. To view metrics:
In the Azure portal, navigate to your AKS cluster resource.
From the service menu, under Monitoring, select Insights.
Select a pod from the performance grid from the Nodes or Controllers tab.
From the overview pane, select Live Metrics. If the AKS cluster is configured with single sign-on by using Microsoft Entra ID, you're prompted to authenticate on first use during that browser session. Select your account and finish authentication with Azure.

Note
To view the data from your Log Analytics workspace, select View in Log Analytics. The log search results potentially show Nodes, Daemon Sets, Replica Sets, Stateful Sets, Jobs, Cron Jobs, Pods, and Containers. These logs might no longer exist. The log search results for Stateful Sets shows the data for the pods in a stateful set. Attempting to search logs for a container that isn't available in kubectl will also fail here. To learn more about viewing historical logs, events, and metrics, see How to query logs from Container insights.
Use live data views
The following sections describe functionality that you can use in the different live data views.
Search
The Live Data feature includes search functionality. In the Search box, you can filter results by entering a keyword or term. Any matching results are highlighted to allow quick review. While you view the events, you can also limit the results using the Filter feature below the search bar. Depending on what resource you've selected, you can choose from a node, pod, namespace, or cluster.
Scroll, lock, and pause
To suspend autoscroll and control the behavior of the tab so that you can manually scroll through the new data read, select the Scroll option. To reenable autoscroll, select Scroll again. You can also pause retrieval of log or event data by selecting the Pause option. When you're ready to resume, select Play.
Suspend or pause autoscroll for only a short period of time while you're troubleshooting an issue. These requests might affect the availability and throttling of the Kubernetes API on your cluster.
Important
No data is stored permanently during the operation of this feature. All information captured during the session is deleted when you close your browser or navigate away from it. Data only remains present for visualization inside the five-minute window of the metrics feature. Any metrics older than five minutes are also deleted. The Live Data buffer queries within reasonable memory usage limits.
Frequently asked questions
This section provides answers to common questions.
What does "Other processes" represent under the Node view?
Other processes are intended to help you clearly understand the root cause of the high resource usage on your node. This information helps you to distinguish usage between containerized processes versus noncontainerized processes.
What are these other processes?
They're noncontainerized processes that run on your node.
How do we calculate this?
Other processes = Total usage from CAdvisor - Usage from containerized process
The other processes include:
- Self-managed or managed Kubernetes noncontainerized processes.
- Container run-time processes.
- Kubelet.
- System processes running on your node.
- Other non-Kubernetes workloads running on node hardware or a VM.
Next steps
- To continue learning how to use Azure Monitor and monitor other aspects of your AKS cluster, see View Azure Kubernetes Service health.
- To see predefined queries and examples to create alerts and visualizations or perform further analysis of your clusters, see How to query logs from Container insights.