Reports in Container insights
Reports in Container insights are recommended out-of-the-box for Azure workbooks. This article describes the different workbooks that are available and how to access them.
View workbooks
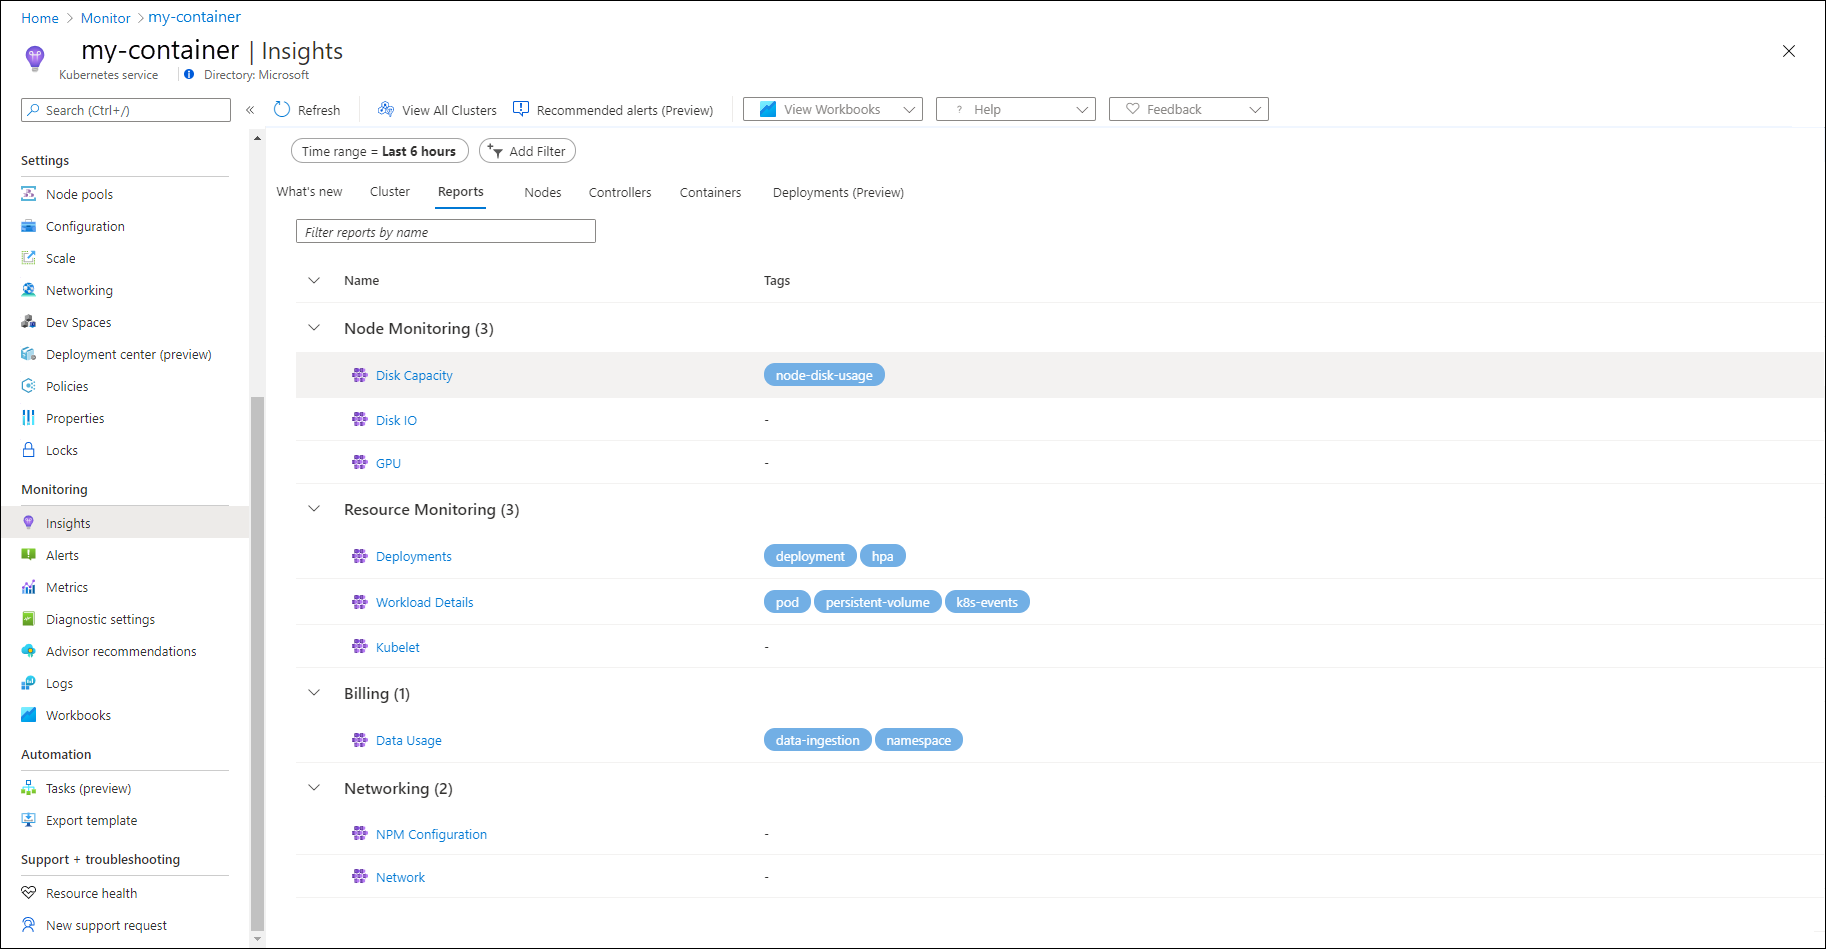
On the Azure Monitor menu in the Azure portal, select Containers. In the Monitoring section, select Insights, choose a particular cluster, and then select the Reports tab. You can also view them from the workbook gallery in Azure Monitor.
Cluster Optimization Workbook
The Cluster Optimization Workbook provides multiple analyzers that give you a quick view of the health and performance of your Kubernetes cluster. It has multiple analyzers that each provide different information related to your cluster. The workbook requires no configuration once Container insights has been enabled on the cluster.
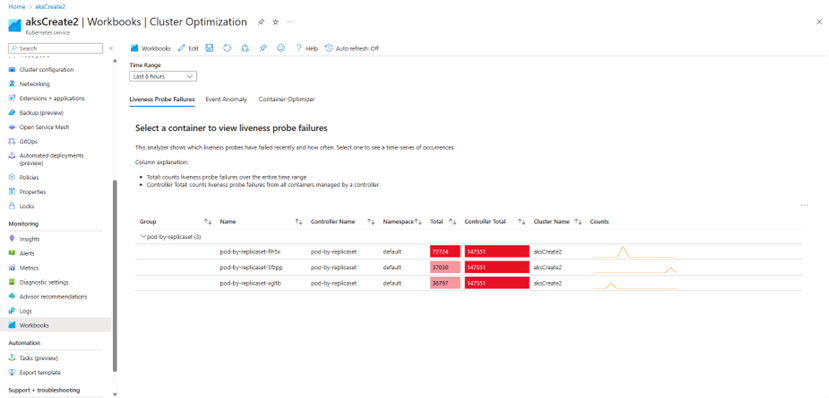
Liveness Probe Failures
The liveness probe failures analyzer shows which liveness probes have failed recently and how often. Select one to see a time-series of occurrences. This analyzer has the following columns:
- Total: counts liveness probe failures over the entire time range
- Controller Total: counts liveness probe failures from all containers managed by a controller
Event Anomaly
The event anomaly analyzer groups similar events together for easier analysis. It also shows which event groups have recently increased in volume. Events in the list are grouped based on common phrases. For example, two events with messages "pod-abc-123 failed, can not pull image" and "pod-def-456 failed, can not pull image" would be grouped together. The Spikiness column rates which events have occurred more recently. For example, if Events A and B occurred on average 10 times a day in the last month, but event A occurred 1,000 times yesterday while event B occurred 2 times yesterday, then event A would have a much higher spikiness rating than B.
Container optimizer
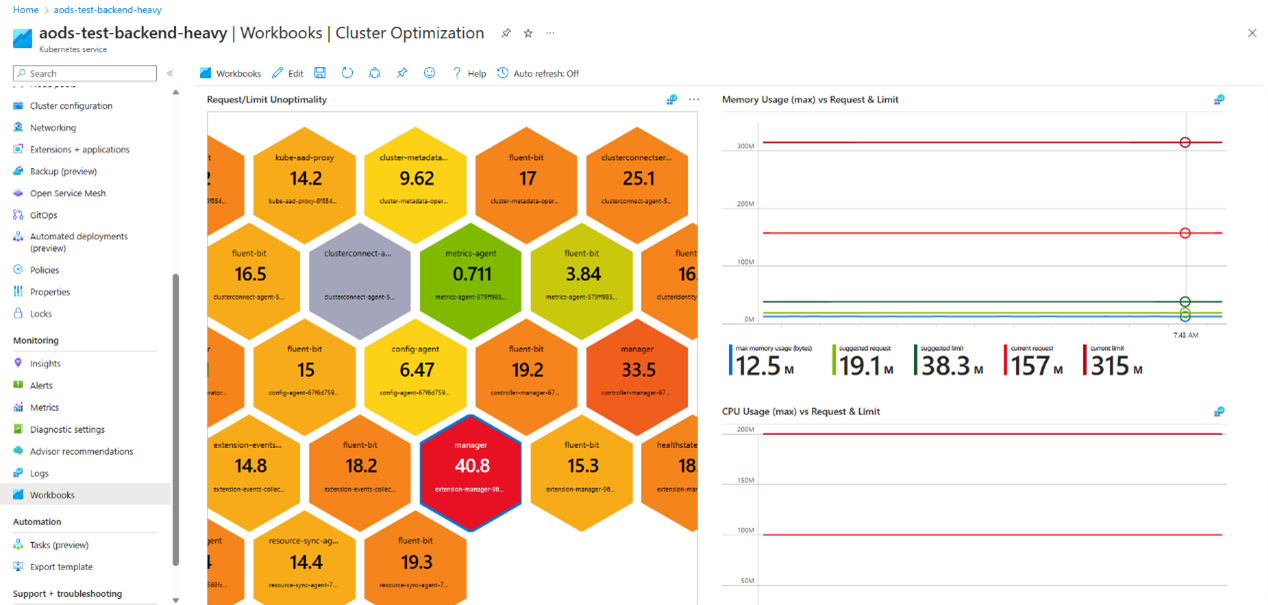
The container optimizer analyzer shows containers with excessive cpu and memory limits and requests. Each tile can represent multiple containers with the same spec. For example, if a deployment creates 100 identical pods each with a container C1 and C2, then there will be a single tile for all C1 containers and a single tile for all C2 containers. Containers with set limits and requests are color-coded in a gradient from green to red.
Important
This view doesn't include containers in the kube-system namespace and doesn't support Windows Server nodes.
The number on each tile represents how far the container limits/requests are from the optimal/suggested value. The closer the number is to 0 the better it is. Each tile has a color to indicate the following:
- green: well set limits and requests
- red: excessive limits or requests
- gray: unset limits or requests
Node Monitoring workbooks
Disk Capacity: Interactive disk usage charts for each disk presented to the node within a container by the following perspectives:
- Disk percent usage for all disks.
- Free disk space for all disks.
- A grid that shows each node's disk, its percentage of used space, trend of percentage of used space, free disk space (GiB), and trend of free disk space (GiB). When a row is selected in the table, the percentage of used space and free disk space (GiB) is shown underneath the row.
Disk IO: Interactive disk utilization charts for each disk presented to the node within a container by the following perspectives:
- Disk I/O is summarized across all disks by read bytes/sec, writes bytes/sec, and read and write bytes/sec trends.
- Eight performance charts show key performance indicators to help measure and identify disk I/O bottlenecks.
GPU: Interactive GPU usage charts for each GPU-aware Kubernetes cluster node.
Note
In accordance with the Kubernetes upstream announcement, GPU metrics collection will be disabled out of the box. For instructions on how to continue collecting your GPU metrics, see Configure GPU monitoring with Container insights.
Subnet IP Usage: Interactive IP usage charts for each node within a cluster by the following perspectives:
- IPs allocated from subnet.
- IPs assigned to a pod.
Note
By default 16 IP's are allocated from subnet to each node. This cannot be modified to be less than 16. For instructions on how to enable subnet IP usage metrics, see Monitor IP Subnet Usage.
Resource Monitoring workbooks
Deployments: Status of your deployments and horizontal pod autoscaler (HPA) including custom HPAs.
Workload Details: Interactive charts that show performance statistics of workloads for a namespace. Includes the following multiple tabs:
- Overview of CPU and memory usage by pod.
- POD/Container Status showing pod restart trend, container restart trend, and container status for pods.
- Kubernetes Events showing a summary of events for the controller.
Kubelet: Includes two grids that show key node operating statistics:
- Overview by node grid summarizes total operation, total errors, and successful operations by percent and trend for each node.
- Overview by operation type summarizes for each operation the total operation, total errors, and successful operations by percent and trend.
Billing workbook
Data Usage: Helps you to visualize the source of your data without having to build your own library of queries from what we share in our documentation. In this workbook, you can view charts that present billable data such as:
- Total billable data ingested in GB by solution.
- Billable data ingested by Container logs (application logs).
- Billable container logs data ingested per by Kubernetes namespace.
- Billable container logs data ingested segregated by Cluster name.
- Billable container log data ingested by log source entry.
- Billable diagnostic data ingested by diagnostic main node logs.
Networking workbooks
NPM Configuration: Monitoring of your network configurations, which are configured through the network policy manager (npm) for the:
- Summary information about overall configuration complexity.
- Policy, rule, and set counts over time, allowing insight into the relationship between the three and adding a dimension of time to debugging a configuration.
- Number of entries in all IPSets and each IPSet.
- Worst and average case performance per node for adding components to your Network Configuration.
Network: Interactive network utilization charts for each node's network adapter. A grid presents the key performance indicators to help measure the performance of your network adapters.
Create a custom workbook
To create a custom workbook based on any of these workbooks, select the View Workbooks dropdown list and then select Go to AKS Gallery at the bottom of the list. For more information about workbooks and using workbook templates, see Azure Monitor workbooks.
Next steps
For more information about workbooks in Azure Monitor, see Azure Monitor workbooks.
Feedback
Coming soon: Throughout 2024 we will be phasing out GitHub Issues as the feedback mechanism for content and replacing it with a new feedback system. For more information see: https://aka.ms/ContentUserFeedback.
Submit and view feedback for


