Note
Access to this page requires authorization. You can try signing in or changing directories.
Access to this page requires authorization. You can try changing directories.
Important
This article describes how to set up remote write in Azure Monitor managed service for Prometheus using managed identity authentication and a side car container provided by Azure Monitor. You can use remote write with managed identity without using a sidecar using the guidance at Connect self-managed Prometheus to Azure Monitor managed service for Prometheus.
This article describes how to set up remote write to send data from a self-managed Prometheus server running in your Azure Kubernetes Service (AKS) cluster or Azure Arc-enabled Kubernetes cluster by using managed identity authentication and a side car container provided by Azure Monitor. You can either use an existing identity that's created by AKS or create your own. Both options are described here.
Note
If you are using the user-assigned managed identity, we recommend that you directly configure Prometheus running on your Kubernetes cluster to remote-write into Azure Monitor Workspace. See Send Prometheus data to Azure Monitor using user-assigned managed identity to learn more. The steps below use the Azure Monitor side car container.
Cluster configurations
This article applies to the following cluster configurations:
- Azure Kubernetes Service cluster
- Azure Arc-enabled Kubernetes cluster
Prerequisites
Supported versions
Prometheus versions greater than v2.45 are required for managed identity authentication.
- Prometheus versions greater than v2.45 are required for user-assigned managed identity authentication.
- Prometheus versions greater than v2.48 are required for Microsoft Entra ID application authentication.
- Prometheus versions v3.50 or greater are required for system-assigned managed identity authentication.
Azure Monitor workspace
This article covers sending Prometheus metrics to an Azure Monitor workspace. To create an Azure monitor workspace, see Manage an Azure Monitor workspace.
Permissions
Administrator permissions for the cluster or resource are required to complete the steps in this article.
Set up an application for managed identity
The process to set up Prometheus remote write for an application by using managed identity authentication involves completing the following tasks:
- Get the name of the cluster's node resource group.
- Get the client ID of the user-assigned managed identity.
- Assign the Monitoring Metrics Publisher role on the workspace data collection rule to the managed identity.
- Give the cluster access to the managed identity.
- Deploy a sidecar container to set up remote write.
The tasks are described in the following sections.
Get the name of the cluster's node resource group
The node resource group of the cluster contains resources that you use in other steps in this process. This resource group has the name MC_<RESOURCE-GROUP>_<CLUSTER-NAME>_<REGION>. You can find the resource group name by using the Resource groups menu in the Azure portal.

Get the client ID of the user-assigned managed identity
You must get the client ID of the identity that you're going to use. Copy the client ID to use later in the process.
Instead of creating your own client ID, you can use one of the identities that are created by AKS. To learn more about the identities, see Use a managed identity in Azure Kubernetes Service.
This article uses the kubelet identity. The name of this identity is <CLUSTER-NAME>-agentpool, and it's in the node resource group of the cluster.

Select the <CLUSTER-NAME>-agentpool managed identity. On the Overview page, copy the value for Client ID. For more information, see Manage user-assigned managed identities.

Assign the Monitoring Metrics Publisher role on the workspace data collection rule to the managed identity
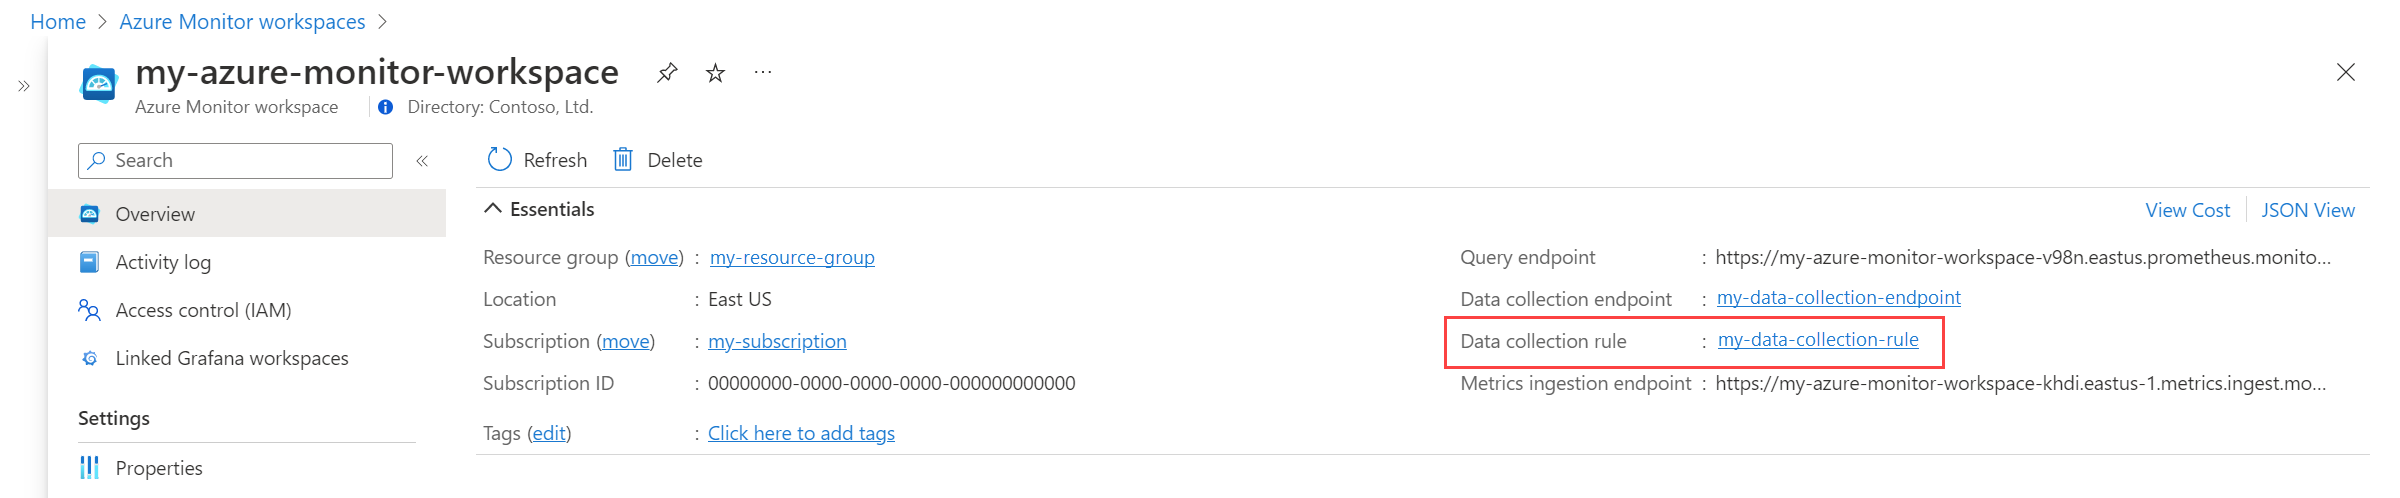
The managed identity must be assigned the Monitoring Metrics Publisher role on the data collection rule that is associated with your Azure Monitor workspace.
On the resource menu for your Azure Monitor workspace, select Overview. For Data collection rule, select the link.
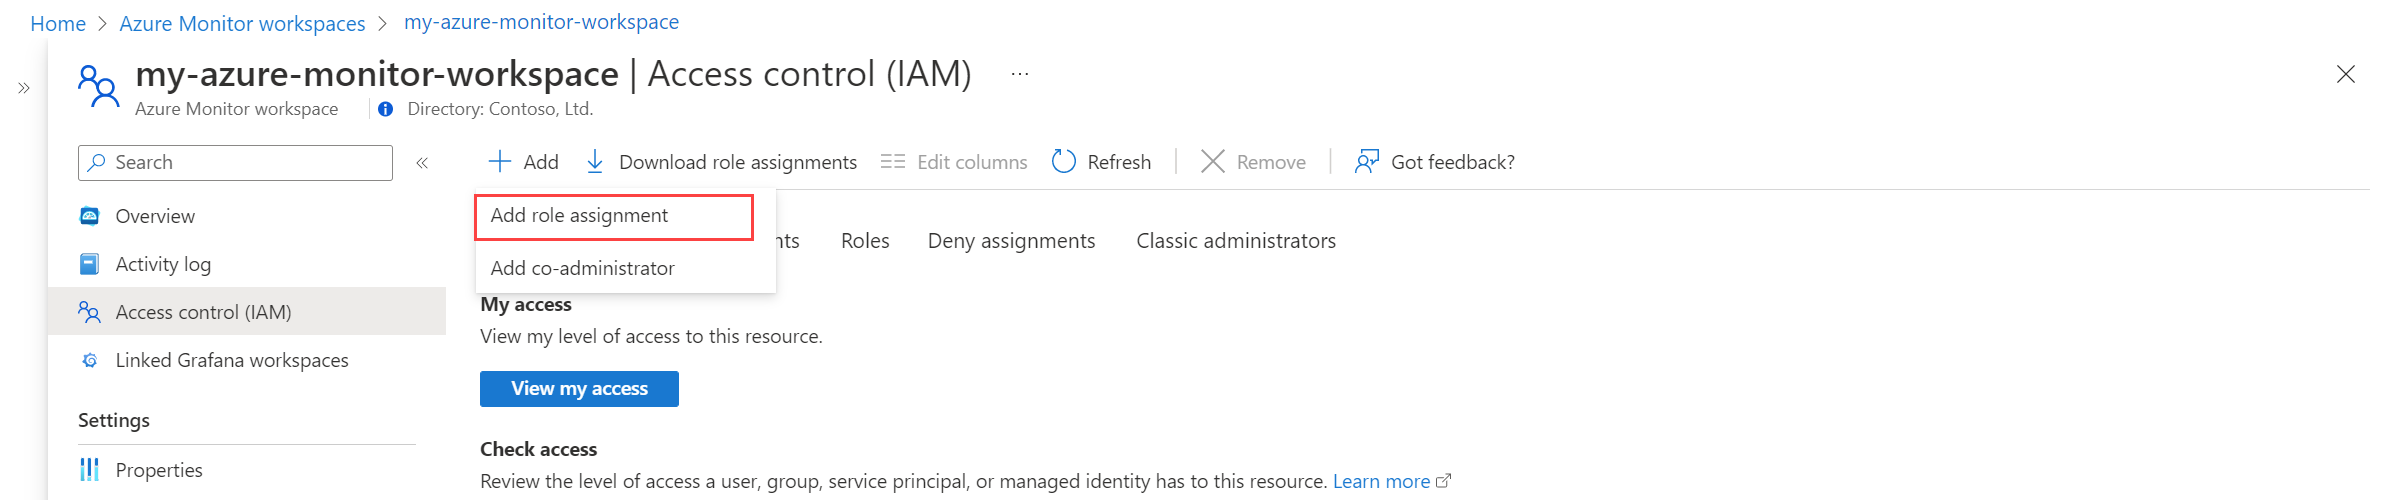
On the resource menu for the data collection rule, select Access control (IAM).
Select Add, and then select Add role assignment.
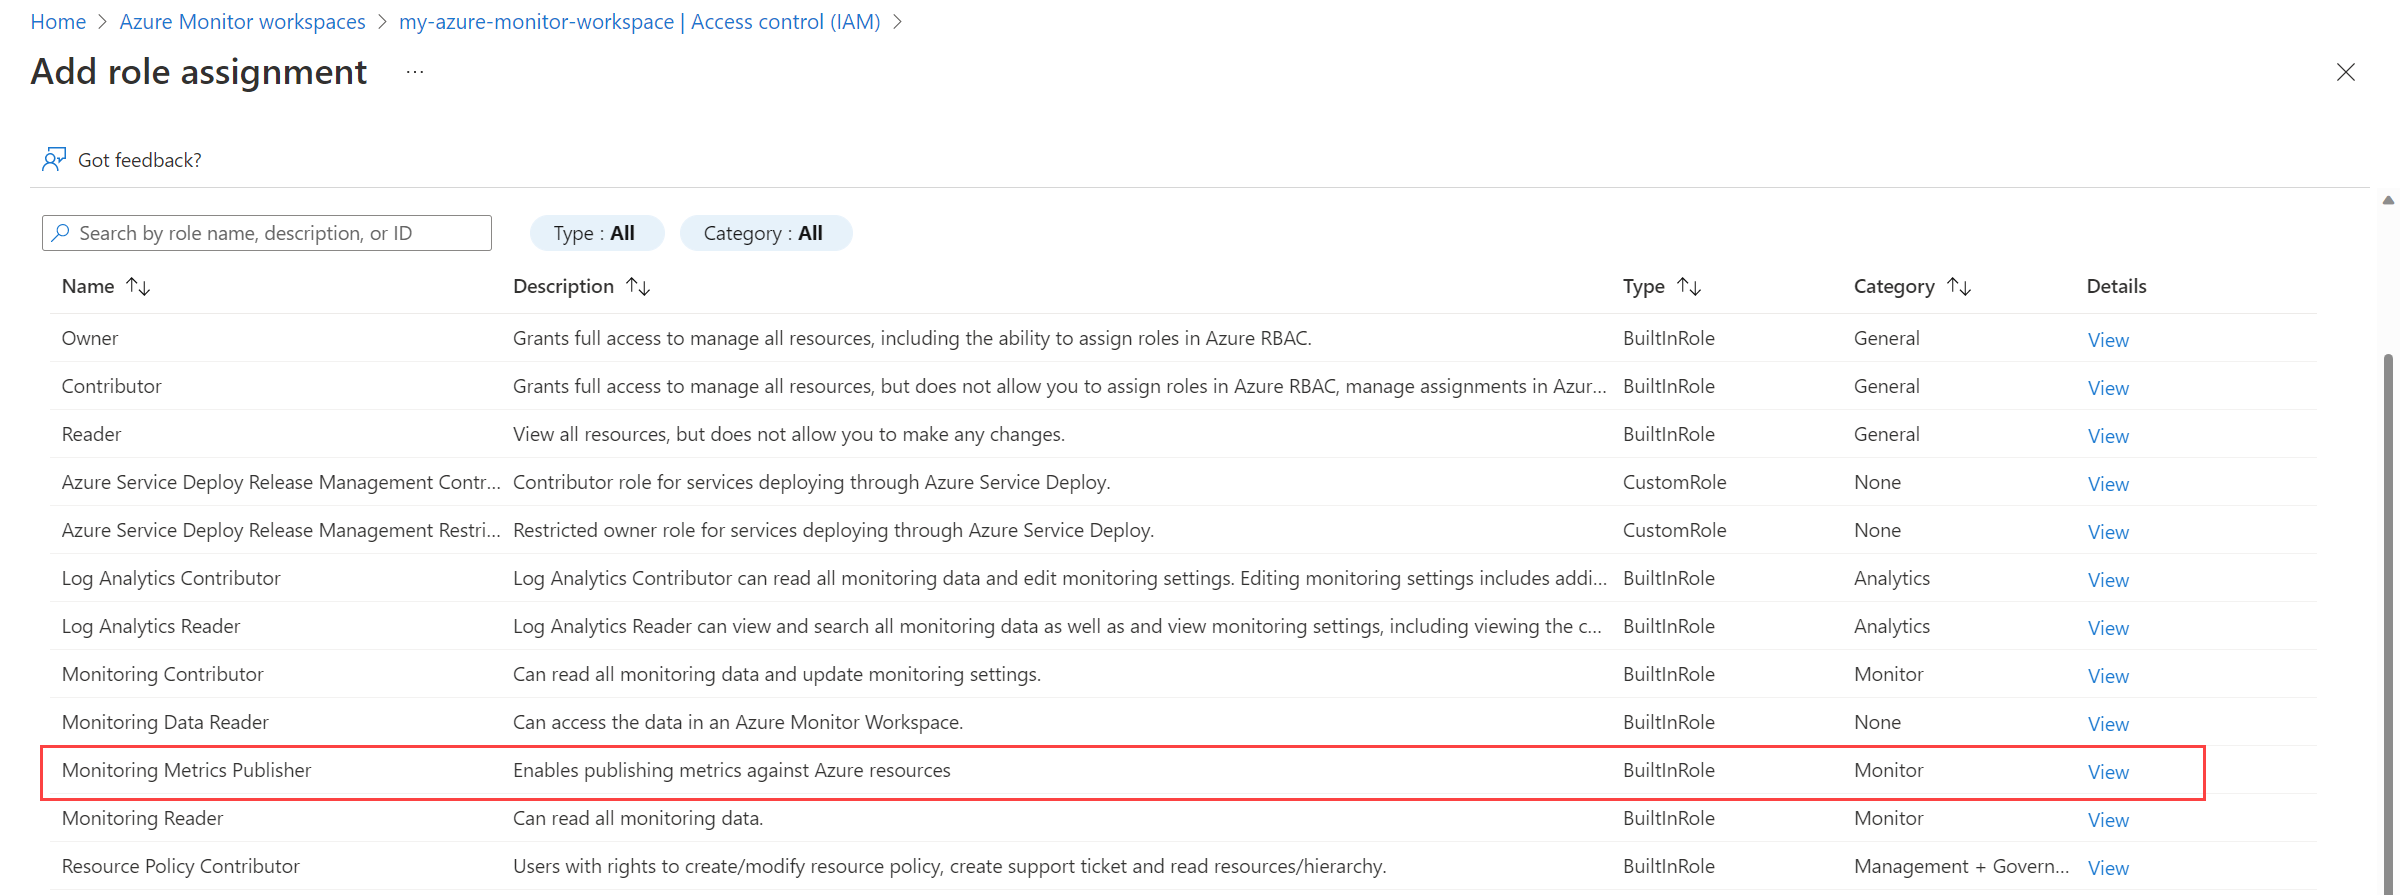
Select the Monitoring Metrics Publisher role, and then select Next.
Select Managed Identity, and then choose Select members. Select the subscription that contains the user-assigned identity, and then select User-assigned managed identity. Select the user-assigned identity that you want to use, and then choose Select.
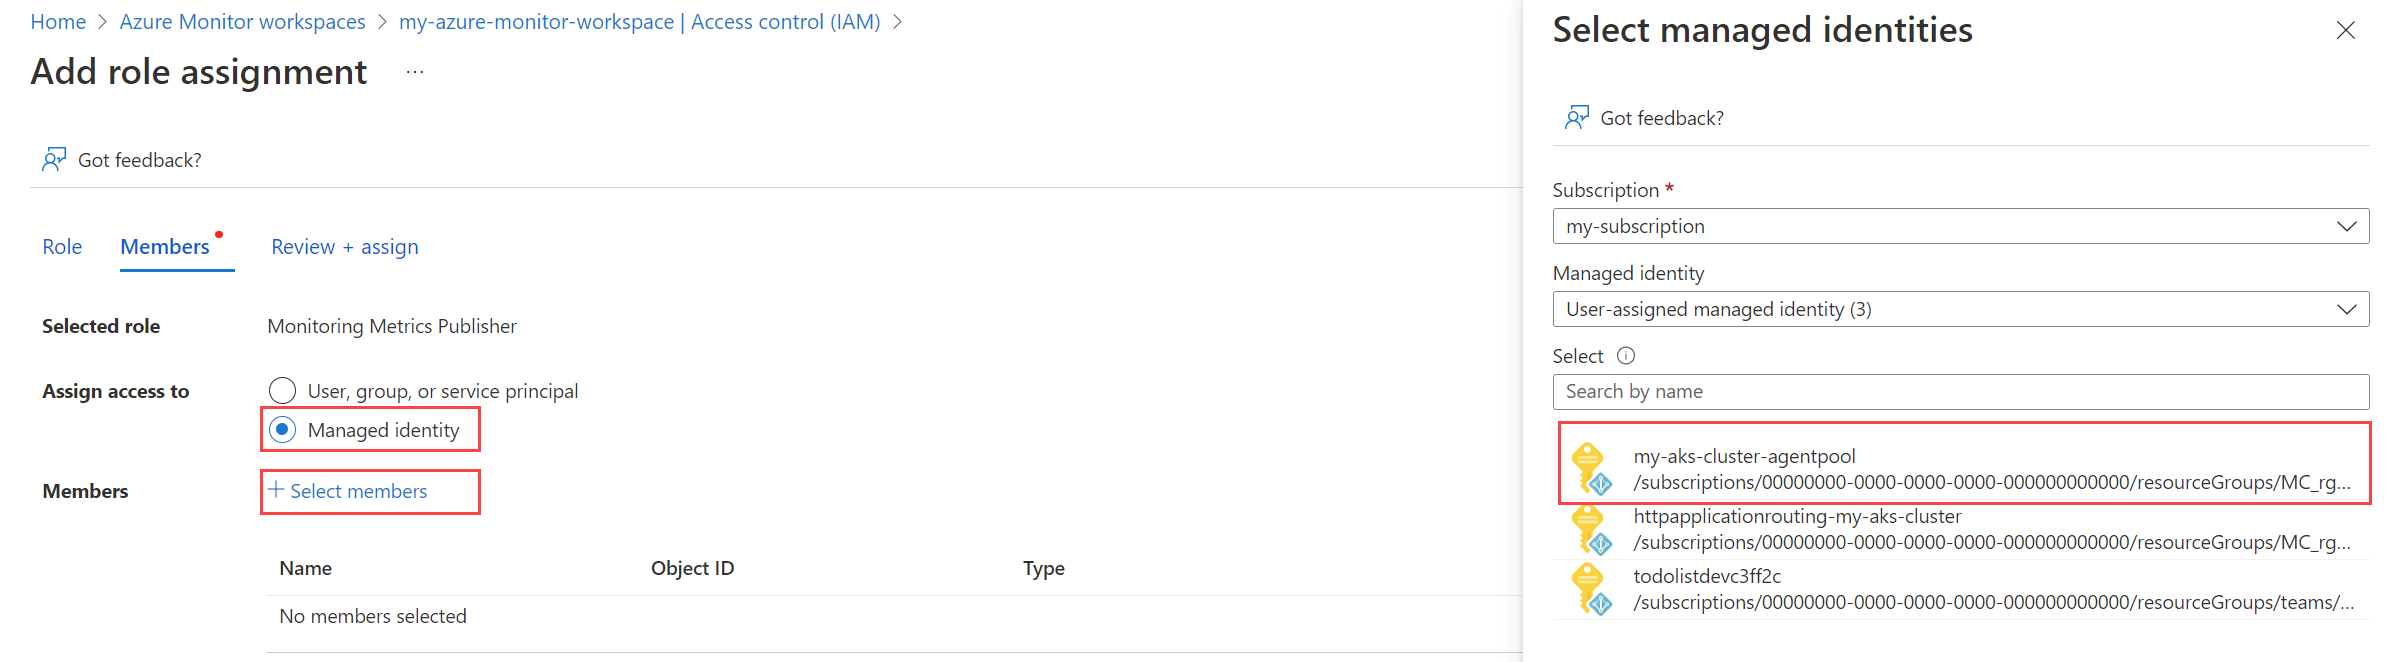
To complete the role assignment, select Review + assign.


Give the AKS cluster access to the managed identity
This step isn't required if you're using an AKS identity. An AKS identity already has access to the cluster.
Important
To complete the steps in this section, you must have owner or user access administrator permissions for the cluster.
Identify the virtual machine scale sets in the node resource group for your cluster.
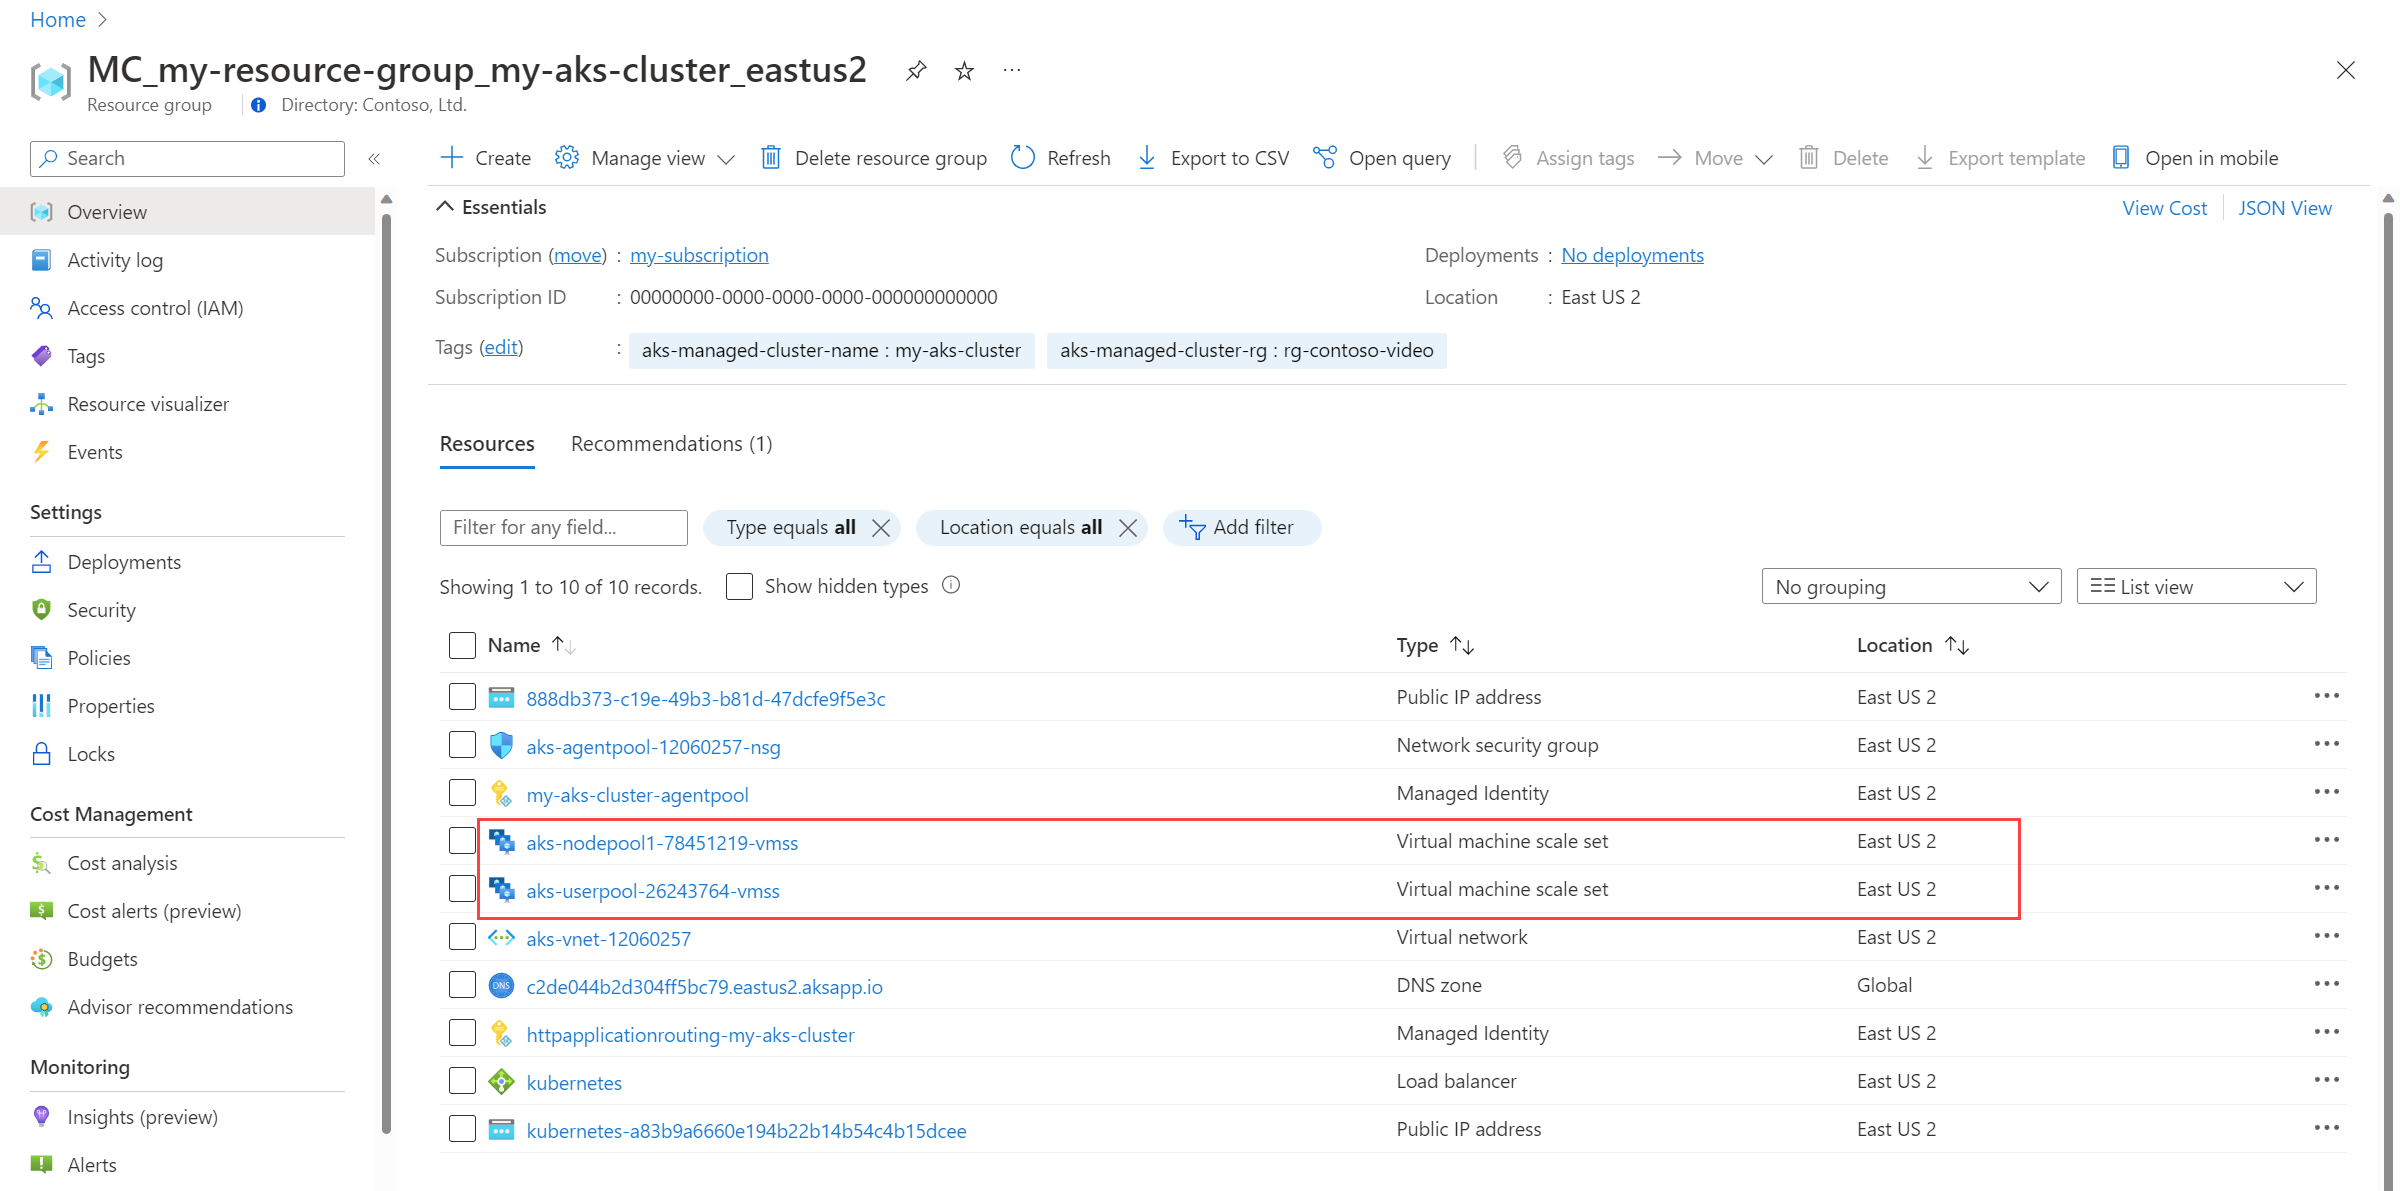
For each virtual machine scale set, run the following command in the Azure CLI:
az vmss identity assign -g <NODE-RESOURCE-GROUP> -n <VMSS-NAME> --identities <USER-ASSIGNED-IDENTITY-RESOURCE-ID>

Deploy a sidecar container to set up remote write
Copy the following YAML and save it to a file. The YAML uses port 8081 as the listening port. If you use a different port, modify the port in the YAML.
prometheus:
  prometheusSpec:
    externalLabels:
          cluster: <AKS-CLUSTER-NAME>

    ## https://prometheus.io/docs/prometheus/latest/configuration/configuration/#remote_write
    remoteWrite:
    - url: 'http://localhost:8081/api/v1/write'
  ## Azure Managed Prometheus currently exports some default mixins in Grafana.
  ## These mixins are compatible with Azure Monitor agent on your Azure Kubernetes Service cluster.
  ## However, these mixins aren't compatible with Prometheus metrics scraped by the Kube Prometheus stack.
  ## In order to make these mixins compatible, uncomment remote write relabel configuration below:

  ## writeRelabelConfigs:
  ##   - sourceLabels: [metrics_path]
  ##     regex: /metrics/cadvisor
  ##     targetLabel: job
  ##     replacement: cadvisor
  ##     action: replace
  ##   - sourceLabels: [job]
  ##     regex: 'node-exporter'
  ##     targetLabel: job
  ##     replacement: node
  ##     action: replace
    containers:
    - name: prom-remotewrite
      image: <CONTAINER-IMAGE-VERSION>
      imagePullPolicy: Always
      ports:
        - name: rw-port
          containerPort: 8081
      livenessProbe:
        httpGet:
          path: /health
          port: rw-port
        initialDelaySeconds: 10
        timeoutSeconds: 10
      readinessProbe:
        httpGet:
          path: /ready
          port: rw-port
        initialDelaySeconds: 10
        timeoutSeconds: 10
      env:
      - name: INGESTION_URL
        value: <INGESTION_URL>
      - name: LISTENING_PORT
        value: '8081'
      - name: IDENTITY_TYPE
        value: userAssigned
      - name: AZURE_CLIENT_ID
        value: <MANAGED-IDENTITY-CLIENT-ID>
      # Optional parameter
      - name: CLUSTER
        value: <CLUSTER-NAME>
Replace the following values in the YAML:
Value Description <AKS-CLUSTER-NAME>The name of your AKS cluster. <CONTAINER-IMAGE-VERSION>mcr.microsoft.com/azuremonitor/containerinsights/ciprod/prometheus-remote-write/images:prom-remotewrite-20251208.1
The remote write container image version.<INGESTION-URL>The value for Metrics ingestion endpoint from the Overview page for the Azure Monitor workspace. <MANAGED-IDENTITY-CLIENT-ID>The value for Client ID from the Overview page for the managed identity. <CLUSTER-NAME>Name of the cluster that Prometheus is running on. Important
For Azure Government cloud, add the following environment variables in the
envsection of the YAML file:- name: INGESTION_AAD_AUDIENCE value: https://monitor.azure.us/Open Azure Cloud Shell and upload the YAML file.
Use Helm to apply the YAML file and update your Prometheus configuration:
# set context to your cluster
az aks get-credentials -g <aks-rg-name> -n <aks-cluster-name>

# use Helm to update your remote write config
helm upgrade -f <YAML-FILENAME>.yml prometheus prometheus-community/kube-prometheus-stack --namespace <namespace where Prometheus pod resides>
Verification and troubleshooting
For verification and troubleshooting information, see Troubleshooting remote write and Azure Monitor managed service for Prometheus remote write.
Next steps
- Collect Prometheus metrics from an AKS cluster
- Learn more about Azure Monitor managed service for Prometheus
- Remote write in Azure Monitor managed service for Prometheus
- Send Prometheus data to Azure Monitor by using Microsoft Entra authentication
- Send Prometheus data to Azure Monitor by using Microsoft Entra Workload ID (preview) authentication
- Send Prometheus data to Azure Monitor by using Microsoft Entra pod-managed identity (preview) authentication
Verify remote write is working correctly
Use the following methods to verify that Prometheus data is being sent into your Azure Monitor workspace.
Kubectl commands
Use the following command to view logs from the side car container. Remote write data is flowing if the output has nonzero value for avgBytesPerRequest and avgRequestDuration.
kubectl logs <Prometheus-Pod-Name> <Azure-Monitor-Side-Car-Container-Name> --namespace <namespace-where-Prometheus-is-running>
# example: kubectl logs prometheus-prometheus-kube-prometheus-prometheus-0 prom-remotewrite --namespace monitoring
The output from this command has the following format:
time="2022-11-02T21:32:59Z" level=info msg="Metric packets published in last 1 minute" avgBytesPerRequest=19713 avgRequestDurationInSec=0.023 failedPublishing=0 successfullyPublished=122
Azure Monitor metrics explorer with PromQL
To check if the metrics are flowing to the Azure Monitor workspace, from your Azure Monitor workspace in the Azure portal, select Metrics. Use the metrics explorer to query the metrics that you're expecting from the self-managed Prometheus environment. For more information, see Metrics explorer.
Prometheus explorer in Azure Monitor Workspace
Prometheus Explorer provides a convenient way to interact with Prometheus metrics within your Azure environment, making monitoring and troubleshooting more efficient. To use the Prometheus explorer, from to your Azure Monitor workspace in the Azure portal and select Prometheus Explorer to query the metrics that you're expecting from the self-managed Prometheus environment. For more information, see Prometheus explorer.
Grafana
Use PromQL queries in Grafana and verify that the results return expected data. For more information on configuring Grafana for Azure managed service for Prometheus, see Use Azure Monitor managed service for Prometheus as data source for Grafana using managed system identity
Troubleshoot remote write
If remote data isn't appearing in your Azure Monitor workspace, see Troubleshoot remote write for common issues and solutions.