Alert Management solution in Azure Log Analytics
![]()
Caution
This solution is no longer in active development and may not work as expected. We suggest you try using Azure Resource Graph to query Azure Monitor alerts.
The Alert Management solution helps you analyze all of the alerts in your Log Analytics repository. These alerts may have come from a variety of sources including those sources created by Log Analytics or imported from Nagios or Zabbix. The solution also imports alerts from any connected System Center Operations Manager management groups.
Prerequisites
The solution works with any records in the Log Analytics repository with a type of Alert, so you must perform whatever configuration is required to collect these records.
- For Log Analytics alerts, create alert rules to create alert records directly in the repository.
- For Nagios and Zabbix alerts, configure those servers to send alerts to Log Analytics.
- For System Center Operations Manager alerts, connect your Operations Manager management group to your Log Analytics workspace. Any alerts created in System Center Operations Manager are imported into Log Analytics.
Configuration
Add the Alert Management solution to your Log Analytics workspace using the process described in Add solutions. There is no further configuration required.
Management packs
If your System Center Operations Manager management group is connected to your Log Analytics workspace, then the following management packs are installed in System Center Operations Manager when you add this solution. There is no configuration or maintenance of the management packs required.
- Microsoft System Center Advisor Alert Management (Microsoft.IntelligencePacks.AlertManagement)
For more information on how solution management packs are updated, see Connect Operations Manager to Log Analytics.
Data collection
Agents
The following table describes the connected sources that are supported by this solution.
| Connected Source | Support | Description |
|---|---|---|
| Windows agents | No | Direct Windows agents do not generate alerts. Log Analytics alerts can be created from events and performance data collected from Windows agents. |
| Linux agents | No | Direct Linux agents do not generate alerts. Log Analytics alerts can be created from events and performance data collected from Linux agents. Nagios and Zabbix alerts are collected from those servers that require the Linux agent. |
| System Center Operations Manager management group | Yes | Alerts that are generated on Operations Manager agents are delivered to the management group and then forwarded to Log Analytics. A direct connection from Operations Manager agents to Log Analytics is not required. Alert data is forwarded from the management group to the Log Analytics repository. |
Collection frequency
- Alert records are available to the solution as soon as they are stored in the repository.
- Alert data is sent from the Operations Manager management group to Log Analytics every three minutes.
Using the solution
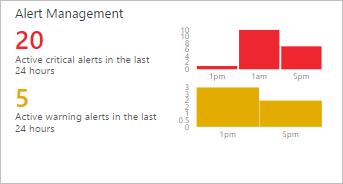
When you add the Alert Management solution to your Log Analytics workspace, the Alert Management tile is added to your dashboard. This tile displays a count and graphical representation of the number of currently active alerts that were generated within the last 24 hours. You cannot change this time range.

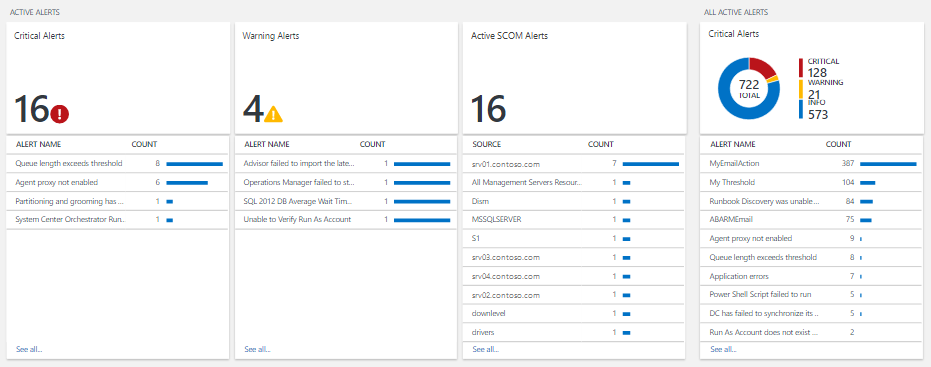
Click on the Alert Management tile to open the Alert Management dashboard. The dashboard includes the columns in the following table. Each column lists the top 10 alerts by count matching that column's criteria for the specified scope and time range. You can run a log search that provides the entire list by clicking See all at the bottom of the column or by clicking the column header.
| Column | Description |
|---|---|
| Critical Alerts | All alerts with a severity of Critical grouped by alert name. Click on an alert name to run a log search returning all records for that alert. |
| Warning Alerts | All alerts with a severity of Warning grouped by alert name. Click on an alert name to run a log search returning all records for that alert. |
| Active System Center Operations Manager Alerts | All alerts collected from Operations Manager with any state other than Closed grouped by source that generated the alert. |
| All Active Alerts | All alerts with any severity grouped by alert name. Only includes Operations Manager alerts with any state other than Closed. |
If you scroll to the right, the dashboard lists several common queries that you can click on to perform a log search for alert data.

Log Analytics records
The Alert Management solution analyzes any record with a type of Alert. Alerts created by Log Analytics or collected from Nagios or Zabbix are not directly collected by the solution.
The solution does import alerts from System Center Operations Manager and creates a corresponding record for each with a type of Alert and a SourceSystem of OpsManager. These records have the properties in the following table:
| Property | Description |
|---|---|
Type |
Alert |
SourceSystem |
OpsManager |
AlertContext |
Details of the data item that caused the alert to be generated in XML format. |
AlertDescription |
Detailed description of the alert. |
AlertId |
GUID of the alert. |
AlertName |
Name of the alert. |
AlertPriority |
Priority level of the alert. |
AlertSeverity |
Severity level of the alert. |
AlertState |
Latest resolution state of the alert. |
LastModifiedBy |
Name of the user who last modified the alert. |
ManagementGroupName |
Name of the management group where the alert was generated. |
RepeatCount |
Number of times the same alert was generated for the same monitored object since being resolved. |
ResolvedBy |
Name of the user who resolved the alert. Empty if the alert has not yet been resolved. |
SourceDisplayName |
Display name of the monitoring object that generated the alert. |
SourceFullName |
Full name of the monitoring object that generated the alert. |
TicketId |
Ticket ID for the alert if the System Center Operations Manager environment is integrated with a process for assigning tickets for alerts. Empty of no ticket ID is assigned. |
TimeGenerated |
Date and time that the alert was created. |
TimeLastModified |
Date and time that the alert was last changed. |
TimeRaised |
Date and time that the alert was generated. |
TimeResolved |
Date and time that the alert was resolved. Empty if the alert has not yet been resolved. |
Sample log searches
The following table provides sample log searches for alert records collected by this solution:
| Query | Description |
|---|---|
| Alert | where SourceSystem == "OpsManager" and AlertSeverity == "error" and TimeRaised > ago(24h) | Critical alerts raised during the past 24 hours |
| Alert | where AlertSeverity == "warning" and TimeRaised > ago(24h) | Warning alerts raised during the past 24 hours |
| Alert | where SourceSystem == "OpsManager" and AlertState != "Closed" and TimeRaised > ago(24h) | summarize Count = count() by SourceDisplayName | Sources with active alerts raised during the past 24 hours |
| Alert | where SourceSystem == "OpsManager" and AlertSeverity == "error" and TimeRaised > ago(24h) and AlertState != "Closed" | Critical alerts raised during the past 24 hours that are still active |
| Alert | where SourceSystem == "OpsManager" and TimeRaised > ago(24h) and AlertState == "Closed" | Alerts raised during the past 24 hours that are now closed |
| Alert | where SourceSystem == "OpsManager" and TimeRaised > ago(1d) | summarize Count = count() by AlertSeverity | Alerts raised during the past 1 day grouped by their severity |
| Alert | where SourceSystem == "OpsManager" and TimeRaised > ago(1d) | sort by RepeatCount desc | Alerts raised during the past 1 day sorted by their repeat count value |
Next steps
- Learn about Alerts in Log Analytics for details on generating alerts from Log Analytics.