Note
Access to this page requires authorization. You can try signing in or changing directories.
Access to this page requires authorization. You can try changing directories.
Azure Service Health monitors the health of your cloud resources, including Log Analytics workspaces. When a Log Analytics workspace is healthy, data you collect from resources in your IT environment is available for querying and analysis in a relatively short period of time, known as latency. This article explains how to view the health status of your Log Analytics workspace, set up workspace health status alerts, and view workspace health metrics.
Azure Service Health monitors:
- Resource health: information about the health of your individual cloud resources, such as a specific Log Analytics workspace.
- Service health: information about the health of the Azure services and regions you're using, which might affect your Log Analytics workspace, including communications about outages, planned maintenance activities, and other health advisories.
Permissions required
- To view Log Analytics workspace health, you need
*/readpermissions to the Log Analytics workspace, as provided by the Log Analytics Reader built-in role, for example. - To set up health status alerts, you need
Microsoft.Insights/ActivityLogAlerts/Writepermissions to the Log Analytics workspace, as provided by the Monitoring Contributor built-in role, for example.
View Log Analytics workspace health and set up health status alerts
To view your Log Analytics workspace health and set up health status alerts:
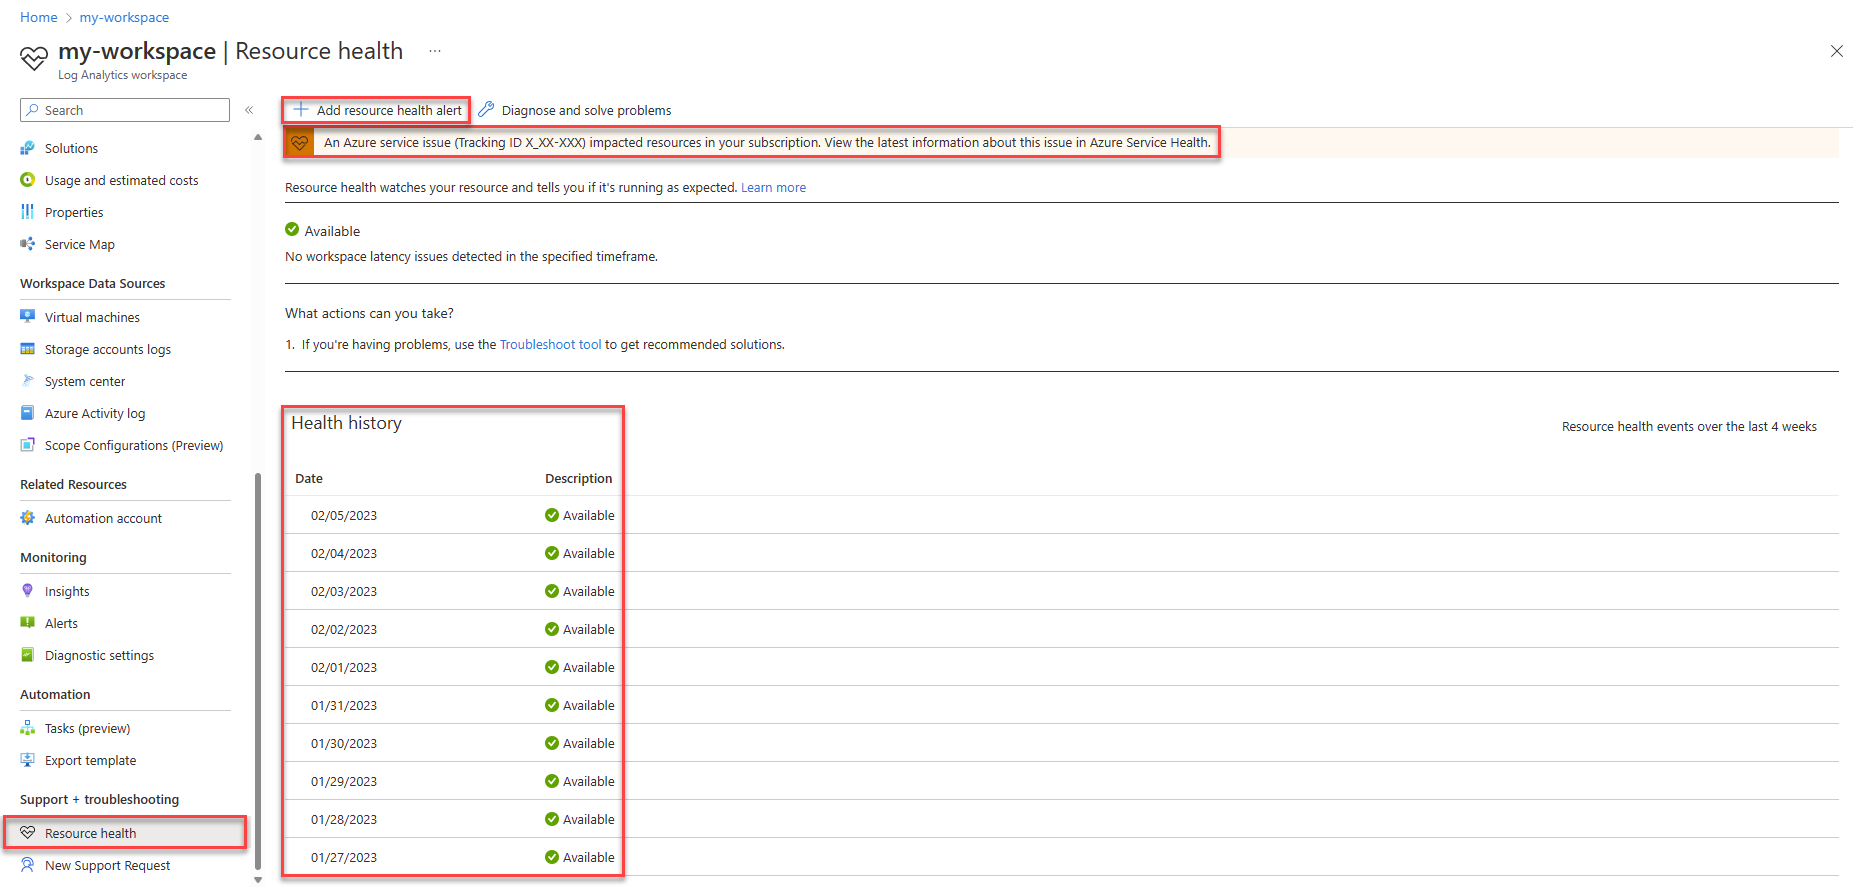
Select Resource health from the Log Analytics workspace menu.
The Resource health screen shows:
- Health history: Indicates whether Azure Service Health has detected latency or query execution issues in the specific Log Analytics workspace. To further investigate latency issues related to your workspace, see Investigate latency.
- Azure service issues: Displayed when a known issue with an Azure service might affect latency in the Log Analytics workspace. Select the message to view details about the service issue in Azure Service Health.
Note
- Service health notifications do not indicate that your Log Analytics workspace is necessarily affected by the know service issue. If your Log Analytics workspace resource health status is Available, Azure Service Health did not detect issues in your workspace.
- Resource Health excludes data types for which long ingestion latency is expected. For example, Application Insights data types that calculate the application map data and are known to add latency.
This table describes the possible resource health status values for a Log Analytics workspace:
Resource health status Description Available Average latency and no query execution issues detected. Unavailable Higher than average latency detected. Degraded Query failures detected. Unknown Currently unable to determine Log Analytics workspace health because you haven't run queries or ingested data to this workspace recently. To set up health status alerts, you can either enable recommended out-of-the-box alert rules, or manually create new alert rules.
To enable the recommended alert rules:
Select Alerts > Enable recommended alert rules.
The Enable recommended alert rules pane opens with a list of recommended alert rules for your Log Analytics workspace.
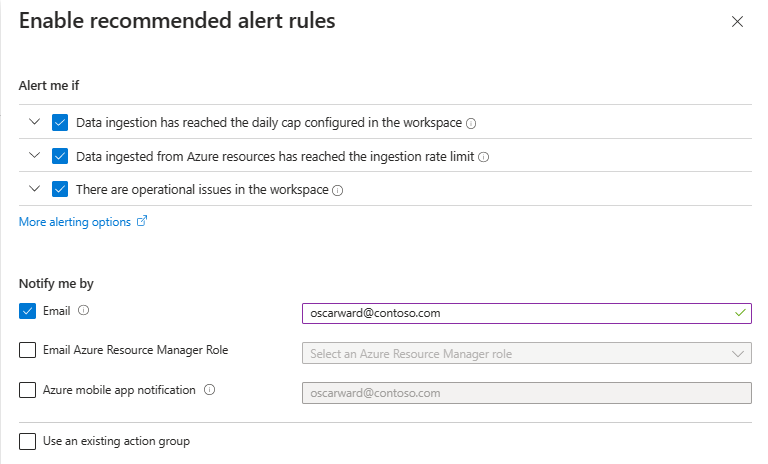
In the Alert me if section, select all of the rules you want to enable.
In the Notify me by section, select the way you want to be notified if an alert is triggered.
Select Use an existing action group, and enter the details of the existing action group if you want to use an action group that already exists.
Select Enable.
To create a new alert rule:
Select Add resource health alert.
The Create alert rule wizard opens, with the Scope and Condition panes prepopulated. By default, the rule triggers alerts all status changes in all Log Analytics workspaces in the subscription. If necessary, you can edit and modify the scope and condition at this stage.
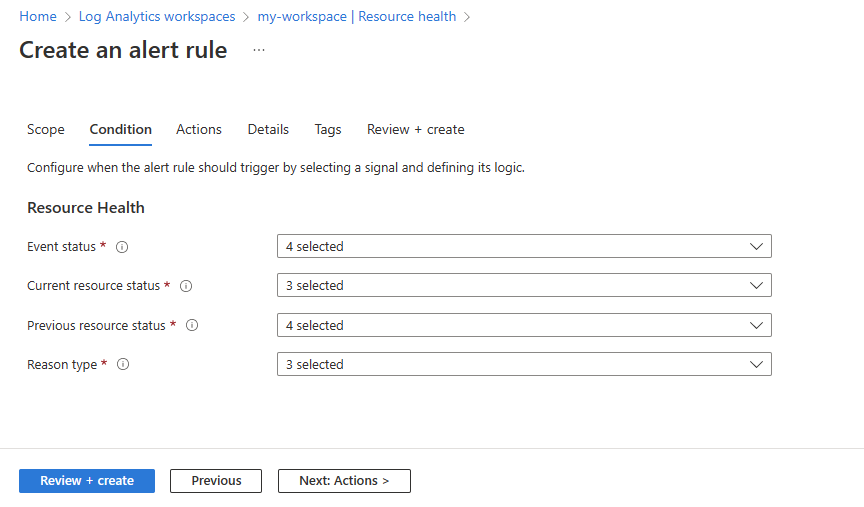
Follow the rest of the steps in Create a new alert rule in the Azure portal.


View Log Analytics workspace health metrics
Azure Monitor exposes a set of metrics that provide insight into Log Analytics workspace health.
To view Log Analytics workspace health metrics:
Select Metrics from the Log Analytics workspace menu. This opens Metrics Explorer in context of your Log Analytics workspace.
In the Metric field, select one of the Log Analytics workspace health metrics:
Category Metric name Scope Description SLI AvailabilityRate_Query Workspace Percentage of successful user queries in the Log Analytics workspace within the selected time range.
This number includes all queries that return 2XX, 4XX, and 504 response codes; in other words, all user queries that don't result in a service error.SLI Ingestion Time Workspace or table Indicates the time it takes (in seconds) for a record to become available for queries after being received by Azure Monitor Logs. We recommend you examine ingestion time for specific tables.
Available for frequently used tables. To see which tables in your workspaces support the Ingestion Time metric, check the Table Name dimension values for this metric.SLI Ingestion Volume Workspace or table Number of records ingested into a workspace or a table.
Available for frequently used tables. To see which tables in your workspaces support the Ingestion Volume metric, check the Table Name dimension values for this metric.User Queries Query count Workspace Total number of user queries in the Log Analytics workspace within the selected time range.
This number includes only user-initiated queries, and doesn't include queries initiated by Sentinel rules and alert-related queries.User Queries Query failure count Workspace Total number of failed user queries in the Log Analytics workspace within the selected time range.
This number includes all queries that return 5XX response codes - except 504 Gateway Timeout - which indicate an error related to the application gateway or the backend server.Data Export Bytes Exported Workspace Total number of bytes exported to destination from Log Analytics workspace within the selected time range. The size of data exported is the number of bytes in the exported JSON formatted data. 1 GB = 10^9 bytes. Data Export Export Failures Workspace Total number of failed export requests in the Log Analytics workspace within the selected time range.
This number includes export failures that can result by Azure Monitor, destination resource availability, or throttling.Data Export Records exported Workspace Total number of records exported from Log Analytics workspace within the selected time range.
Investigate Log Analytics workspace health issues
To investigate Log Analytics workspace health issues:
- Use Log Analytics Workspace Insights, which provides a unified view of your workspace usage, performance, health, agent, queries, and change log.
- Query the data in your Log Analytics workspace to understand which factors are contributing greater than expected latency in your workspace.
- Use the
_LogOperationfunction to view and set up alerts about operational issues logged in your Log Analytics workspace.
Next steps
Learn more about: