Note
Access to this page requires authorization. You can try signing in or changing directories.
Access to this page requires authorization. You can try changing directories.
You can integrate Azure Monitor Log Analytics and Microsoft Excel using M query and the Log Analytics API. This integration allows you to send up a certain number of records and MB of data. These limits are documented in the Azure Monitor Log Analytics workspace limits in the Azure portal section.
Note
Because Excel is a local client application, local hardware and software limitations impact it's performance and ability to process large sets of data.
Prerequisites
To integrate Log Analytics and Excel, you need:
- Excel local client application.
- A Log Analytics workspace that has some data. If needed, create a diagnostic setting to send data to a Log Analytics workspace.
Permissions required
You must have Microsoft.OperationalInsights/workspaces/query/*/read permissions to the Log Analytics workspaces you query, as provided by the Log Analytics Reader built-in role, for example.
Create your M query in Log Analytics
Create and run your query in Log analytics as you normally would. Don't worry if you hit the number of records limitation in the user interface. We recommend you use relative dates - like the
agofunction or the UI time picker - so Excel refreshes the right set of data.Export Query - Once you are happy with the query and its results, export the query to M using Log Analytics Export to Power BI (M query) menu choice under the Export menu:
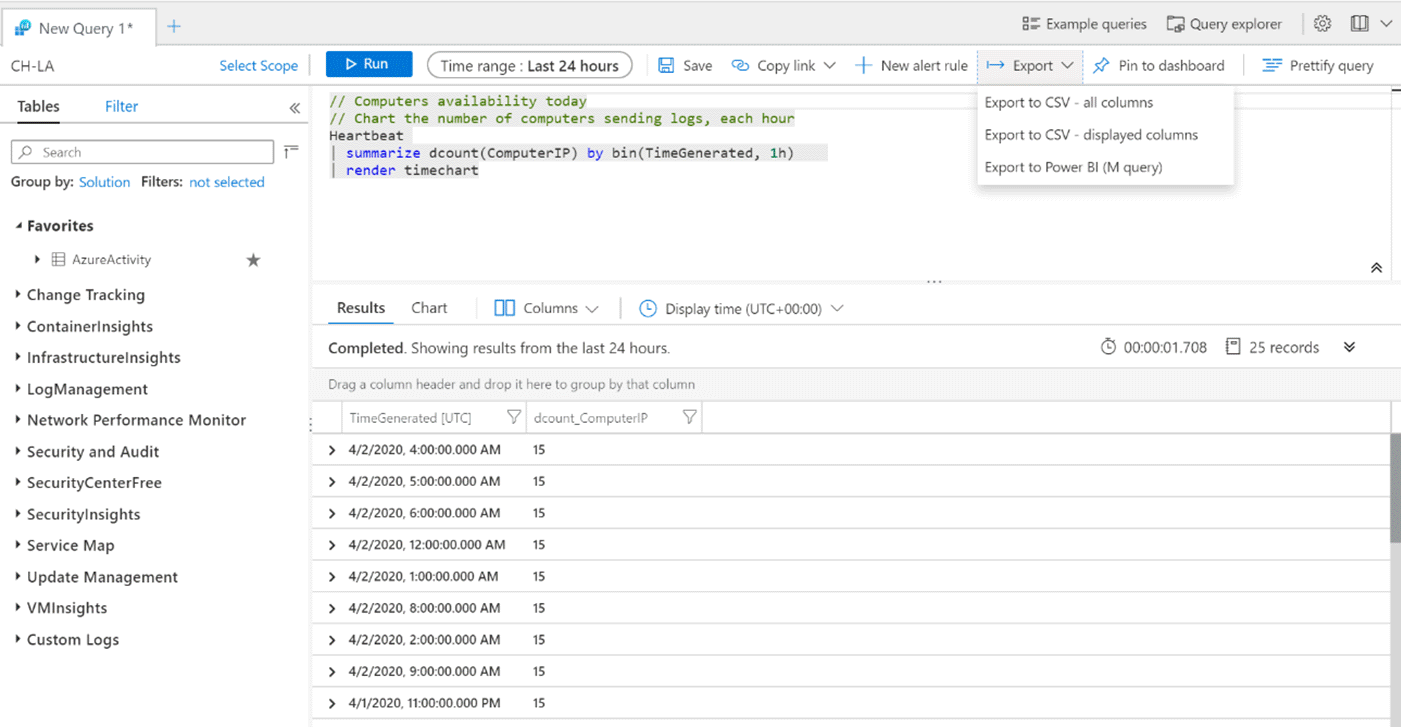
Choosing this option downloads a .txt file containing the M code you can use in Excel.
The query shown above exports the following M code. Here's an example of the M code exported for the query in our example:
/*
The exported Power Query Formula Language (M Language ) can be used with Power Query in Excel
and Power BI Desktop.
For Power BI Desktop follow the instructions below:
1) Download Power BI Desktop from https://powerbi.microsoft.com/desktop/
2) In Power BI Desktop select: 'Get Data' -> 'Blank Query'->'Advanced Query Editor'
3) Paste the M Language script into the Advanced Query Editor and select 'Done'
*/

let AnalyticsQuery =
let Source = Json.Document(Web.Contents("https://api.loganalytics.io/v1/workspaces/ddcfc599-cae0-48ee-9026-fffffffffffff/query",
[Query=[#"query"="

Heartbeat
| summarize dcount(ComputerIP) by bin(TimeGenerated, 1h)
| render timechart
",#"x-ms-app"="OmsAnalyticsPBI",#"timespan"="P1D",#"prefer"="ai.response-thinning=true"],Timeout=#duration(0,0,4,0)])),
TypeMap = #table(
{ "AnalyticsTypes", "Type" },
{
{ "string",   Text.Type },
{ "int",      Int32.Type },
{ "long",     Int64.Type },
{ "real",     Double.Type },
{ "timespan", Duration.Type },
{ "datetime", DateTimeZone.Type },
{ "bool",     Logical.Type },
{ "guid",     Text.Type },
{ "dynamic",  Text.Type }
}),
DataTable = Source[tables]{0},
Columns = Table.FromRecords(DataTable[columns]),
ColumnsWithType = Table.Join(Columns, {"type"}, TypeMap , {"AnalyticsTypes"}),
Rows = Table.FromRows(DataTable[rows], Columns[name]),
Table = Table.TransformColumnTypes(Rows, Table.ToList(ColumnsWithType, (c) => { c{0}, c{3}}))
in
Table
in AnalyticsQuery
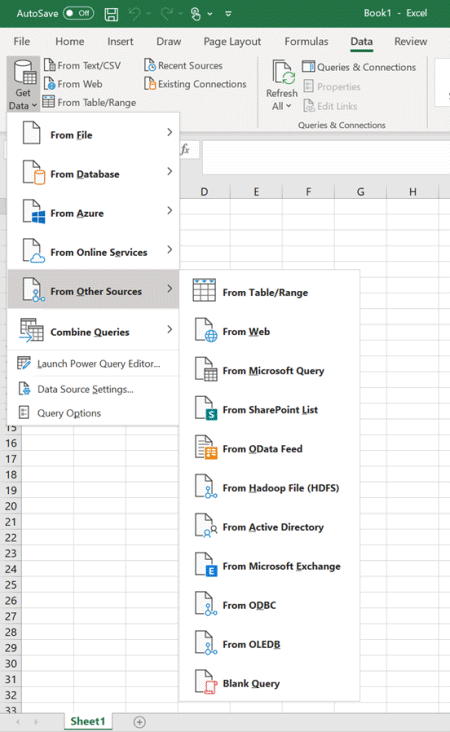
Connect Query to Excel
To import the query.
Open Microsoft Excel.
In the ribbon, go to the Data menu. Select get data. From other sources, select blank query:
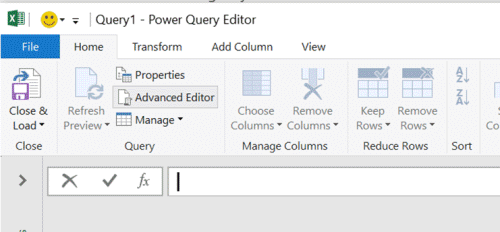
In the Power query window select Advanced editor:
Replace the text in the advanced editor with the query exported from Log Analytics:
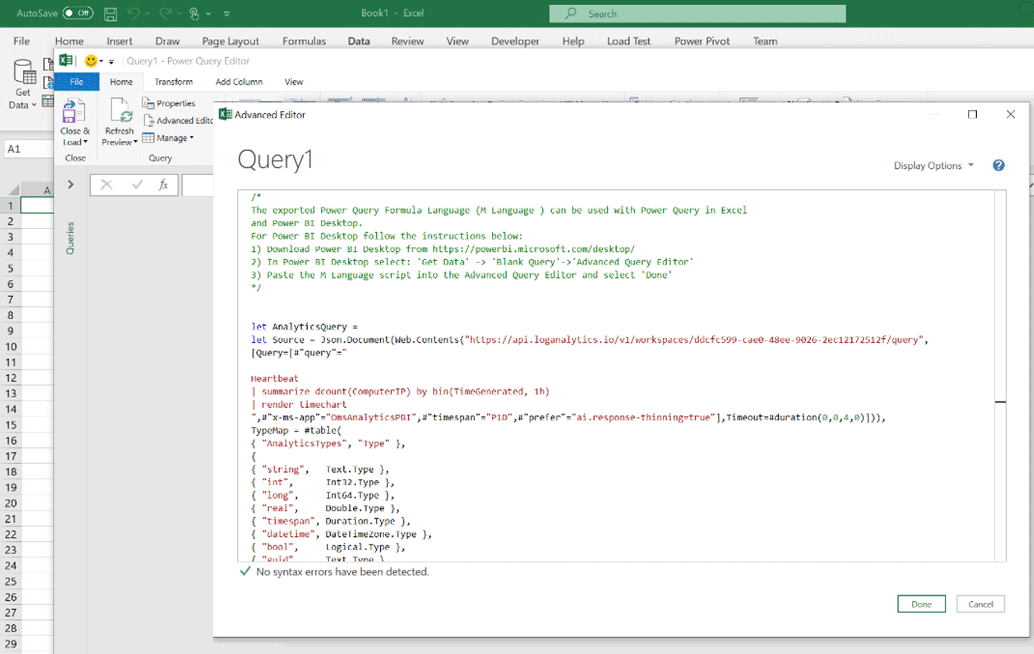
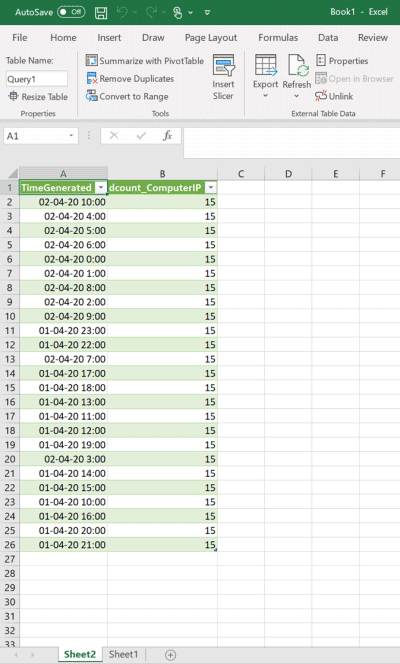
Select Done, and then Load and close. Excel executes the query using the Log analytics API and the result set then shown.
Note
If the number of records is less than expected, the volume of the results might exceeded the 61MiB limit. Try using project or project-away in your query to limit the columns to the one you need.
Refreshing data
You can refresh your data directly from Excel. In the Data menu group in the Excel ribbon, select the Refresh button.
Next steps
For more information about Excel's integrations with external data sources, see Import data from external data sources (Power Query)