Note
Access to this page requires authorization. You can try signing in or changing directories.
Access to this page requires authorization. You can try changing directories.
Note
We recommend that you use the Azure Az PowerShell module to interact with Azure. To get started, see Install Azure PowerShell. To learn how to migrate to the Az PowerShell module, see Migrate Azure PowerShell from AzureRM to Az.
In this article, you learn how to run Application Insights Profiler for .NET on your Azure virtual machine (VM) or Azure virtual machine scale set via three different methods:
- Visual Studio and Azure Resource Manager
- PowerShell
- Azure Resource Explorer
Select your preferred method tab to:
In this guide, you learn how to:
- Configure the Azure Diagnostics extension to run the .NET Profiler.
- Install the Application Insights SDK on a VM.
- Deploy your application.
- View Profiler traces via the Application Insights instance in the Azure portal.
Note
Currently, Application Insights Profiler for .NET isn't supported for on-premises servers.
Prerequisites
- A functioning ASP.NET Core application.
- An Application Insights resource.
- To review the Azure Resource Manager templates (ARM templates) for the Azure Diagnostics extension:
Add the Application Insights SDK to your application
Open your ASP.NET core project in Visual Studio.
Select Project > Add Application Insights Telemetry.
Select Azure Application Insights > Next.
Select the subscription where your Application Insights resource lives and select Next.
Select where to save the connection string and select Next.
Select Finish.
Note
For full instructions, including how to enable Application Insights on your ASP.NET Core application without Visual Studio, see the Application Insights for ASP.NET Core applications.
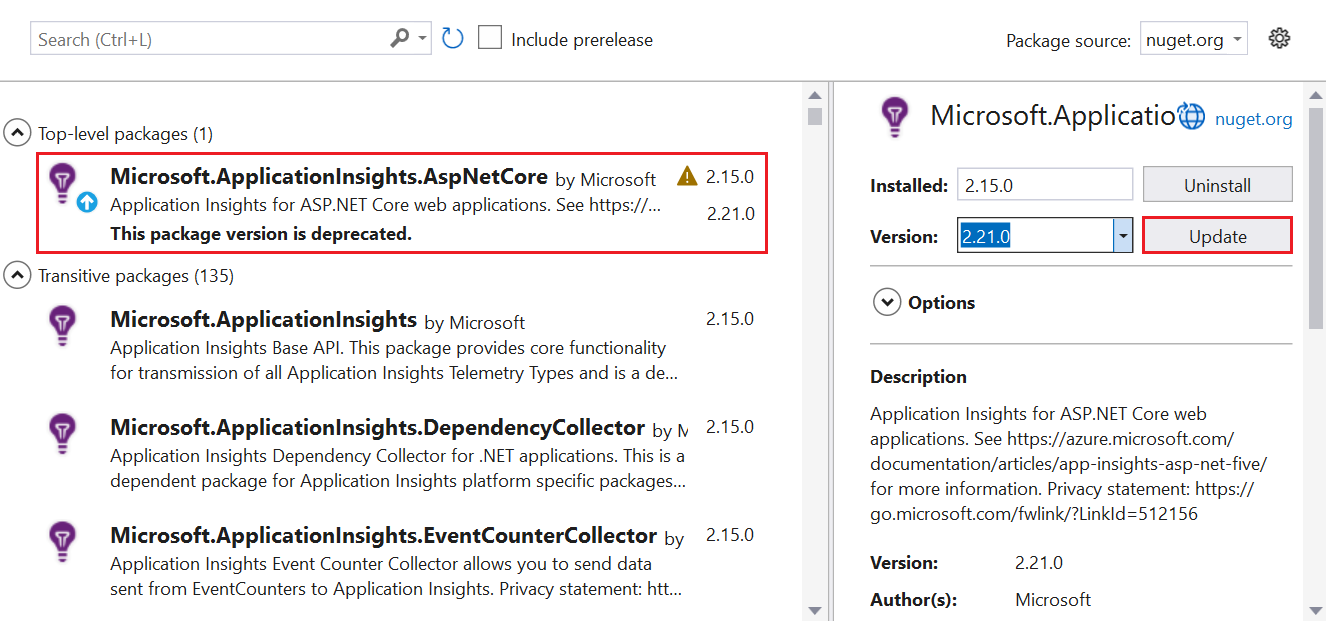
Confirm the latest stable release of the Application Insights SDK
Go to Project > Manage NuGet Packages.
Select Microsoft.ApplicationInsights.AspNetCore.
On the side pane, select the latest version of the SDK from the dropdown.
Select Update.
Enable the .NET Profiler
You can enable Profiler by any of three ways:
- Within your ASP.NET Core application by using an Azure Resource Manager template and Visual Studio. Recommended.
- By using a PowerShell command via the Azure CLI.
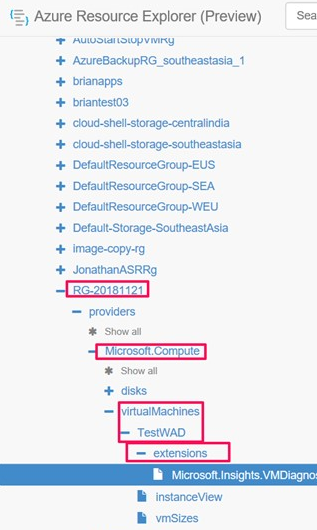
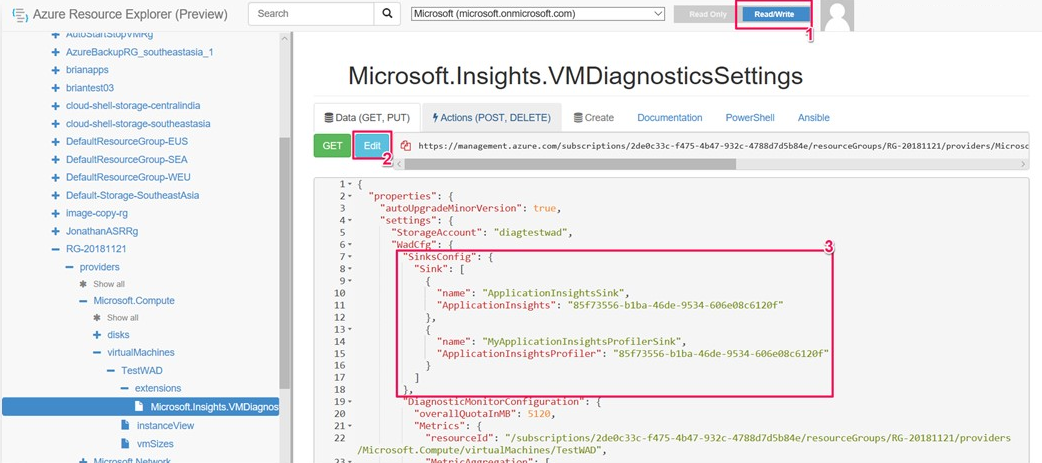
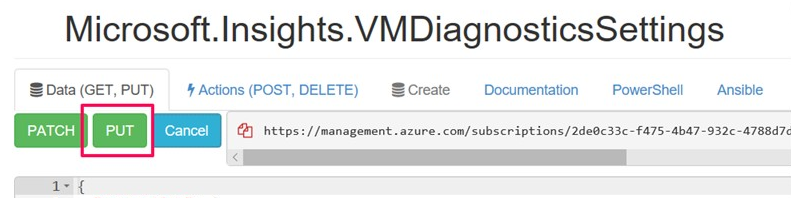
- By using Azure Resource Explorer.
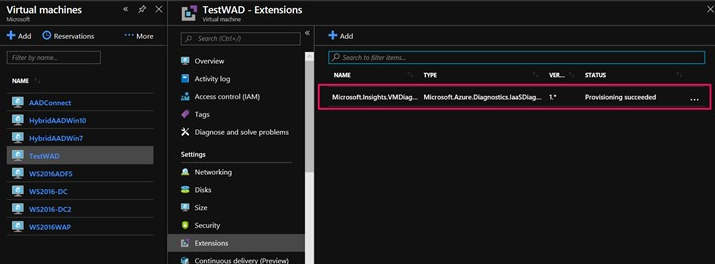
Install the Azure Diagnostics extension
Choose which ARM template to use:
In the template, locate the resource of type
extension.In Visual Studio, go to the
arm.jsonfile in your ASP.NET Core application that was added when you installed the Application Insights SDK.Add the resource type
extensionfrom the template to thearm.jsonfile to set up a VM or virtual machine scale set with Azure Diagnostics.Within the
WadCfgtag, add your Application Insights connection string toMyApplicationInsightsProfilerSink."WadCfg": { "SinksConfig": { "Sink": [ { "name": "MyApplicationInsightsProfilerSink", "ApplicationInsightsProfiler": "YOUR_APPLICATION_INSIGHTS_INSTRUMENTATION_KEY" } ] } }Deploy your application.