Note
Access to this page requires authorization. You can try signing in or changing directories.
Access to this page requires authorization. You can try changing directories.
Azure Monitor panel with Grafana allow you to view and create Grafana panel directly in the Azure portal. This article describes the dashboards that are available for Kubernetes clusters enabled for monitoring with Azure Monitor and also how to create your own dashboards.
Prerequisites
- The Kubernetes cluster must be enabled for Azure Monitor. See Enable monitoring for AKS clusters.
- To open the dashboards, you must have read access to the logs and Azure Monitor workspace holding the log and metric data. Analytics tier logs can be queried using the Kubernetes cluster as its scope, so direct access to the Log Analytics workspace is not required. Basic logs only support workspace scoped queries so access to the Log Analytics workspace is required.
Open a Kubernetes dashboard
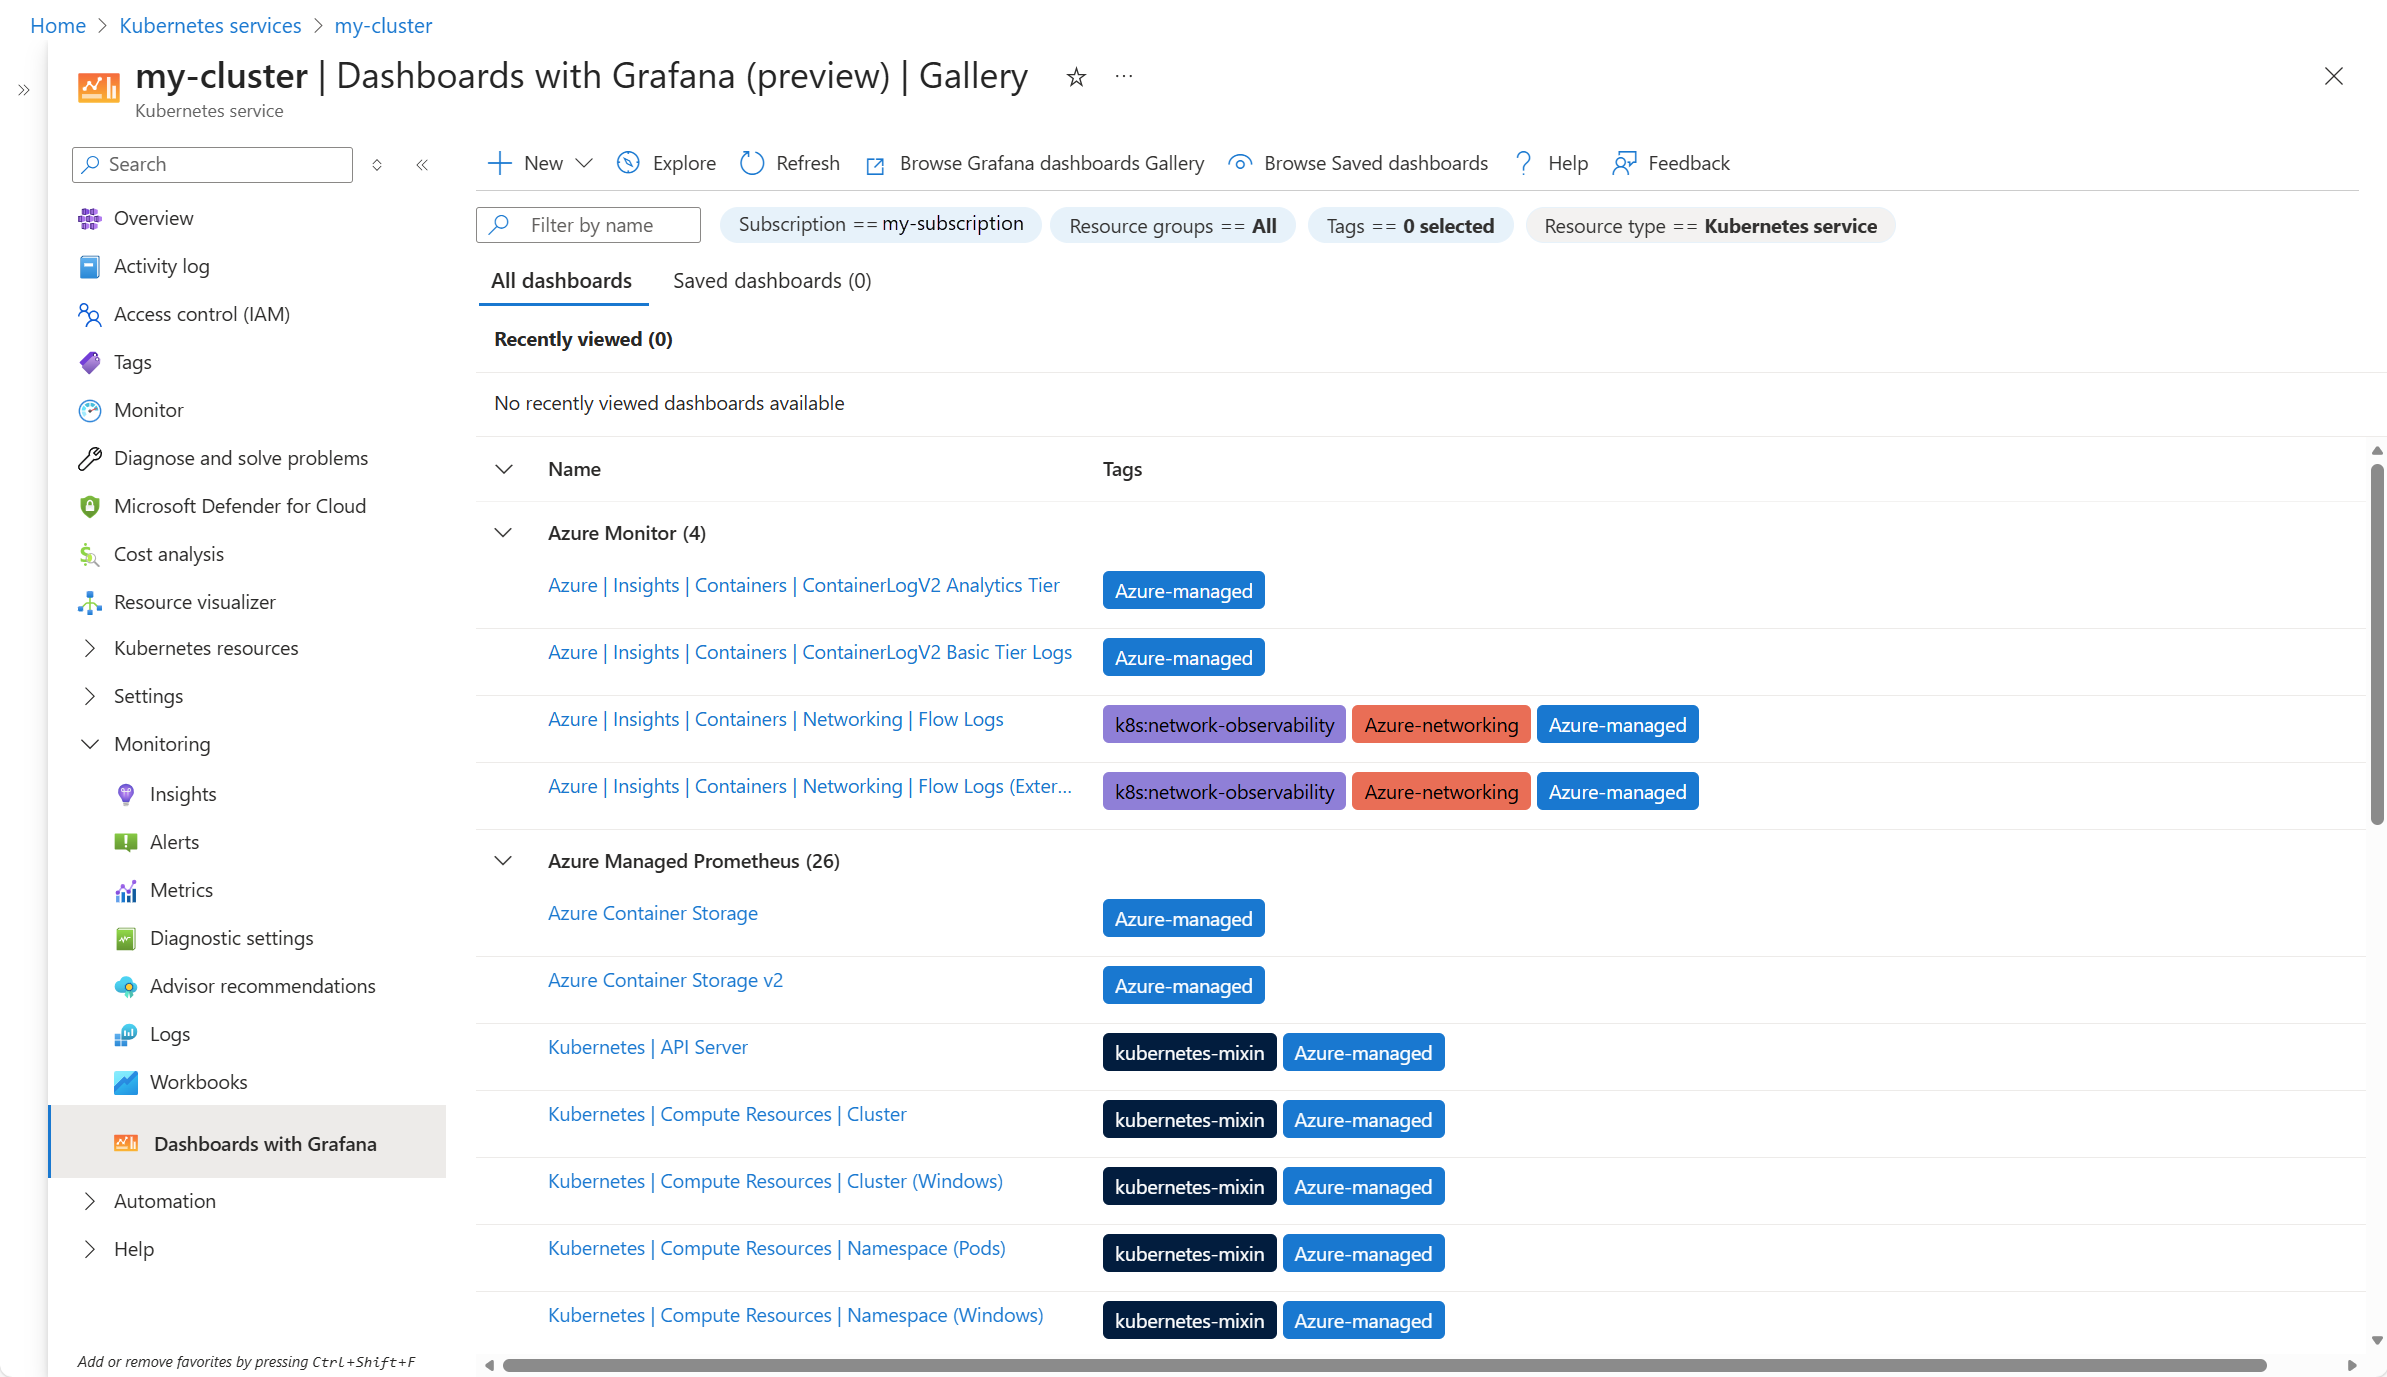
Dashboards included with Azure Monitor dashboards with Grafana related to Kubernetes clusters include the following:
- Cluster metrics collected by Azure Monitor managed service for Prometheus.
- Container logs collected by Azure Monitor Logs.
- Control Plane scenarios, such as Kubernetes API and ETCD.
- Advanced Container Networking and flow logs
- HPC dashboards for GPU monitoring
Open dashboards for a particular cluster from Dashboards with Grafana in its Monitoring section in the Azure portal. Only dashboards relevant to that cluster are listed.
Note
The same dashboards are also available from the Dashboards with Grafana section in Azure Monitor, but you must select the cluster after you open the dashboard.
Create a new Kubernetes dashboard
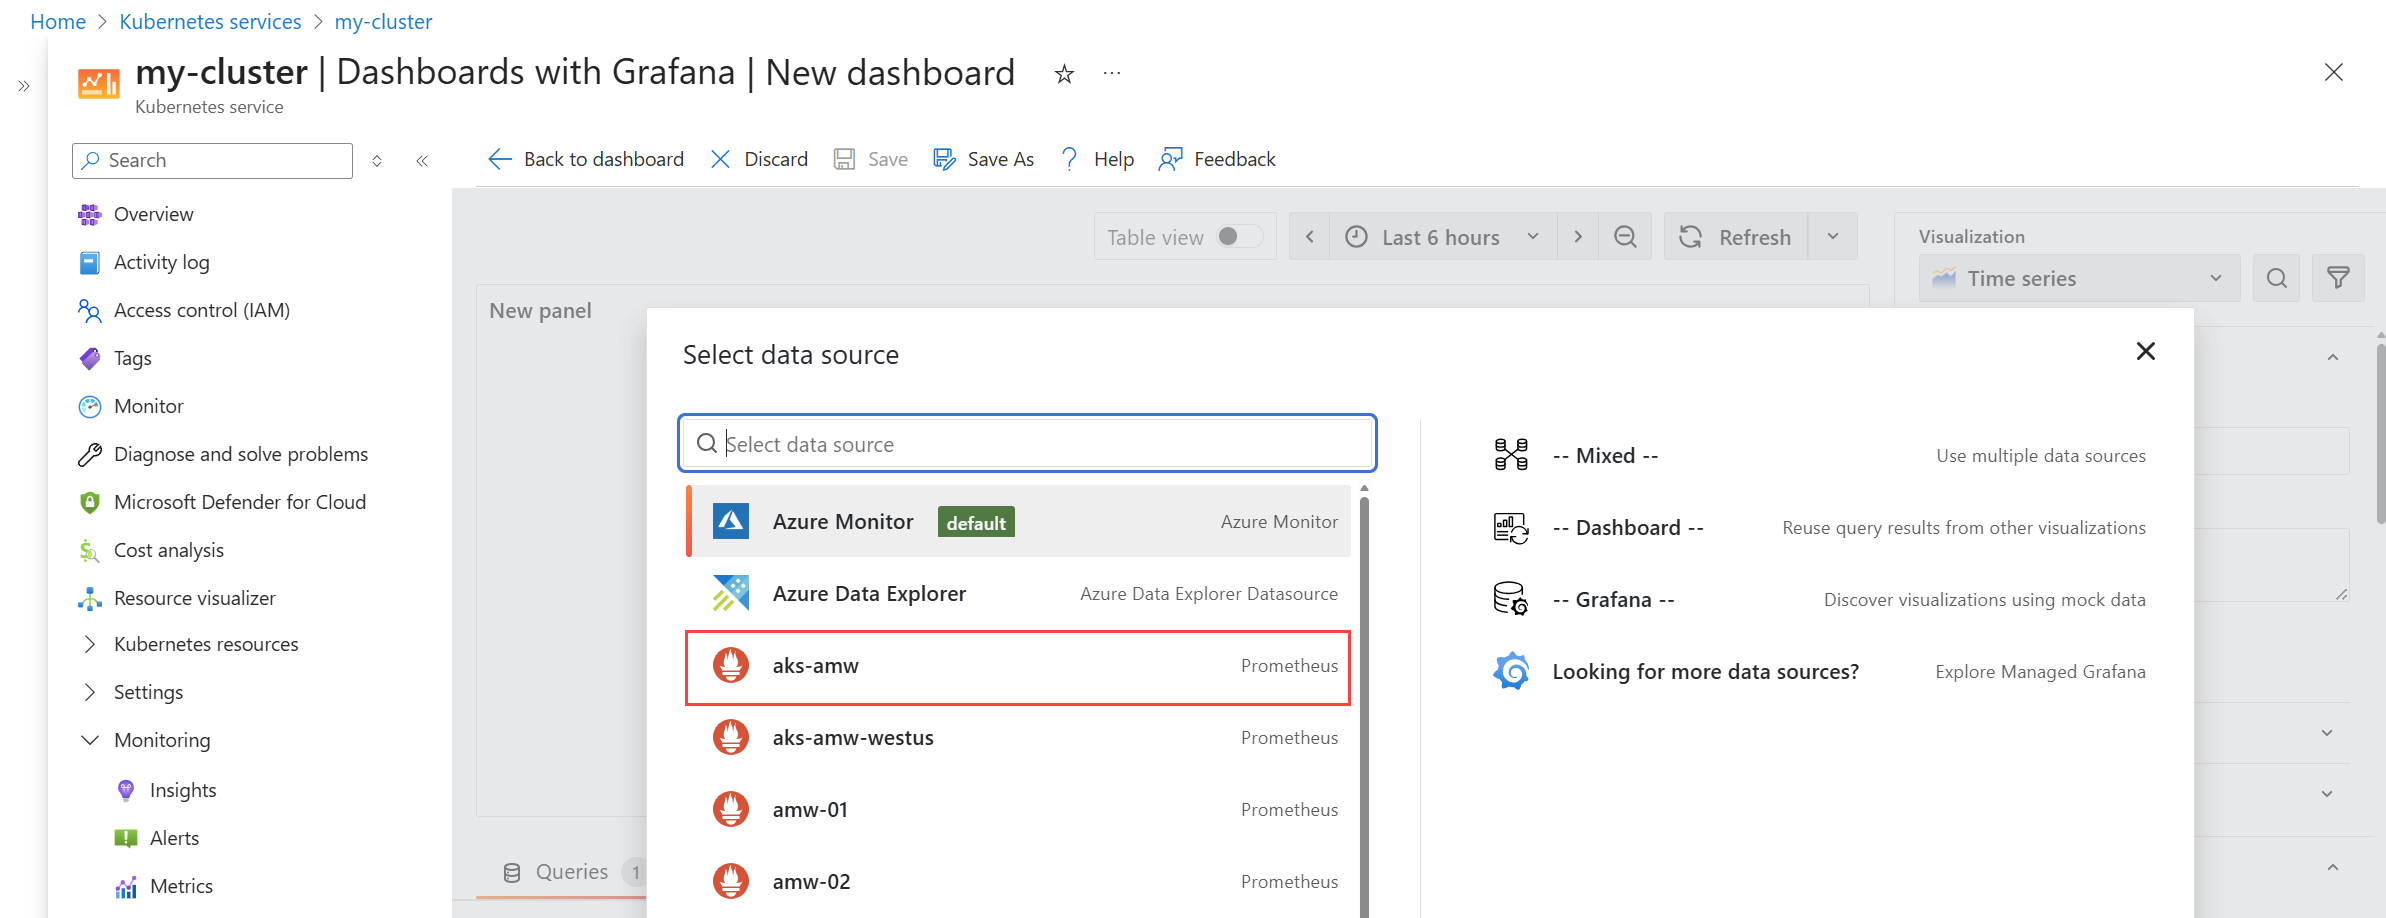
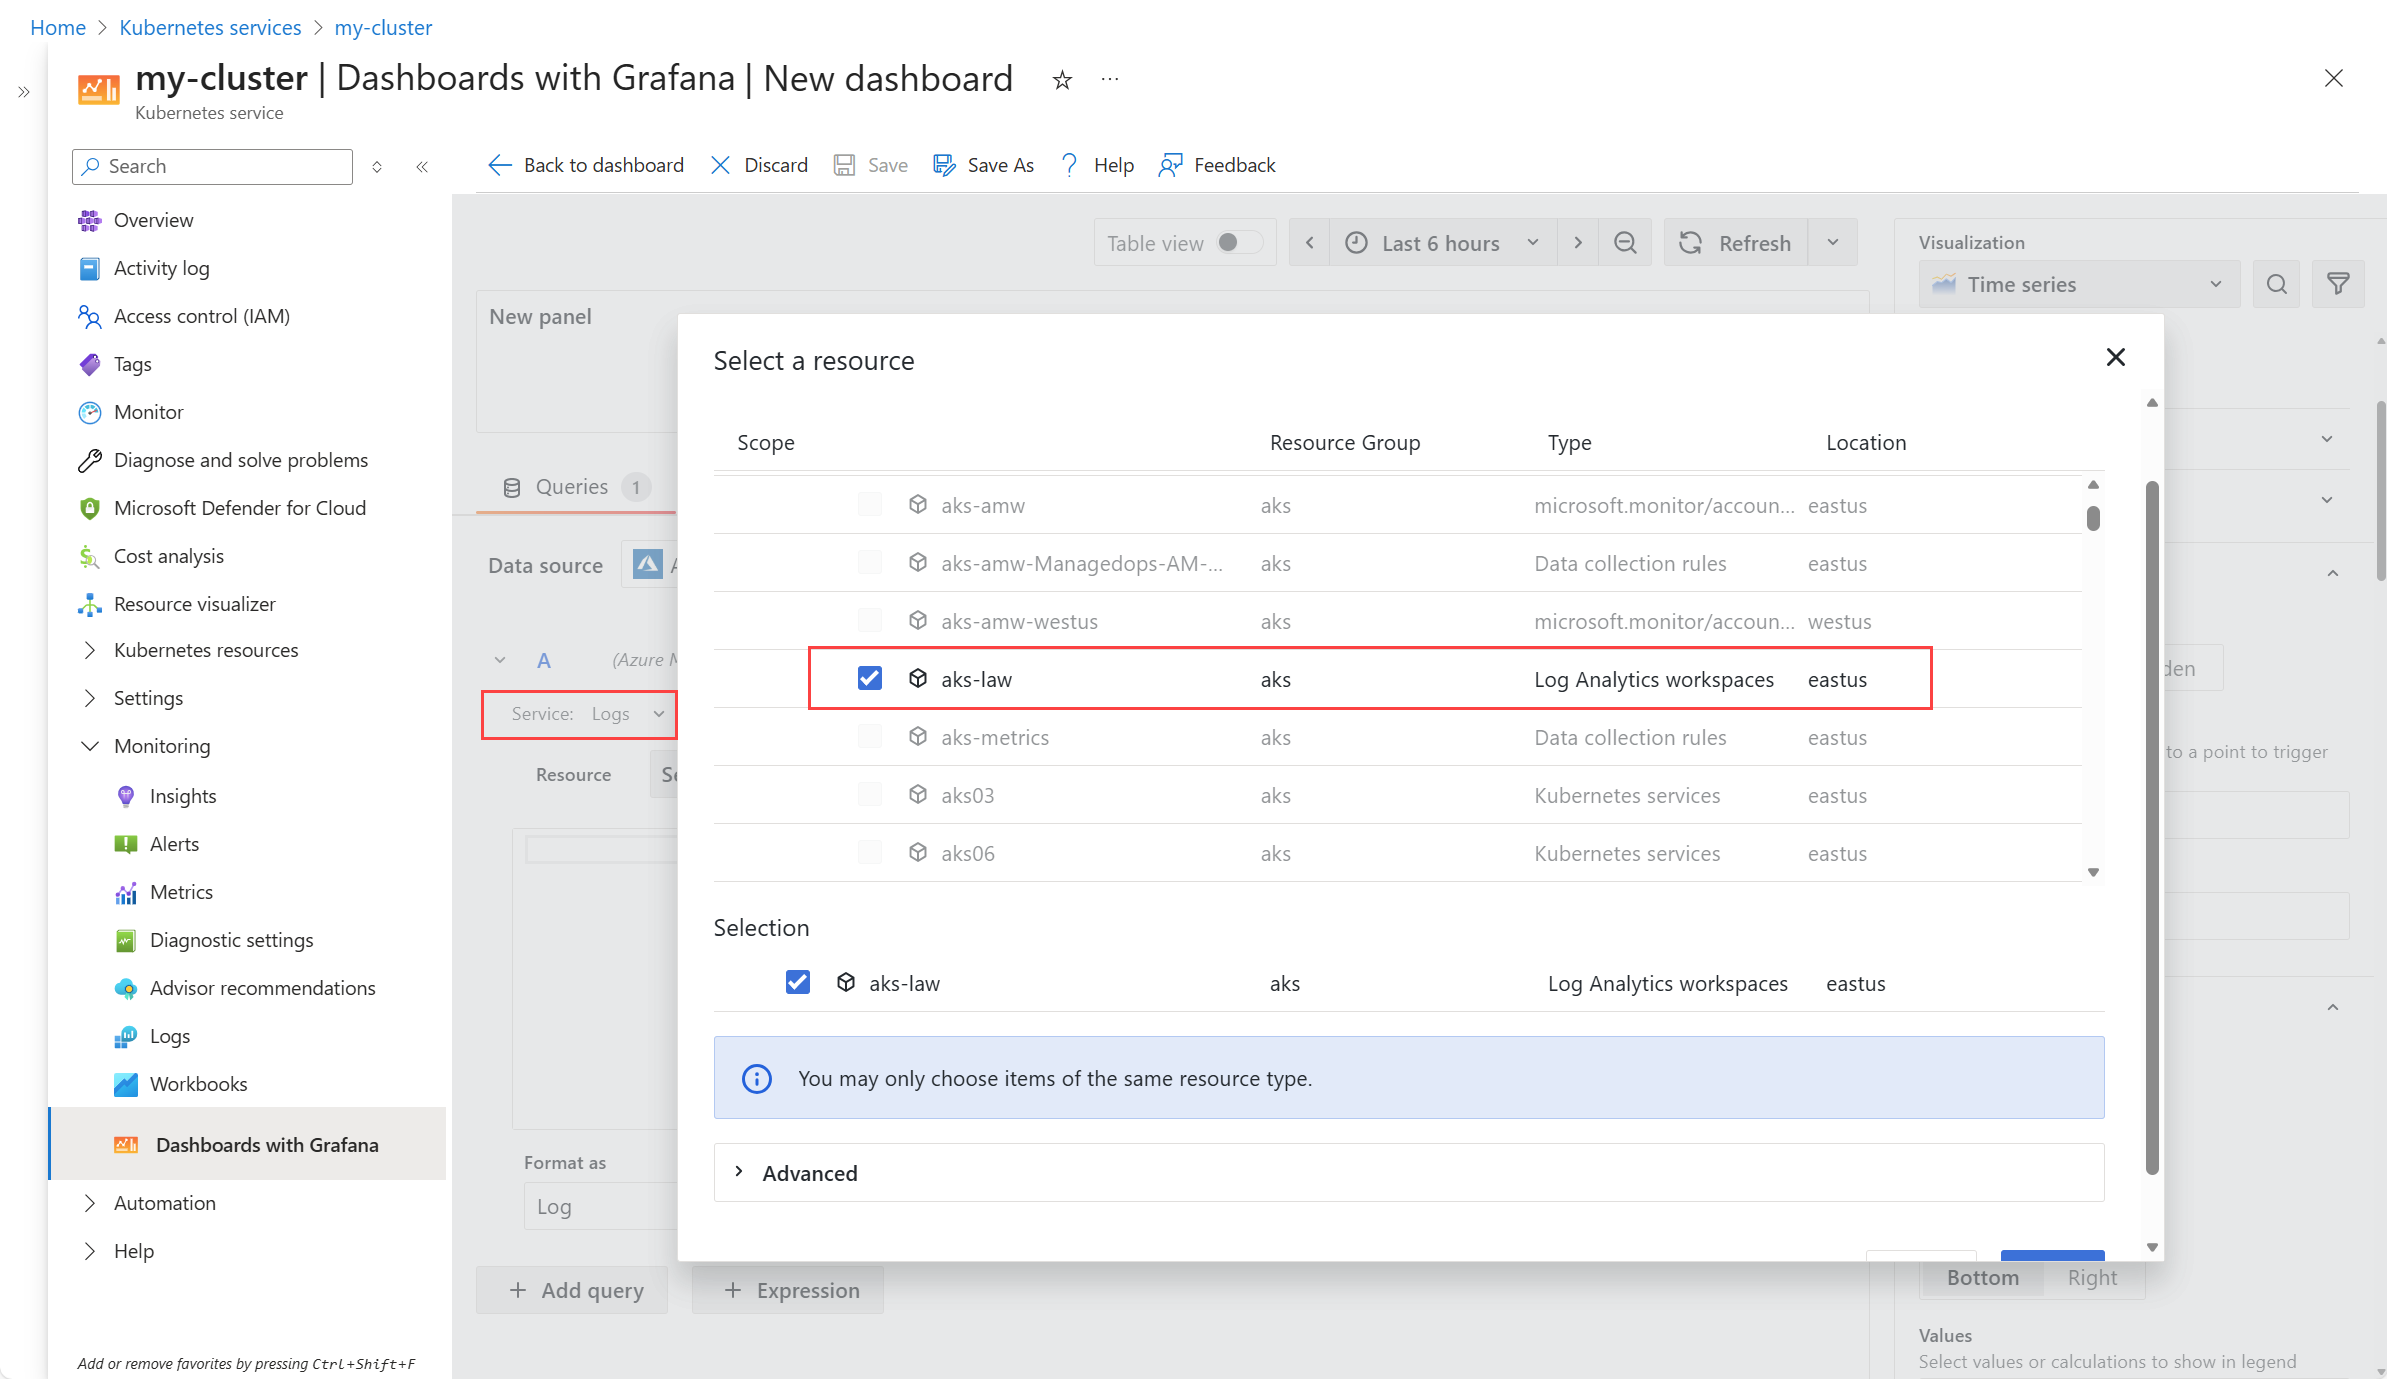
Follow the guidance at Use Azure Monitor dashboards with Grafana to create a new Grafana dashboard or edit an existing one. When you add a new visualization to the dashboard, you need to specify one of the following data sources.
For Prometheus metrics, select the Azure Monitor workspace used to collect the Prometheus metrics for the cluster.
For Container logs, select Azure Monitor. Then select Logs for the Service. Click Select a resource and select the Log Analytics workspace used to collect the container logs for the cluster.


