Note
Access to this page requires authorization. You can try signing in or changing directories.
Access to this page requires authorization. You can try changing directories.
Workbooks can extract data from these data sources:
- Logs (Analytics Tables, Application Insights)
- Logs (Basic, Auxiliary Tables)
- Metrics
- Azure Resource Graph
- Azure Resource Manager
- Azure Data Explorer
- JSON
- Merge
- Custom endpoint
- Workload health
- Azure resource health
- Azure RBAC
- Change Analysis (classic)
- Prometheus
Logs (Analytics Tables, Application Insights)
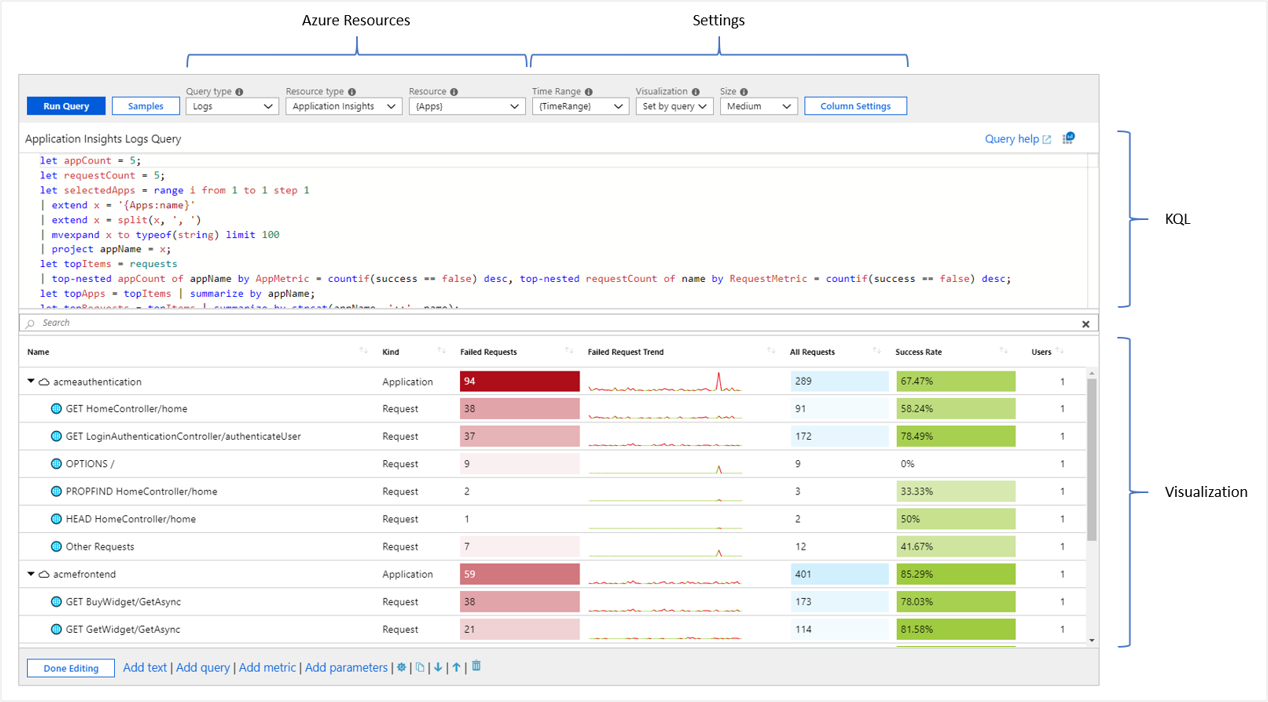
With workbooks, you can use the Logs (Analytics) data source query logs from the following sources:
- Azure Monitor Logs (Application Insights resources and Log Analytics workspaces analytics tables)
- Resource-centric data (activity logs)
You can use Kusto query language (KQL) queries that transform the underlying resource data to select a result set that can be visualized as text, charts, or grids.
You can easily query across multiple resources to create a unified rich reporting experience.
See also: Log Analytics query optimization tips
See also: Workbooks best practices and hints for logs queries
Tutorial: Making resource centric log queries in workbooks
Logs (Basic and Auxiliary Tables)
Workbooks also supports querying Log Analytics Basic and Auxiliary tables through a separate Logs (Basic) data source. Basic and Auxiliary logs tables reduce the cost of ingesting high-volume verbose logs and let you query the data they store with some limitations.
Note
Basic and Auxiliary logs and the workbook Logs (Basic) data source have limitations compared to the Log (Analytics) data source, most notably
- Extra cost, including per-query costs. See Azure Monitor pricing for details.
- Basic logs does not support the full KQL language
- Basic logs only operates on single Log Analyics Workspace, it does not have cross-resource or resource centric query support.
- Basic logs does not support "set in query" style time ranges, an explicit time range (or parameter) must be specified.
For a full list of details and limitations, see Query data in a Basic and Auxiliary table in Azure Monitor Logs
See also: Log Analytics query optimization tips
Metrics
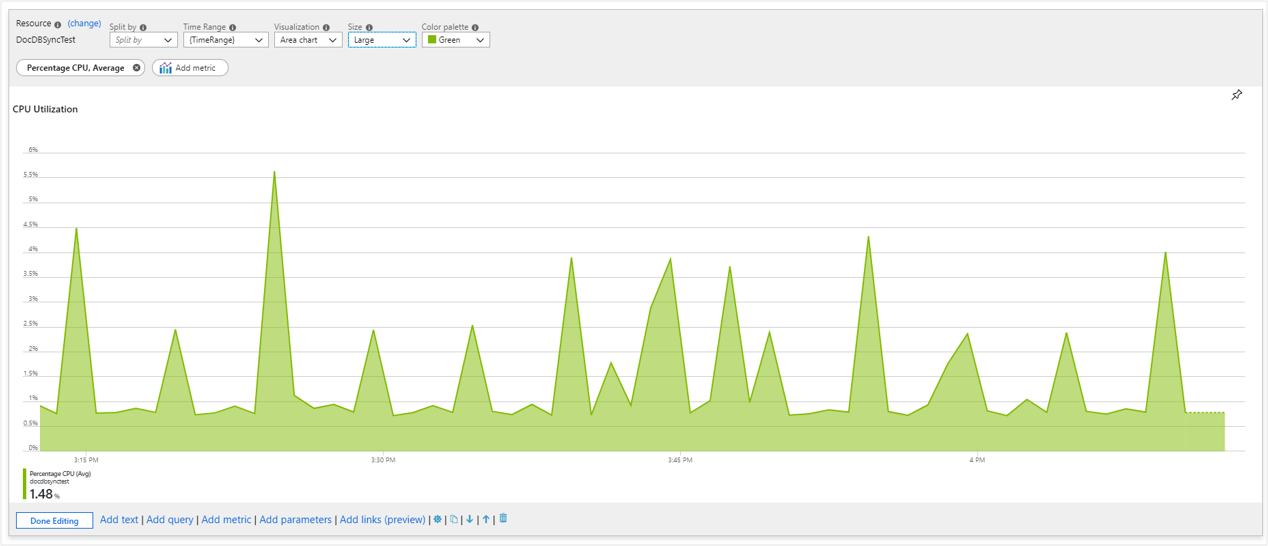
Azure resources emit metrics that can be accessed via workbooks. Metrics can be accessed in workbooks through a specialized control that allows you to specify the target resources, the desired metrics, and their aggregation. You can then plot this data in charts or grids.
Azure Resource Graph
Workbooks support querying for resources and their metadata by using Azure Resource Graph. This functionality is primarily used to build custom query scopes for reports. The resource scope is expressed via a KQL subset that Resource Graph supports, which is often sufficient for common use cases.
To make a query control that uses this data source, use the Query type dropdown and select Azure Resource Graph. Then choose at which level of data you wish to target, either Subscriptions, Management groups, or the entire Tenant/Directory. Then select the subscriptions to target. Use Query control to add the Resource Graph KQL query that selects an interesting resource subset.
Azure Resource Manager
Azure Workbooks supports Azure Resource Manager REST operations so that you can query the management.azure.com endpoint without providing your own authorization header token.
To make a query control that uses this data source, use the Data source dropdown and select Azure Resource Manager. Provide the appropriate parameters, such as Http method, url path, headers, url parameters, and body. Azure Resource Manager data source is intended to be used as a data source to power data visualizations; as such, it does not support PUT or PATCH operations. The data source supports the following HTTP methods, with these expecations and limitations:
GET- the most common operation for visualization, execute a query and parse theJSONresult using settings in the "Result Settings" tab.GETARRAY- for ARM APIs that may return multiple "pages" of results using the ARM standardnextLinkor@odata.nextLinkstyle response (See Async operations, throttling, and paging, this method makes followup calls to the API for eachnextLinkresult, and merge those results into an array of results.POST- This method is used for APIs that pass information in a POST body.
Note
The Azure Resource Manager data source only supports results that return a 200 OK response, indicating the result is synchronous. APIs returning asynchronous results with 202 ACCEPTED asynchronous result and a header with a result URL are not supported.
Azure Data Explorer
Workbooks now have support for querying from Azure Data Explorer clusters with the powerful Kusto query language. For the Cluster Name field, add the region name following the cluster name. An example is mycluster.westeurope.
See also: Azure Data Explorer query best practices
JSON
The JSON provider allows you to create a query result from static JSON content. It's most commonly used in parameters to create dropdown parameters of static values. Simple JSON arrays or objects are converted into grid rows and columns. For more specific behaviors, you can use the Results tab and JSONPath settings to configure columns.
Note
Do not include sensitive information in fields like headers, parameters, body, and URL, because they'll be visible to all the workbook users.
This provider supports JSONPath.
Merge
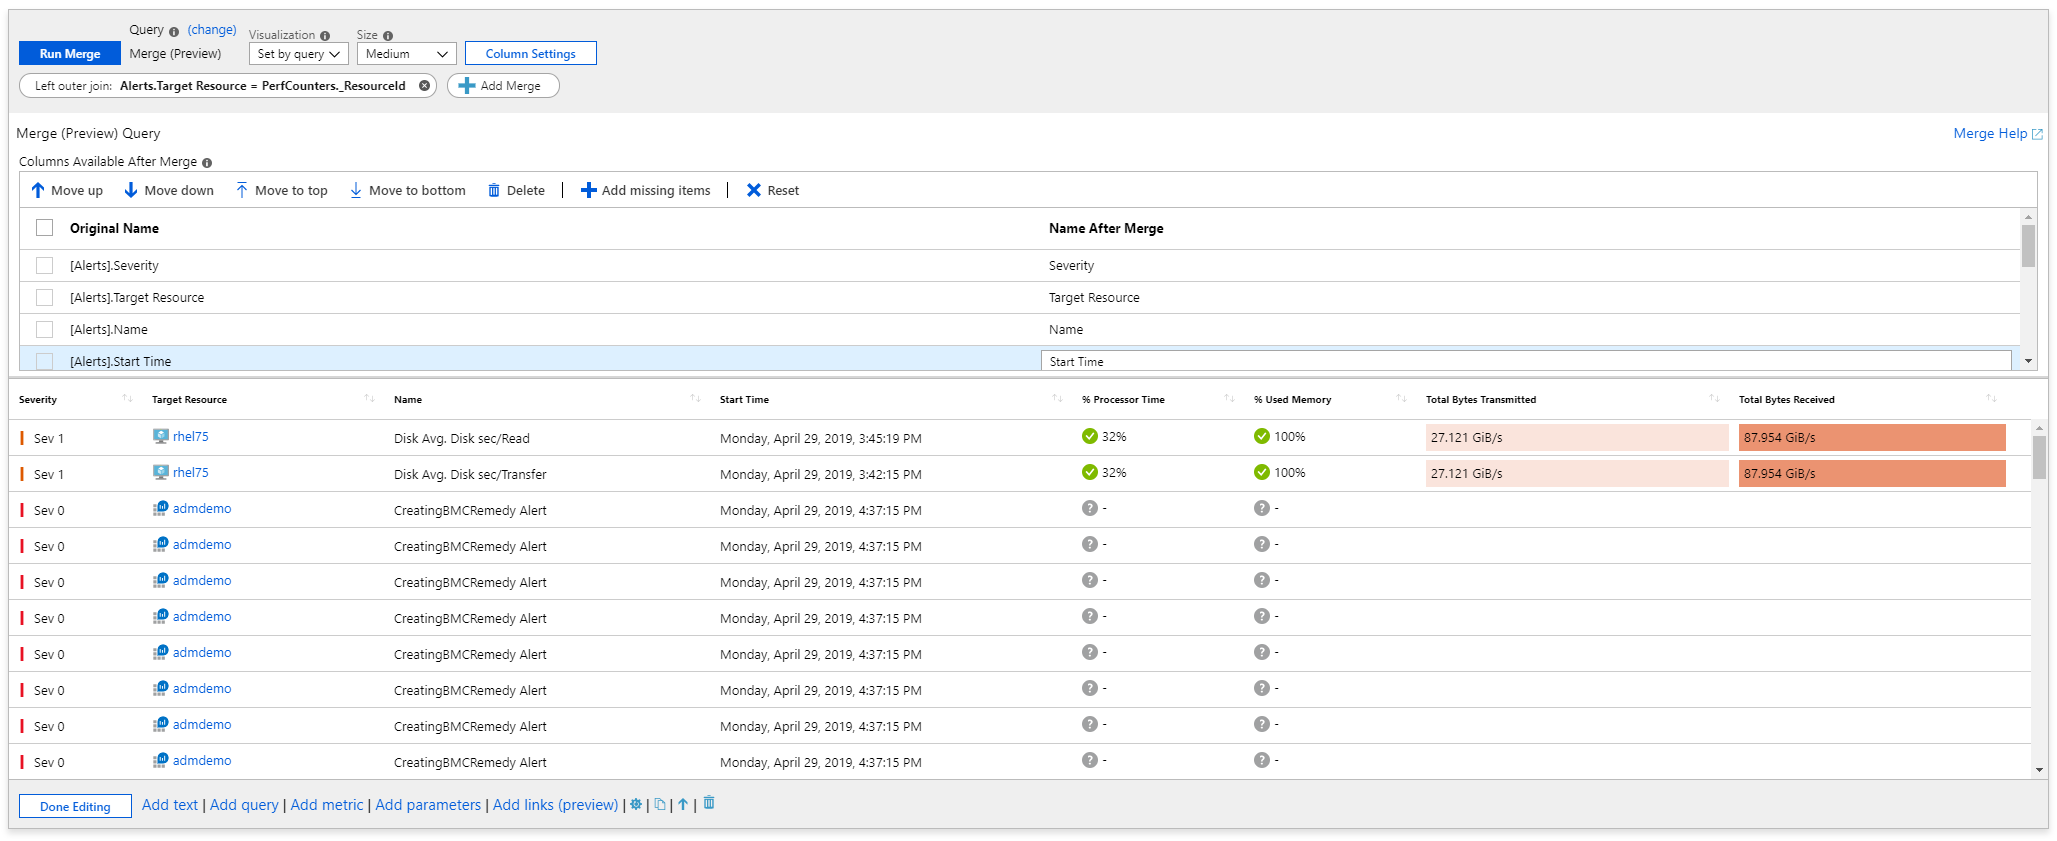
Merging data from different sources can enhance the insights experience. An example is augmenting active alert information with related metric data. Merging data allows users to see not just the effect (an active alert) but also potential causes, for example, high CPU usage. The monitoring domain has numerous such correlatable data sources that are often critical to the triage and diagnostic workflow.
With workbooks, you can query different data sources. Workbooks also provide simple controls that you can use to merge or join data to provide rich insights. The merge control is the way to achieve it. A single merge data source can do many merges in one step. For example, a single merge data source can merge results from a step using Azure Resource Graph with Azure Metrics, and then merge that result with another step using the Azure Resource Manager data source in one query item.
Note
Although hidden query and metrics steps run if they're referenced by a merge step, hidden query items that use the merge data source don't run while hidden. A step that uses merge and attempts to reference a hidden step by using merge data source won't run until that hidden step becomes visible. A single merge step can merge many data sources at once. There's rarely a case where a merge data source will reference another merge data source.
Combine alerting data with Log Analytics Virtual Machine (VM) performance data
The following example combines alerting data with Log Analytics VM performance data to get a rich insights grid.
Use merge control to combine Resource Graph and Log Analytics data
Watch this tutorial on using the merge control to combine Resource Graph and Log Analytics data:
Workbooks support these merges:
- Inner unique join
- Full inner join
- Full outer join
- Left outer join
- Right outer join
- Left semi-join
- Right semi-join
- Left anti-join
- Right anti-join
- Union
- Duplicate table
Merge examples
Using the Duplicate Table option to reuse queried data
Custom endpoint
Workbooks support getting data from any external source. If your data lives outside Azure, you can bring it to workbooks by using this data source type.
To make a query control that uses this data source, use the Data source dropdown and select Custom Endpoint. Provide the appropriate parameters, such as Http method, url, headers, url parameters, and body. Make sure your data source supports CORS. Otherwise, the request will fail.
To avoid automatically making calls to untrusted hosts when you use templates, you need to mark the used hosts as trusted. You can either select Add as trusted or add it as a trusted host in workbook settings. These settings are saved locally in browsers that support IndexDb with web workers.
This provider supports JSONPath.
Workload health
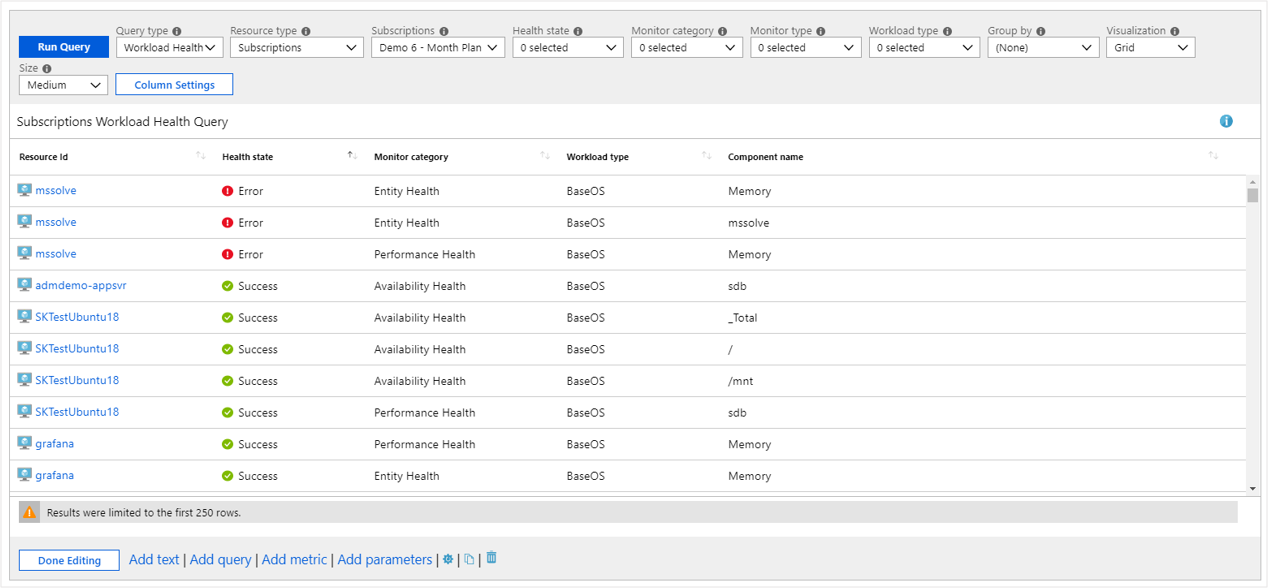
Azure Monitor has functionality that proactively monitors the availability and performance of Windows or Linux guest operating systems. Azure Monitor models key components and their relationships, criteria for how to measure the health of those components, and can alert you when an unhealthy condition is detected. With workbooks, you can use this information to create rich interactive reports.
To make a query control that uses this data source, use the Query type dropdown to select Workload Health. Then select subscription, resource group, or VM resources to target. Use the health filter dropdowns to select an interesting subset of health incidents for your analytic needs.
Azure resource health
Workbooks support getting Azure resource health and combining it with other data sources to create rich, interactive health reports.
To make a query control that uses this data source, use the Query type dropdown and select Azure health. Then select the resources to target. Use the health filter dropdowns to select an interesting subset of resource issues for your analytic needs.
Azure RBAC
The Azure role-based access control (RBAC) provider allows you to check permissions on resources. It's can be used in parameters to check if the correct RBACs are set up. A use case would be to create a parameter to check deployment permission and then notify the user if they don't have deployment permission.
Simple JSON arrays or objects are converted into grid rows and columns or text with a hasPermission column with either true or false. The permission is checked on each resource and then either or or and to get the result. The operations or actions can be a string or an array.
String:
"Microsoft.Resources/deployments/validate/action"
Array:
["Microsoft.Resources/deployments/read","Microsoft.Resources/deployments/write","Microsoft.Resources/deployments/validate/action","Microsoft.Resources/operations/read"]
Change Analysis (classic)
To make a query control that uses Change Analysis (classic) as the data source, use the Data source dropdown and select Change Analysis (classic). Then select a single resource. Changes for up to the last 14 days can be shown. Use the Level dropdown to filter between Important, Normal, and Noisy changes. This dropdown supports workbook parameters of the type drop down.
Prometheus
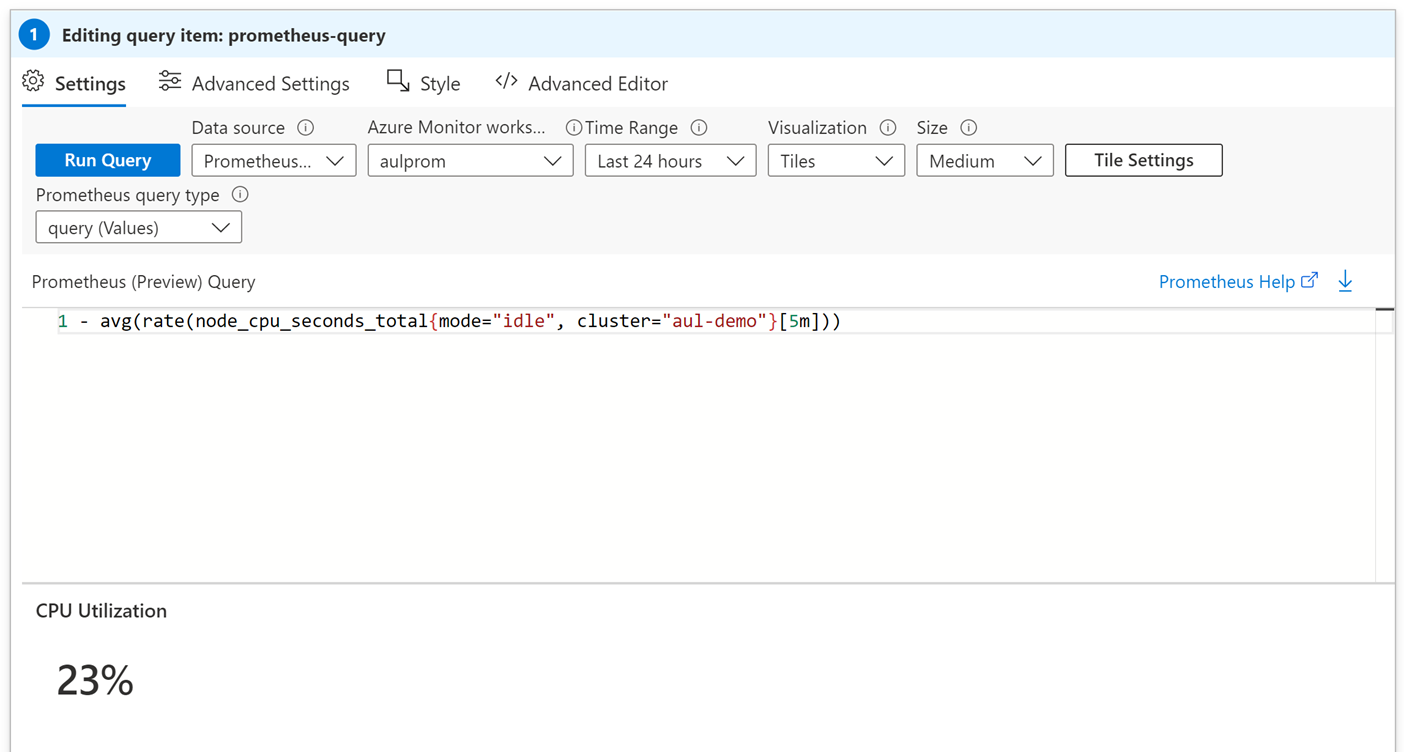
With Azure Monitor managed service for Prometheus, you can collect Prometheus metrics for your Kubernetes clusters. To query Prometheus metrics, select Prometheus from the data source dropdown, followed by where the metrics are stored in Azure Monitor workspace and the Prometheus query type for the PromQL query.
Note
Querying from an Azure Monitor workspace is a data plane action and requires an explicit role assignment of Monitoring Data Reader, which is not assigned by default Learn more about Azure control and data plane
