Use the Map feature of VM insights to understand application components
In VM insights, you can view discovered application components on Windows and Linux virtual machines (VMs) that run in Azure or your environment. You can observe the VMs in two ways. You can view a map directly from a VM. You can also view a map from Azure Monitor to see the components across groups of VMs. This article helps you to understand these two viewing methods and how to use the Map feature.
For information about configuring VM insights, see Enable VM insights.
Limitations
- If you're duplicating IP ranges either with VMs or Azure Virtual Machine Scale Sets across subnets and virtual networks, VM insights Map might display incorrect information. This issue is known. We're investigating options to improve this experience.
- The Map feature currently only supports IPv4. We're investigating support for IPv6. We also support IPv4 that's tunnelled inside IPv6.
- A map for a resource group or other large group might be difficult to view. Although we've made improvements to Map to handle large and complex configurations, we realize a map can have many nodes, connections, and nodes working as a cluster. We're committed to continuing to enhance support to increase scalability.
- In the Free pricing tier, the VM insights Map feature supports only five machines that are connected to a Log Analytics workspace.
Prerequisites
To enable the Map feature in VM insights, the virtual machine requires one of the following agents:
- Azure Monitor Agent with processes and dependencies enabled.
- The Log Analytics agent enabled for VM insights.
Important
The legacy Log Analytics agent will be deprecated by August 2024. After this date, Microsoft will no longer provide any support for the Log Analytics agent. Migrate to Azure Monitor agent before August 2024 to continue ingesting data.
For more information, see Enable VM insights on unmonitored machine.
Warning
Collecting duplicate data from a single machine with both Azure Monitor Agent and the Log Analytics agent can result in the Map feature of VM insights being inaccurate because it doesn't check for duplicate data.
Introduction to the Map experience
Before diving into the Map experience, you should understand how it presents and visualizes information.
Whether you select the Map feature directly from a VM or from Azure Monitor, the Map feature presents a consistent experience. The only difference is that from Azure Monitor, one map shows all the members of a multiple-tier application or cluster.
The Map feature visualizes the VM dependencies by discovering running processes that have:
- Active network connections between servers.
- Inbound and outbound connection latency.
- Ports across any TCP-connected architecture over a specified time range.
Expand a VM to show process details and only those processes that communicate with the VM. The client group shows the count of front-end clients that connect into the VM. The server-port groups show the count of back-end servers the VM connects to. Expand a server-port group to see the detailed list of servers that connect over that port.
When you select the VM, the Properties pane shows the VM's properties. Properties include system information reported by the operating system, properties of the Azure VM, and a doughnut chart that summarizes the discovered connections.

On the right side of the pane, select Log Events to show a list of data that the VM has sent to Azure Monitor. This data is available for querying. Select any record type to open the Logs page, where you see the results for that record type. You also see a preconfigured query that's filtered against the VM.

Close the Logs page and return to the Properties pane. There, select Alerts to view VM health-criteria alerts. The Map feature integrates with Azure alerts to show alerts for the selected server in the selected time range. The server displays an icon for current alerts, and the Machine Alerts pane lists the alerts.

To make the Map feature display relevant alerts, create an alert rule that applies to a specific computer:
- Include a clause to group alerts by computer (for example, by Computer interval 1 minute).
- Base the alert on a metric.
For more information about Azure alerts and how to create alert rules, see Unified alerts in Azure Monitor.
In the upper-right corner, the Legend option describes the symbols and roles on the map. For a closer look at your map and to move it around, use the zoom controls in the lower-right corner. You can set the zoom level and fit the map to the size of the page.
Connection metrics
The Connections pane displays standard metrics for the selected connection from the VM over the TCP port. The metrics include response time, requests per minute, traffic throughput, and links.

Failed connections
The map shows failed connections for processes and computers. A dashed red line indicates a client system is failing to reach a process or port. For systems that use the Dependency agent, the agent reports on failed connection attempts. The Map feature monitors a process by observing TCP sockets that fail to establish a connection. This failure could result from a firewall, a misconfiguration in the client or server, or an unavailable remote service.

Understanding failed connections can help you troubleshoot, validate migration, analyze security, and understand the overall architecture of the service. Failed connections are sometimes harmless, but they often point to a problem. Connections might fail, for example, when a failover environment suddenly becomes unreachable or when two application tiers can't communicate with each other after a cloud migration.
Client groups
On the map, client groups represent client machines that connect to the mapped machine. A single client group represents the clients for an individual process or machine.

To see the monitored clients and IP addresses of the systems in a client group, select the group. The contents of the group appear in the following image.

If the group includes monitored and unmonitored clients, you can select the appropriate section of the group's doughnut chart to filter the clients.
Server-port groups
Server-port groups represent ports on servers that have inbound connections from the mapped machine. The group contains the server port and a count of the number of servers that have connections to that port. Select the group to see the individual servers and connections.

If the group includes monitored and unmonitored servers, you can select the appropriate section of the group's doughnut chart to filter the servers.
View a map from a VM
To access VM insights directly from a VM:
- In the Azure portal, select Virtual Machines.
- From the list, select a VM. In the Monitoring section, select Insights.
- Select the Map tab.
The map visualizes the VM's dependencies by discovering running process groups and processes that have active network connections over a specified time range.
By default, the map shows the last 30 minutes. If you want to see how dependencies looked in the past, you can query for historical time ranges of up to one hour. To run the query, use the TimeRange selector in the upper-left corner. You might run a query, for example, during an incident or to see the status before a change.

View a map from a virtual machine scale set
To access VM insights directly from a virtual machine scale set:
- In the Azure portal, select Virtual machine scale sets.
- From the list, select a VM. Then in the Monitoring section, select Insights.
- Select the Map tab.
The map visualizes all instances in the scale set as a group node along with the group's dependencies. The expanded node lists the instances in the scale set. You can scroll through these instances 10 at a time.
To load a map for a specific instance, first select that instance on the map. Then select the ellipsis button (...) and select Load Server Map. In the map that appears, you see process groups and processes that have active network connections over a specified time range.
By default, the map shows the last 30 minutes. If you want to see how dependencies looked in the past, you can query for historical time ranges of up to one hour. To run the query, use the TimeRange selector. You might run a query, for example, during an incident or to see the status before a change.

Note
You can also access a map for a specific instance from the Instances view for your virtual machine scale set. In the Settings section, go to Instances > Insights.
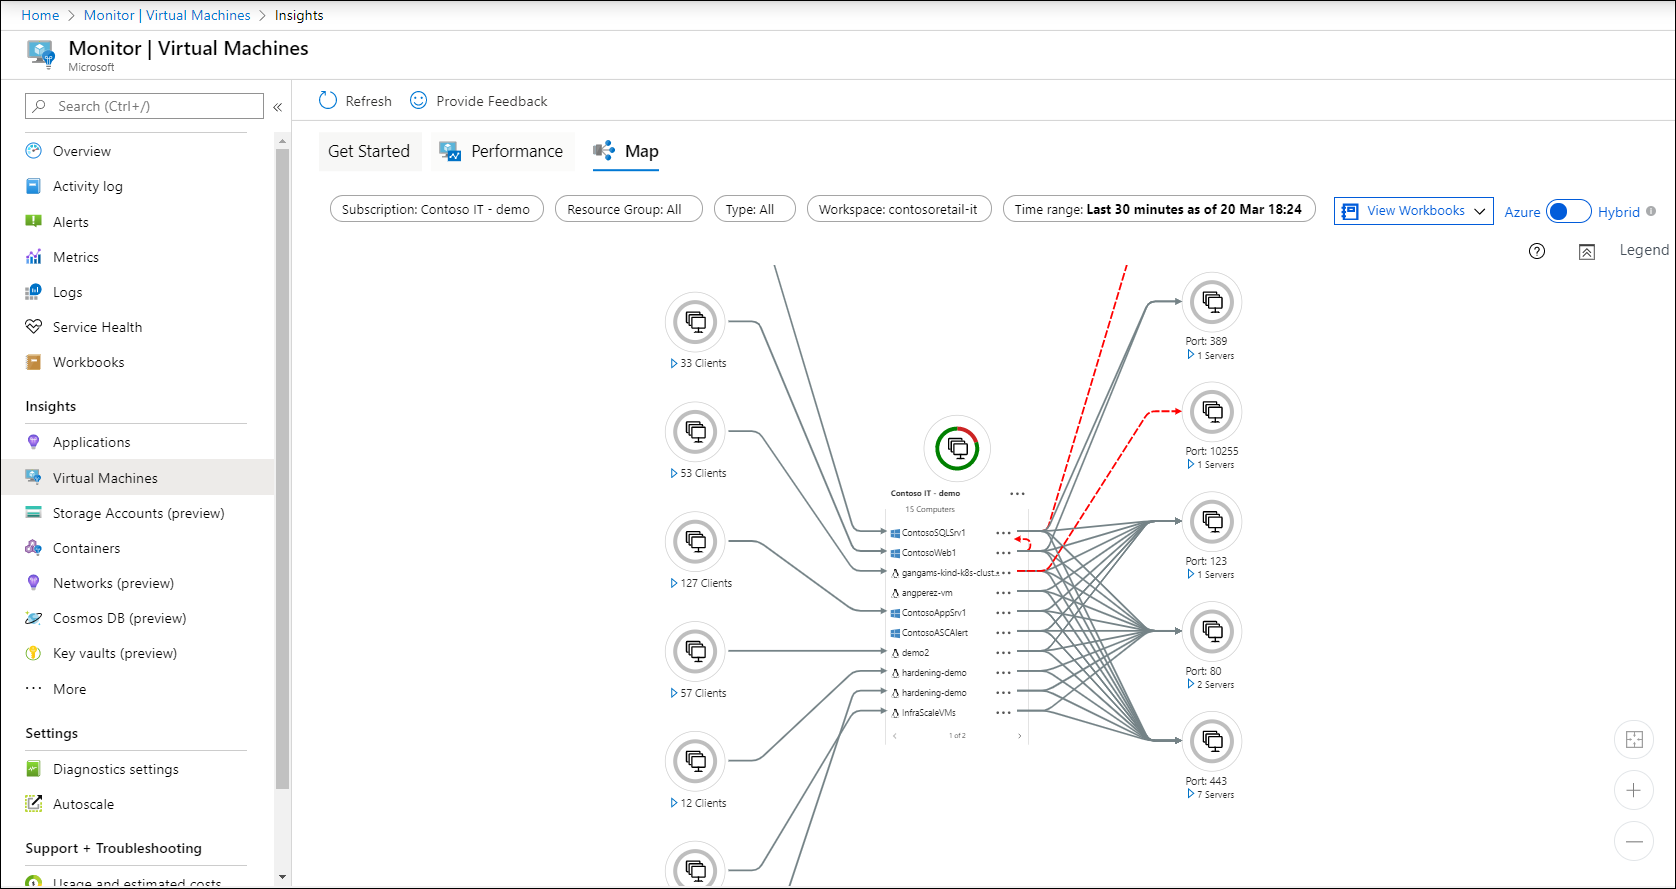
View a map from Azure Monitor
In Azure Monitor, the Map feature provides a global view of your VMs and their dependencies. To access the Map feature in Azure Monitor:
- In the Azure portal, select Monitor.
- In the Insights section, select Virtual Machines.
- Select the Map tab.

Choose a workspace by using the Workspace selector at the top of the page. If you have more than one Log Analytics workspace, choose the workspace that's enabled with the solution and that has VMs reporting to it.
The Group selector returns subscriptions, resource groups, computer groups, and virtual machine scale sets of computers that are related to the selected workspace. Your selection applies only to the Map feature and doesn't carry over to Performance or Health.
By default, the map shows the last 30 minutes. If you want to see how dependencies looked in the past, you can query for historical time ranges of up to one hour. To run the query, use the TimeRange selector. You might run a query, for example, during an incident or to see the status before a change.
Next steps
To identify bottlenecks, check performance, and understand overall utilization of your VMs, see View performance status for VM insights.
Feedback
Coming soon: Throughout 2024 we will be phasing out GitHub Issues as the feedback mechanism for content and replacing it with a new feedback system. For more information see: https://aka.ms/ContentUserFeedback.
Submit and view feedback for