How to configure monitoring and metrics for Azure Bastion using Azure Monitor
This article helps you work with monitoring and metrics for Azure Bastion using Azure Monitor.
Note
Using Classic Metrics is not recommended.
About metrics
Azure Bastion has various metrics that are available. The following table shows the category and dimensions for each available metric.
| Metric | Category | Dimension(s) |
|---|---|---|
| Bastion communication status** | Availability | N/A |
| Total memory | Availability | Instance |
| Used CPU | Traffic | Instance |
| Used memory | Traffic | Instance |
| Session count | Performance | Instance |
** Bastion communication status is only applicable for bastion hosts deployed after November 2020.
Availability metrics
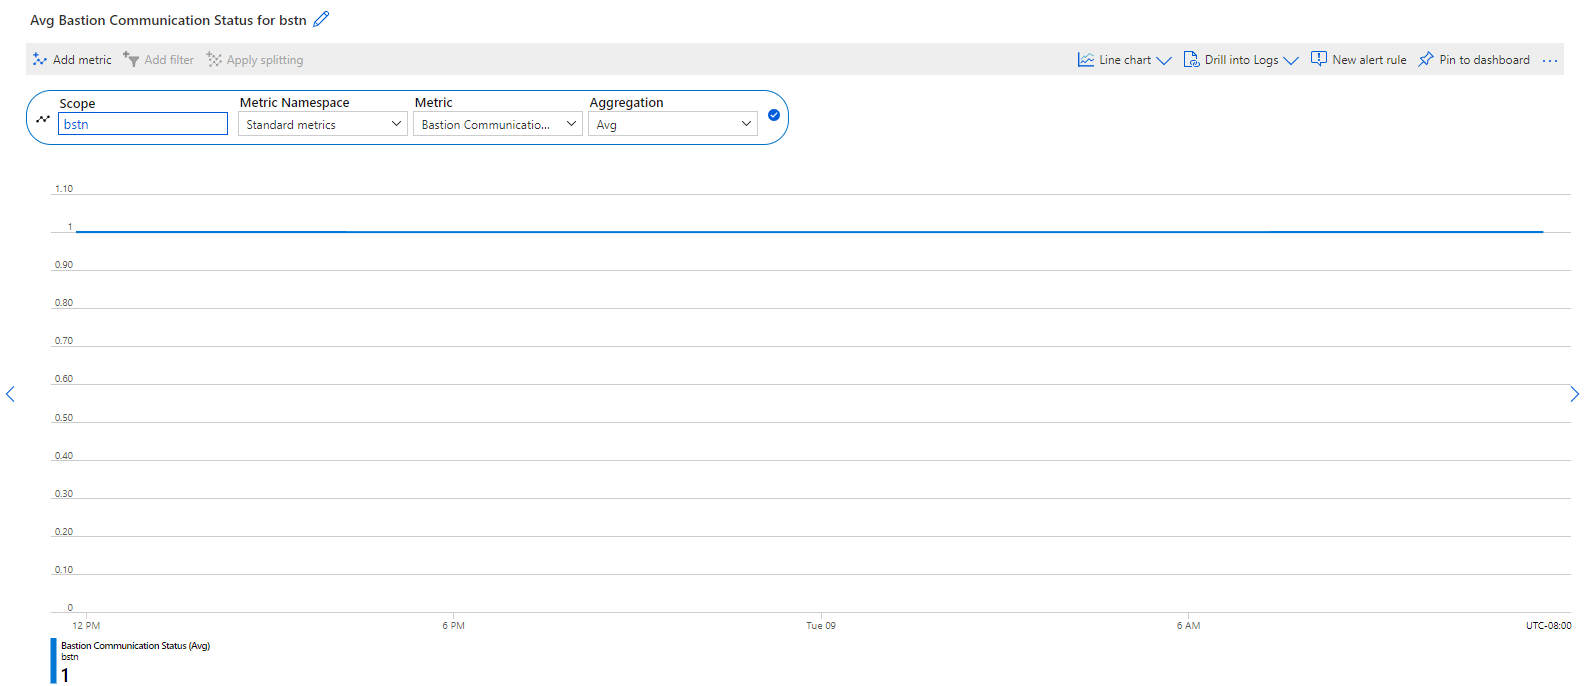
Bastion communication status
You can view the communication status of Azure Bastion, aggregated across all instances comprising the bastion host.
- A value of 1 indicates that the bastion is available.
- A value of 0 indicates that the bastion service is unavailable.
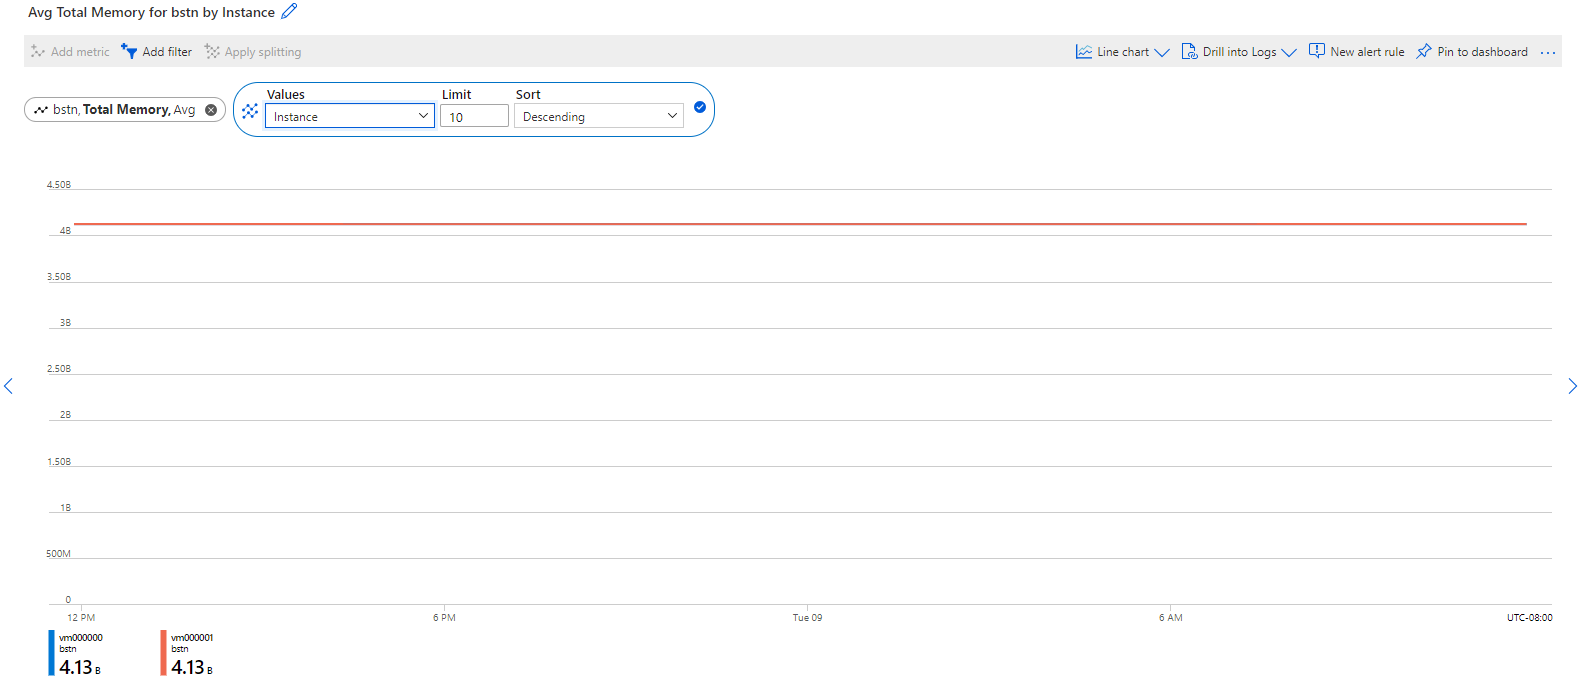
Total memory
You can view the total memory of Azure Bastion, split across each bastion instance.
Traffic metrics
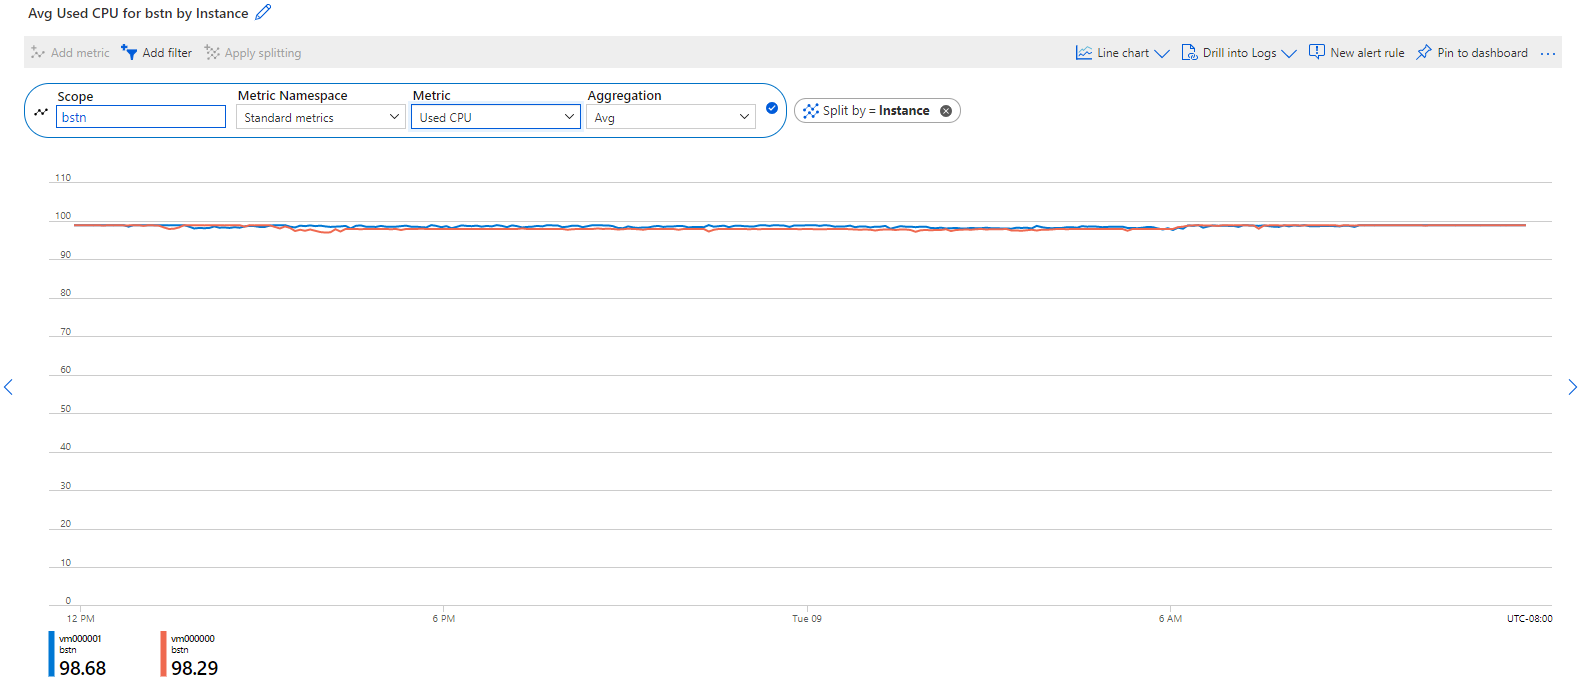
Used CPU
You can view the CPU utilization of Azure Bastion, split across each bastion instance. Monitoring this metric helps gauge the availability and capacity of the instances that comprise Azure Bastion.
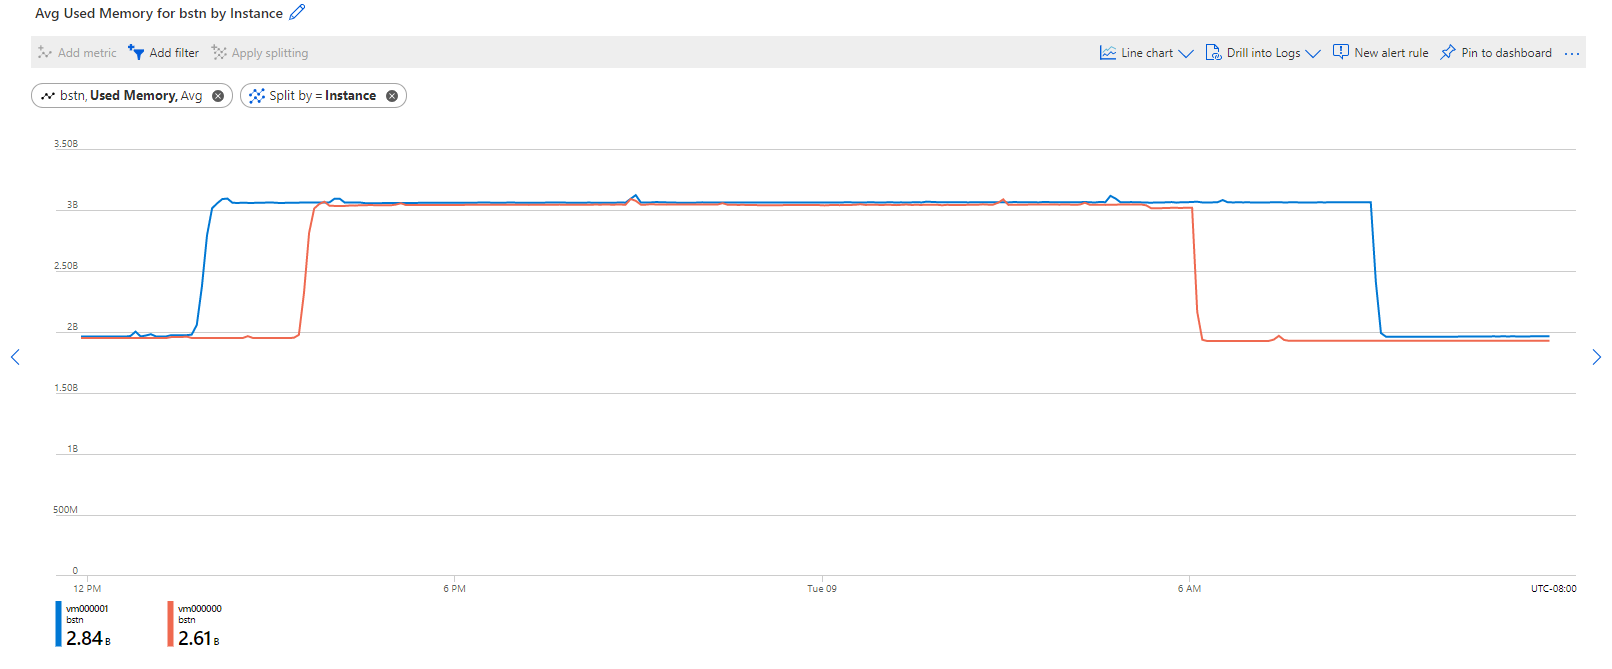
Used memory
You can view memory utilization across each bastion instance, split across each bastion instance. Monitoring this metric helps gauge the availability and capacity of the instances that comprise Azure Bastion.
Performance metrics
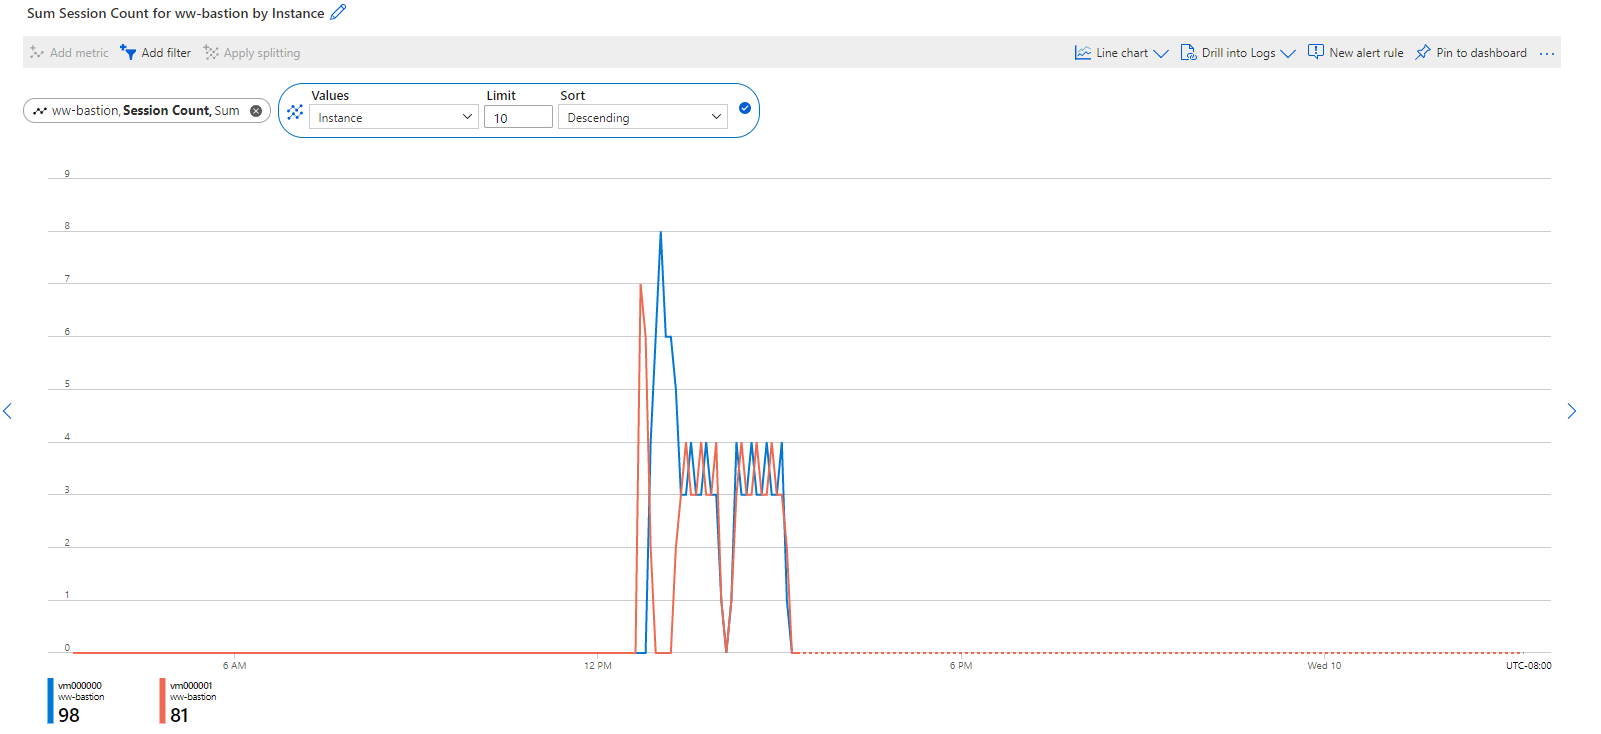
Session count
You can view the count of active sessions per bastion instance, aggregated across each session type (RDP and SSH). Each Azure Bastion can support a range of active RDP and SSH sessions. Monitoring this metric helps you to understand if you need to adjust the number of instances running the bastion service. For more information about the session count Azure Bastion can support, refer to the Azure Bastion FAQ.
The recommended values for this metric's configuration are:
- Aggregation: Avg
- Granularity: 5 or 15 minutes
- Splitting by instances is recommended to get a more accurate count
How to view metrics
To view metrics, go to your bastion host.
From the Monitoring list, select Metrics.
Select the parameters. If no metrics are set, click Add metric, and then select the parameters.
- Scope: By default, the scope is set to the bastion host.
- Metric Namespace: Standard Metrics.
- Metric: Select the metric that you want to view.
Once a metric is selected, the default aggregation will be applied. Optionally, you can apply splitting, which will show the metric with different dimensions.
Next steps
Read the Bastion FAQ.
Feedback
Coming soon: Throughout 2024 we will be phasing out GitHub Issues as the feedback mechanism for content and replacing it with a new feedback system. For more information see: https://aka.ms/ContentUserFeedback.
Submit and view feedback for