Add telemetry to your bot
APPLIES TO: SDK v4
Telemetry logging enables bot applications to send event data to telemetry services such as Application Insights. Telemetry offers insights into your bot by showing which features are used the most, detects unwanted behavior, and offers visibility into availability, performance, and usage.
This article describes how to implement telemetry in your bot using Application Insights. This article covers:
- The code required to wire up telemetry in your bot and connect to Application Insights.
- How to enable telemetry in your bot's Dialogs.
- How to enable telemetry to capture usage data from other services, like Azure AI services.
- How to visualize your telemetry data in Application Insights.
Important
For a regional bot that might collect personally identifiable information (PII) in telemetry, your Application Insights resource and your Azure Bot resource should be in the same region with the bot. If the resources are in different regions, the PII might leave the geographic region of the bot.
Prerequisites
- The CoreBot sample code
- The Application Insights sample code
- A subscription to Microsoft Azure
- An Application Insights key
- Familiarity with Application Insights
- git
Note
The Application Insights sample code was built on top of the CoreBot sample code. This article will step you through modifying the CoreBot sample code to incorporate telemetry. If you're following along in Visual Studio, you'll have the Application Insights sample code by the time you're finished.
Enable telemetry in your bot
This article starts from the CoreBot sample app and adds the code required to integrate telemetry into any bot. This will enable Application Insights to begin tracking requests.
Important
If you haven't setup your Application Insights account and created your Application Insights key, do that before proceeding.
Open the CoreBot sample app in Visual Studio.
Add the
Microsoft.Bot.Builder.Integration.ApplicationInsights.CoreNuGet package. For more information on using NuGet, see Install and manage packages in Visual Studio:Include the following statements in
Startup.cs:using Microsoft.ApplicationInsights.Extensibility; using Microsoft.Bot.Builder.ApplicationInsights; using Microsoft.Bot.Builder.Integration.ApplicationInsights.Core; using Microsoft.Bot.Builder.Integration.AspNet.Core;Tip
If you're following along by updating the CoreBot sample code, you'll notice that the using statement for
Microsoft.Bot.Builder.Integration.AspNet.Corealready exists in the CoreBot sample.Include the following code in the
ConfigureServices()method inStartup.cs. This will make telemetry services available to your bot via dependency injection (DI):// This method gets called by the runtime. Use this method to add services to the container. public void ConfigureServices(IServiceCollection services) { ... // Create the Bot Framework Adapter with error handling enabled. services.AddSingleton<IBotFrameworkHttpAdapter, AdapterWithErrorHandler>(); // Add Application Insights services into service collection services.AddApplicationInsightsTelemetry(); // Create the telemetry client. services.AddSingleton<IBotTelemetryClient, BotTelemetryClient>(); // Add telemetry initializer that will set the correlation context for all telemetry items. services.AddSingleton<ITelemetryInitializer, OperationCorrelationTelemetryInitializer>(); // Add telemetry initializer that sets the user ID and session ID (in addition to other bot-specific properties such as activity ID) services.AddSingleton<ITelemetryInitializer, TelemetryBotIdInitializer>(); // Create the telemetry middleware to initialize telemetry gathering services.AddSingleton<TelemetryInitializerMiddleware>(); // Create the telemetry middleware (used by the telemetry initializer) to track conversation events services.AddSingleton<TelemetryLoggerMiddleware>(); ... }Tip
If you're following along by updating the CoreBot sample code, you'll notice that
services.AddSingleton<IBotFrameworkHttpAdapter, AdapterWithErrorHandler>();already exists.Instruct the adapter to use the middleware code that was added to the
ConfigureServices()method. You do this inAdapterWithErrorHandler.cswith the parameter TelemetryInitializerMiddleware telemetryInitializerMiddleware in the constructor's parameter list, and theUse(telemetryInitializerMiddleware);statement in the constructor as shown here:public AdapterWithErrorHandler(IConfiguration configuration, ILogger<BotFrameworkHttpAdapter> logger, TelemetryInitializerMiddleware telemetryInitializerMiddleware, ConversationState conversationState = null) : base(configuration, logger) { ... Use(telemetryInitializerMiddleware); }You'll also need to add
Microsoft.Bot.Builder.Integration.ApplicationInsights.Coreto your list of using statements inAdapterWithErrorHandler.cs.Add the Application Insights instrumentation key in your
appsettings.jsonfile. Theappsettings.jsonfile contains metadata about external services the bot uses while running. For example, Cosmos DB, Application Insights, and Azure AI services connection and metadata is stored there. The addition to yourappsettings.jsonfile must be in this format:{ "MicrosoftAppId": "", "MicrosoftAppPassword": "", "ApplicationInsights": { "InstrumentationKey": "xxxxxxxx-xxxx-xxxx-xxxx-xxxxxxxxxxxx" } }Note
Details on getting the Application Insights instrumentation key can be found in the article Application Insights keys.
At this point, the preliminary work to enable telemetry using Application Insights is done. You can run your bot locally using the Emulator and then go into Application Insights to see what is being logged, such as response time, overall app health, and general running information.
Enable telemetry in your bot's dialogs
When adding a new dialog to any ComponentDialog, it will inherit the Microsoft.Bot.Builder.IBotTelemetryClient of its parent dialog. For example, in the CoreBot sample application, all dialogs are added to the MainDialog, which is a ComponentDialog. Once you set the TelemetryClient property to the MainDialog, all dialogs added to it will automatically inherit the telemetryClient from it, so it doesn't need to be explicitly set when adding dialogs.
Follow the steps below to update your CoreBot example:
In
MainDialog.cs, update the constructor's parameter list to include theIBotTelemetryClientparameter, then set the MainDialog's TelemetryClient property to that value as shown in the following code snippet:public MainDialog(IConfiguration configuration, ILogger<MainDialog> logger, IBotTelemetryClient telemetryClient) : base(nameof(MainDialog)) { // Set the telemetry client for this and all child dialogs. this.TelemetryClient = telemetryClient; ... }
Tip
If you're following along and updating the CoreBot sample code, you can refer to the Application Insights sample code if you run into any problems.
Telemetry is now added to your bot dialogs. If you run your bot now, you should see things being logged in Application Insights; however, if you have any integrated technology such as an Azure AI service, you'll need to add the TelemetryClient to that code as well.
Enable or disable activity event and personal information logging
Enable or disable activity logging
By default, the TelemetryInitializerMiddleware will use the TelemetryLoggerMiddleware to log telemetry when your bot sends / receives activities. Activity logging creates custom event logs in your Application Insights resource. If you wish, you can disable activity event logging by setting logActivityTelemetry to false on the TelemetryInitializerMiddleware when registering it in Startup.cs.
public void ConfigureServices(IServiceCollection services)
{
    ...
    // Add the telemetry initializer middleware
    services.AddSingleton<TelemetryInitializerMiddleware>(sp =>
            {
                var loggerMiddleware = sp.GetService<TelemetryLoggerMiddleware>();
                return new TelemetryInitializerMiddleware(loggerMiddleware, logActivityTelemetry: false);
            });
    ...
}
Enable or disable personal information logging
By default, if activity logging is enabled, some properties on the incoming / outgoing activities are excluded from logging as they're likely to contain personal information, such as user name and the activity text. You can choose to include these properties in your logging by making the following change to Startup.cs when registering the TelemetryLoggerMiddleware.
public void ConfigureServices(IServiceCollection services)
{
    ...
    // Add the telemetry initializer middleware
    services.AddSingleton<TelemetryLoggerMiddleware>(sp =>
            {
                var telemetryClient = sp.GetService<IBotTelemetryClient>();
                return new TelemetryLoggerMiddleware(telemetryClient, logPersonalInformation: true);
            });
    ...
}
Next we'll see what needs to be included to add telemetry functionality to the dialogs. This will enable you to get additional information such as what dialogs run, and statistics about each one.
Enabling telemetry to capture usage data from other services like LUIS and QnA Maker
Note
Azure AI QnA Maker will be retired on 31 March 2025. Beginning 1 October 2022, you won't be able to create new QnA Maker resources or knowledge bases. A newer version of the question and answering capability is now available as part of Azure AI Language.
Custom question answering, a feature of Azure AI Language, is the updated version of the QnA Maker service. For more information about question-and-answer support in the Bot Framework SDK, see Natural language understanding.
Note
Language Understanding (LUIS) will be retired on 1 October 2025. Beginning 1 April 2023, you won't be able to create new LUIS resources. A newer version of language understanding is now available as part of Azure AI Language.
Conversational language understanding (CLU), a feature of Azure AI Language, is the updated version of LUIS. For more information about language understanding support in the Bot Framework SDK, see Natural language understanding.
We'll next implement telemetry functionality in your LUIS service. The LUIS service has built-in telemetry logging available so there's little you need to do to start getting telemetry data from LUIS. If you're interested in enabling telemetry in a QnA Maker enabled bot, see Add telemetry to your QnA Maker bot
The
IBotTelemetryClient telemetryClientparameter is required in theFlightBookingRecognizerconstructor inFlightBookingRecognizer.cs:public FlightBookingRecognizer(IConfiguration configuration, IBotTelemetryClient telemetryClient)Next, enable the
telemetryClientwhen you create yourLuisRecognizerin theFlightBookingRecognizerconstructor. Do this by adding thetelemetryClientas a new LuisRecognizerOption:if (luisIsConfigured) { var luisApplication = new LuisApplication( configuration["LuisAppId"], configuration["LuisAPIKey"], "https://" + configuration["LuisAPIHostName"]); // Set the recognizer options depending on which endpoint version you want to use. var recognizerOptions = new LuisRecognizerOptionsV3(luisApplication) { TelemetryClient = telemetryClient, }; _recognizer = new LuisRecognizer(recognizerOptions); }
That's it, you should have a functional bot that logs telemetry data into Application insights. You can use the Bot Framework Emulator to run your bot locally. You shouldn't see any changes in the bot's behavior, but it will be logging information into Application Insights. Interact with the bot by sending multiple messages and in the next section we'll review the telemetry results in Application Insights.
For information on testing and debugging your bot, you can refer to the following articles:
Visualizing your telemetry data in Application Insights
Application Insights monitors the availability, performance, and usage of your bot application whether it's hosted in the cloud or on-premises. It uses the powerful data analysis platform in Azure Monitor to provide you with deep insights into your application's operations and diagnose errors without waiting for a user to report them. There are a few ways to see the telemetry data collected by Application Insights, two of the primary ways are through queries and the dashboard.
Querying your telemetry data in Application Insights using Kusto Queries
Use this section as a starting point to learn how to use log queries in Application Insights. It demonstrates two useful queries and provides links to other documentation with additional information.
To query your data
Go to the Azure portal
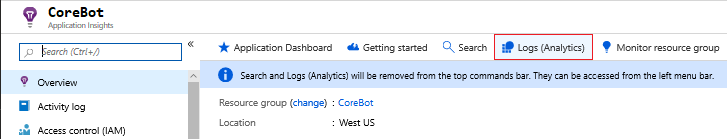
To go to your Application Insights page, select Monitor, then Applications, and find it there.
Once in your Application Insights, select Logs (Analytics).
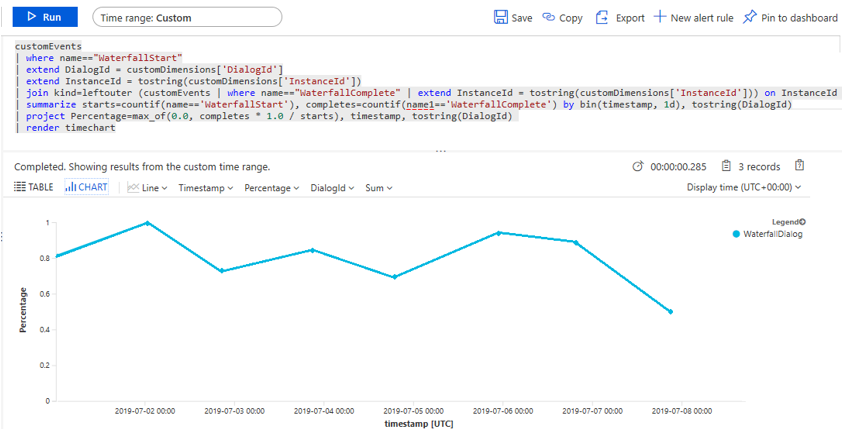
This will bring up the Query window. Enter the following query and select Run:
customEvents
| where name=="WaterfallStart"
| extend DialogId = customDimensions['DialogId']
| extend InstanceId = tostring(customDimensions['InstanceId'])
| join kind=leftouter (customEvents | where name=="WaterfallComplete" | extend InstanceId = tostring(customDimensions['InstanceId'])) on InstanceId
| summarize starts=countif(name=='WaterfallStart'), completes=countif(name1=='WaterfallComplete') by bin(timestamp, 1d), tostring(DialogId)
| project Percentage=max_of(0.0, completes * 1.0 / starts), timestamp, tostring(DialogId)
| render timechart
This will return the percentage of waterfall dialogs that run to completion.
Tip
You can pin any query to your Application Insights dashboard by selecting the button on the top right of the Logs (Analytics) blade. Just select the dashboard you want it pinned to, and it will be available next time you visit that dashboard.
The Application Insights dashboard
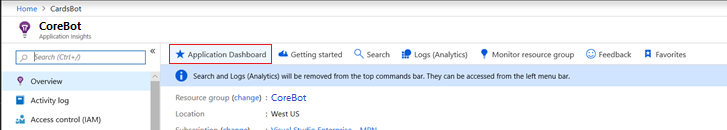
Anytime you create an Application Insights resource in Azure, a new dashboard will automatically be created and associated with it. You can see that dashboard by selecting the button at the top of your Application Insights blade, labeled Application Dashboard.
Alternatively, to view the data, go to the Azure portal. Select Dashboard on the left, then select the dashboard you want from the drop-down.
There, you'll see some default information about your bot performance and any additional queries that you've pinned to your dashboard.