Debug a bot with inspection middleware
APPLIES TO: SDK v4
This article describes how to debug a bot using inspection middleware. This feature allows the Bot Framework Emulator to debug traffic into and out of the bot, and to see the current state of the bot. You can use a trace message to send data to the Emulator and then inspect the state of your bot in any given turn of the conversation.
We use an EchoBot built locally using the Bot Framework v4 in the Create a bot quickstart to show how to debug and inspect the bot's message state. You can also Debug a bot using IDE or Debug with the Bot Framework Emulator, but to debug state you need to add inspection middleware to your bot. The inspection bot samples are available for C#, JavaScript, Java, and Python.
Note
The Bot Framework JavaScript, C#, and Python SDKs will continue to be supported, however, the Java SDK is being retired with final long-term support ending in November 2023.
Existing bots built with the Java SDK will continue to function.
For new bot building, consider using Microsoft Copilot Studio and read about choosing the right copilot solution.
For more information, see The future of bot building.
Prerequisites
- Knowledge of bot Middleware and Managing state
- Knowledge of how to Debug an SDK-first bot and Test and debug with the Emulator
- An install of the Bot Framework Emulator
- An install Dev Tunnel (if you want to debug a bot configured in Azure to use other channels)
- A copy of the inspection bot sample for C#, JavaScript, Java, or Python
Update your Emulator to the latest version
Before using bot inspection middleware to debug your bot, update your Emulator to version 4.15 or later. Check the latest version for updates.
To check the version of your Emulator, select Help, then About in the menu. You'll see the current version of your Emulator.
Update your bot code
The inspection state and inspection middleware are configured in the Startup.cs file and then used by the adapter.
Startup.cs
});

services.AddSingleton<ConversationState>();

// Create the Bot Framework Authentication to be used with the Bot Adapter.
AdapterWithInspection.cs
{
    public class AdapterWithInspection : CloudAdapter
    {
        public AdapterWithInspection(BotFrameworkAuthentication auth, IConfiguration configuration, InspectionState inspectionState, UserState userState, ConversationState conversationState, ILogger<IBotFrameworkHttpAdapter> logger)
            : base(auth, logger)
        {
            // Inspection needs credentials because it will be sending the Activities and User and Conversation State to the emulator
            var credentials = new MicrosoftAppCredentials(configuration["MicrosoftAppId"], configuration["MicrosoftAppPassword"]);

            Use(new InspectionMiddleware(inspectionState, userState, conversationState, credentials));

            OnTurnError = async (turnContext, exception) =>
            {
                // Log any leaked exception from the application.
                logger.LogError(exception, $"[OnTurnError] unhandled error : {exception.Message}");

                // Send a message to the user
                await turnContext.SendActivityAsync("The bot encountered an error or bug.");
                await turnContext.SendActivityAsync("To continue to run this bot, please fix the bot source code.");

                // Send a trace activity, which will be displayed in the Bot Framework Emulator
                await turnContext.TraceActivityAsync("OnTurnError Trace", exception.Message, "https://www.botframework.com/schemas/error", "TurnError");
            };
        }
Update the bot class in the EchoBot.cs file.
EchoBot.cs
protected override async Task OnMessageActivityAsync(ITurnContext<IMessageActivity> turnContext, CancellationToken cancellationToken)
{
    var conversationStateProp = _conversationState.CreateProperty<CustomState>("customState");
    var convProp = await conversationStateProp.GetAsync(turnContext, () => new CustomState { Value = 0 }, cancellationToken);

    var userStateProp = _userState.CreateProperty<CustomState>("customState");
    var userProp = await userStateProp.GetAsync(turnContext, () => new CustomState { Value = 0 }, cancellationToken);

    await turnContext.SendActivityAsync(MessageFactory.Text($"Echo: {turnContext.Activity.Text} conversation state: {convProp.Value} user state: {userProp.Value}"), cancellationToken);

    convProp.Value++;
    userProp.Value++;
}
Test your bot locally
After updating the code, you can run your bot locally and test the debugging feature using two Emulators: one to send and receive messages, and the other to inspect the state of messages in debugging mode. To test your bot locally:
Go to your bot's directory in a terminal and execute the following command to run your bot locally:
dotnet runOpen your Emulator. Select Open Bot. Fill in the Bot URL with
http://localhost:3978/api/messagesand the MicrosoftAppId and MicrosoftAppPassword values. If you have a JavaScript bot, you can find these values in your bot's .env file. If you have a C# bot, you can find these values in the appsettings.json file. For a Java bot you can find these values in the application.properties file. Select Connect.Now open another Emulator window. This second Emulator window will work as a debugger. Follow the instructions as described in the previous step. Check Open in debug mode and then select Connect.
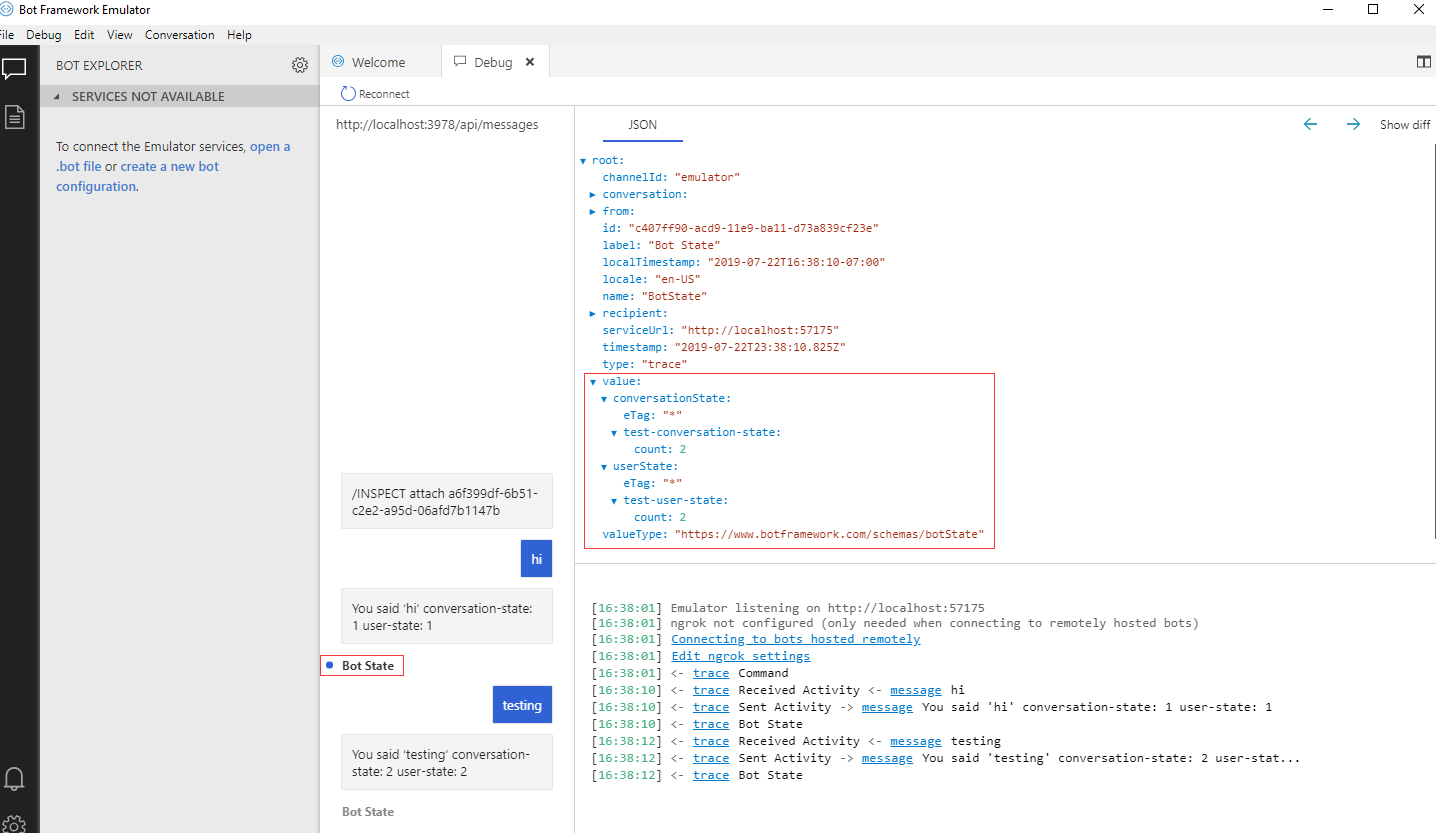
At this point you'll see a command with a unique identifier (
/INSPECT attach <identifier>) in your debugging Emulator. Copy the whole command with the identifier from the debugging Emulator and paste it into the chat box of the first Emulator.Note
A unique identifier is generated every time when the Emulator is launched in debug mode after you add the inspection middleware in your bot's code.
Now you can send messages in the chat box of your first Emulator and inspect the messages in the debugging Emulator. To inspect the state of the messages, select Bot State in the debugging Emulator and unfold values on the right JSON window. You'll see the state of your bot in the debugging Emulator:
Inspect the state of a bot configured in Azure
If you want to inspect the state of your bot configured in Azure and connected to channels (like Teams) you'll need to install and run Dev Tunnels.
Run devtunnel
At this point, you've updated your Emulator to the latest version and added the inspection middleware in your bot's code. The next step is to run devtunnel and configure your local bot. Before running devtunnel you need to run your bot locally.
To run your bot locally:
Go to your bot's folder in a terminal and set your npm registration to use the latest builds
Run your bot locally. You'll see your bot expose a port number like
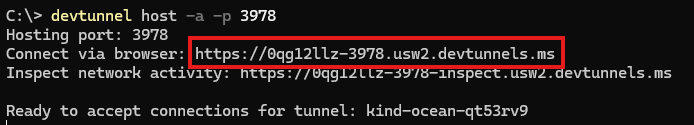
3978.Open another command prompt and go to your bot's project folder. Run the following command:
devtunnel host -a -p 3978devtunnel is now connected to your locally running bot. Copy the secure (HTTPS) public URL.
Update your bot resource
Now that your local bot is connected to devtunnel, you can configure your bot resource in Azure to use the devtunnel URL.
Go to your bot resource in Azure. On the left menu, under Settings, select Configuration.
Set the Messaging endpoint to the devtunnel URL address you copied. If necessary add /api/messages after the IP address. For example,
https://0qg12llz-3978.usw2.devtunnels.ms/api/messages.Select Enable Streaming Endpoint.
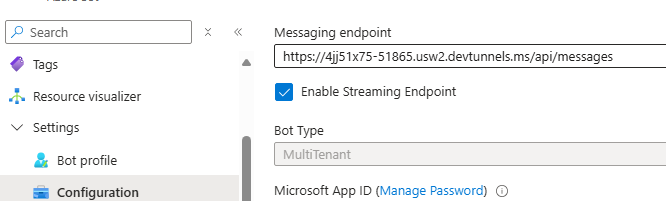
Select Apply to save your changes.
Tip
If Apply isn't enabled, you can uncheck Enable Streaming Endpoint and select Apply, then check Enable Streaming Endpoint and select Apply again. You need to make sure that Enable Streaming Endpoint is checked and the configuration of the endpoint is saved.
Go to your bot's resource group.
Select Deployment, and then select the bot resource that previously deployed successfully. Select Template from the left menu to get the MicrosoftAppId and MicrosoftAppPassword for the web app associated with your bot.
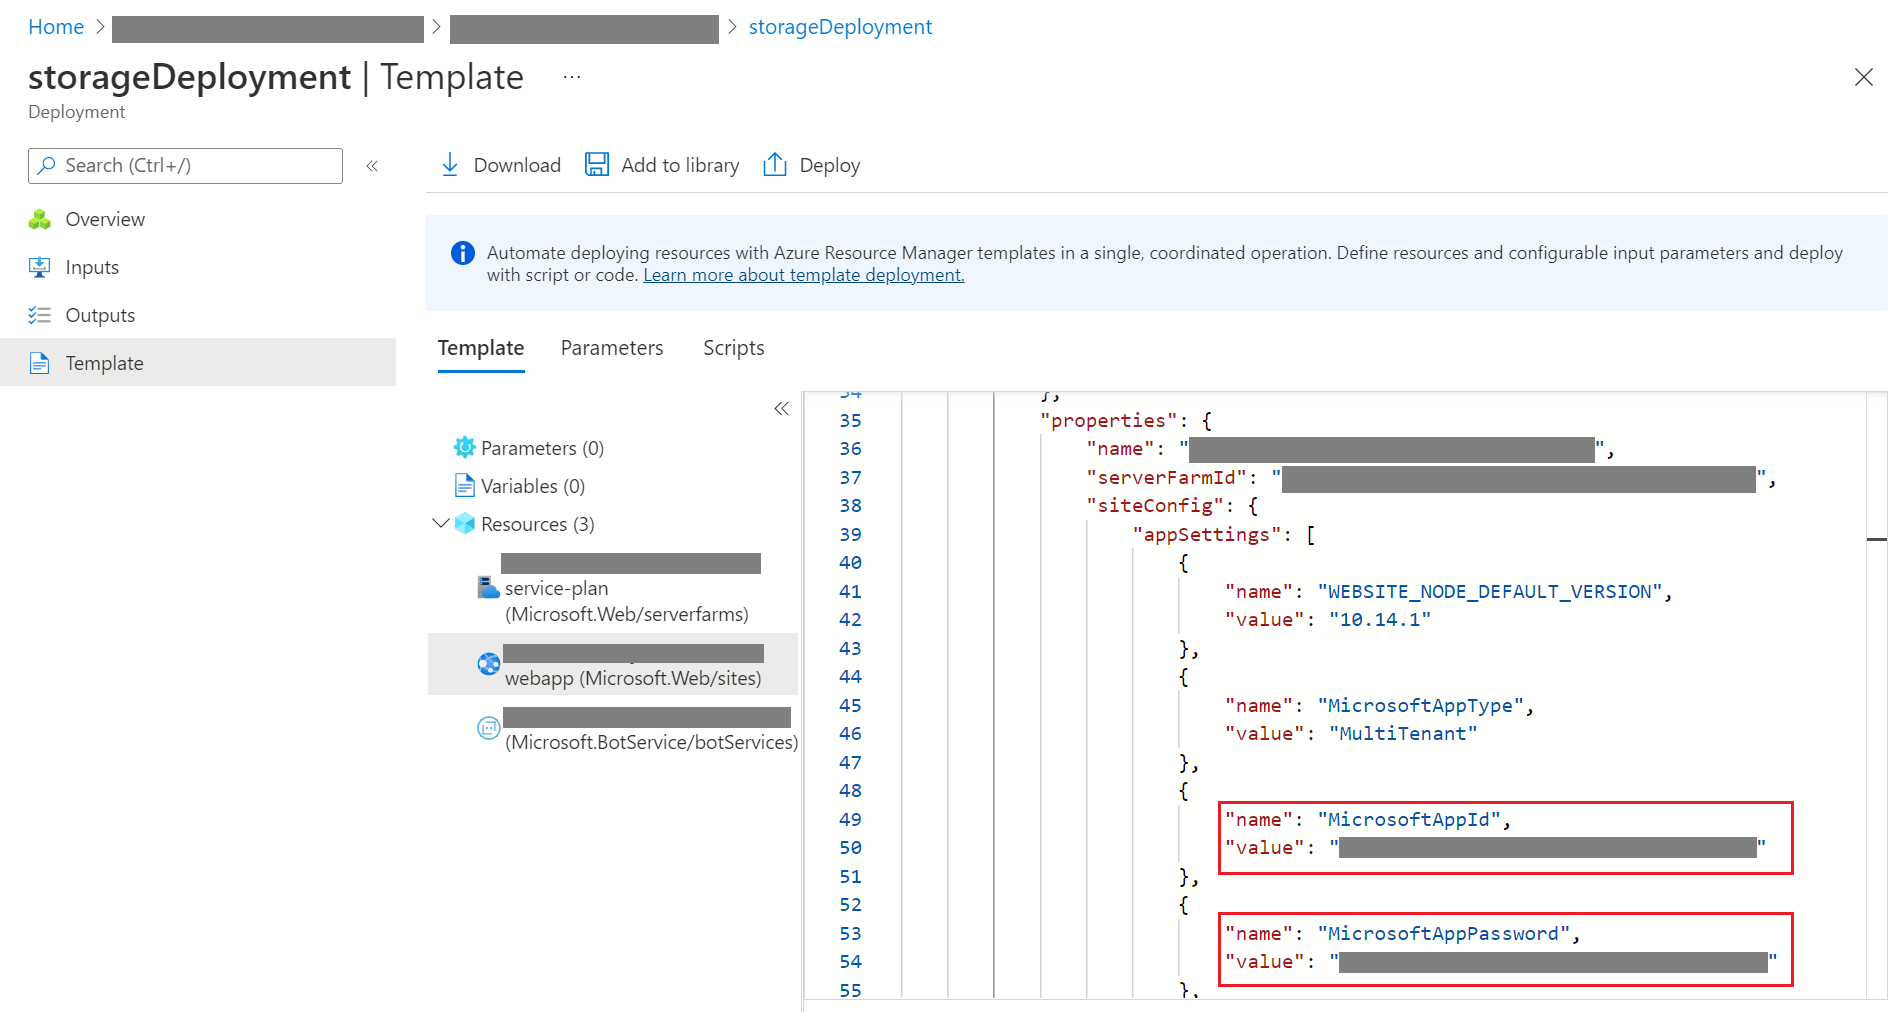
Update your bot's configuration file (appsettings.json for C#, or .env for JavaScript) with the MicrosoftAppId and MicrosoftAppPassword.
Start your Emulator, select Open Bot, and enter
http://localhost:3978/api/messagesin the Bot URL. Fill Microsoft App ID and Microsoft App password with the same MicrosoftAppId and MicrosoftAppPassword you added to our bot's configuration file. Then select Connect.Your running bot is now connected to your bot resource in Azure. To test your bot in Azure in Web Chat, go to your bot resources, select Test in Web Chat, and send messages to your bot.
Enable debugging mode
In your Emulator, select Debug, then Start Debugging.
Enter the devtunnel URL (don't forget to add /api/messages) for the Bot URL (for example,
https://4jj51x75-51865.usw2.devtunnels.ms/api/messages).- For Microsoft App ID, enter your bot's app ID.
- For Microsoft App password, enter your bot's app secret.
- Make sure Open in debug mode is checked as well.
- Select Connect.
With the debugging mode enabled, the Emulator generates a UUID. A UUID is a unique ID generated every time you start the debugging mode in your Emulator.
Copy and paste the UUID to the Test in Web Chat chat box for your channel's chat box. You'll see the message "Attached to session, all traffic is being replicated for inspection" in the chat box.
You can start debugging your bot by sending messages in the configured channel's chat box. Your local Emulator will automatically update the messages with all the details for debugging. To inspect your bot's state of messages, select Bot State and unfold the values in the right JSON window.
Next steps
- Learn how to Debug your bot using transcript files.
- Learn how to Debug a skill or skill consumer.