Note
Access to this page requires authorization. You can try signing in or changing directories.
Access to this page requires authorization. You can try changing directories.
Important
This is a feature of Azure CDN Premium from Edgio only, to configure rules on Azure CDN from Microsoft please use the Standard rules engine. Advanced rules aren't available for Azure CDN from Akamai. For a full comparison of CDN features, see Azure CDN product features.
Overview
Edge performance analytics provides granular information traffic and bandwidth usage for the CDN. This information can then be used to generate trending statistics, which allow you to gain insight on how your assets are being cached and delivered to your clients. Which allows you to form a strategy on how to optimize the delivery of your content and to determine what issues should be tackled to better use the CDN. As a result, not only can you be able to improve data delivery performance, but you can reduce your CDN costs.
Note
All reports use UTC/GMT notation when specifying a date/time.
Reports and log collection
CDN activity data must be collected with the Edge Performance Analytics module before it can generate reports on it. This collection process occurs once a day and it covers the activity that took place during the previous day. Therefore the report's statistics represent a sample of the day's statistics at the time it was processed, and don't necessarily contain the complete set of data for the current day. The primary function of these reports is to assess performance. They shouldn't be used for billing purposes or exact numeric statistics.
Note
The raw data from which Edge Performance Analytic reports are generated is available for at least 90 days.
Dashboard
The Edge Performance Analytics dashboard tracks current and historical CDN traffic through a chart and statistics. Use this dashboard to detect recent and long-term trends on the performance of CDN traffic for your account.
This dashboard consists of:
- An interactive chart that allows the visualization of key metrics and trends.
- A timeline that provides a sense of long term patterns for key metrics and trends.
- Key metrics and statistical information on how our CDN network improves site traffic as measured by overall performance, usage, and efficiency.
Accessing the edge performance dashboard
From the CDN profile page, select the Manage button.
The CDN management portal opens.
Hover over the Analytics tab, then hover over the Edge Performance Analytics flyout. Select on Dashboard.
The edge node analytics dashboard is displayed.
Chart
The dashboard contains a chart that tracks a metric over the time period selected in the timeline that appears directly below it. A timeline that graphs up to the last two years of CDN activity is displayed directly below the chart.
Using the chart
- By default, the cache efficiency rate for the last 30 days gets charted.
- This chart is generated from data collated on a daily basis.
- Hovering over a day on the line graph indicates a date and the value of the metric on that date.
- Select Highlight Weekends to toggle an overlay of light gray vertical bars that represent weekends onto the chart. This type of overlay is useful for identifying traffic patterns over weekends.
- Select View One Year Ago to toggle an overlay of the previous year's activity over the same time period onto the chart. This type of comparison provides insight into long-term CDN usage patterns. The upper-right hand corner of the chart contains a legend that indicates the color code for each line graph.
Updating the chart
- Time Range: Perform one of the following steps:
- Select the desired region in the timeline. The chart is updated with data that corresponds to the selected time period.
- Double-click the chart to display all available historical data up to a maximum of two years.
- Metric: Select the chart icon that appears next to the desired metric. The chart and the timeline get refreshed with data for the corresponding metric.
Key metrics and statistics
Efficiency metrics
The purpose of these metrics is to see whether cache efficiency can be improved. The main benefits derived from cache efficiency are:
- Reduced load on the origin server, which might lead to:
- Better web server performance.
- Reduced operational costs.
- Improved data delivery acceleration since more requests gets served directly from the CDN.
| Field | Description |
|---|---|
| Cache Efficiency | Indicates the percentage of data transferred that was served from cache. This metric measures when a cached version of the requested content was served directly from the CDN (edge servers) to requesters (for example, web browser) |
| Hit Rate | Indicates the percentage of requests that were served from cache. This metric measures when a cached version of the requested content was served directly from the CDN (edge servers) to requesters (for example, web browser). |
| % of Remote Bytes - No Cache Config | Indicates the percentage of traffic that was served from origin servers to the CDN (edge servers) that doesn't get cached as a result of the Bypass Cache feature (HTTP Rules Engine). |
| % of Remote Bytes - Expired Cache | Indicates the percentage of traffic that was served from origin servers to the CDN (edge servers) as a result of stale content revalidation. |
Usage metrics
The purpose of these metrics is to provide insight into the following cost-cutting measures:
- Minimizing operational costs through the CDN.
- Reducing CDN expenditures through cache efficiency and compression.
Note
Traffic volume numbers represent traffic that was used in calculations of ratios and percentages, and may only show a portion of the total traffic for high-volume customers.
| Field | Description |
|---|---|
| Ave Bytes Out | Indicates the average number of bytes transferred for each request served from the CDN (edge servers) to the requester (for example, web browser). |
| No Cache Config Byte Rate | Indicates the percentage of traffic served from the CDN (edge servers) to the requester (for example, web browser) that doesn't get cached due to the Bypass Cache feature. |
| Compressed Byte Rate | Indicates the percentage of traffic sent from the CDN (edge servers) to requesters (for example, web browser) in a compressed format. |
| Bytes Out | Indicates the amount of data, in bytes that were delivered from the CDN (edge servers) to the requester (for example, web browser). |
| Bytes In | Indicates the amount of data, in bytes, sent from requesters (for example, web browser) to the CDN (edge servers). |
| Bytes Remote | Indicates the amount of data, in bytes, sent from CDN and customer origin servers to the CDN (edge servers). |
Performance Metrics
The purpose of these metrics is to track overall CDN performance for your traffic.
| Field | Description |
|---|---|
| Transfer Rate | Indicates the average rate at which content was transferred from the CDN to a requester. |
| Duration | Indicates the average time, in milliseconds, it took to deliver an asset to a requester (for example, web browser). |
| Compressed Request Rate | Indicates the percentage of hits that were delivered from the CDN (edge servers) to the requester (for example, web browser) in a compressed format. |
| 4xx Error Rate | Indicates the percentage of hits that generated a 4xx status code. |
| 5xx Error Rate | Indicates the percentage of hits that generated a 5xx status code. |
| Hits | Indicates the number of requests for CDN content. |
Secure Traffic Metrics
The purpose of these metrics is to track CDN performance for HTTPS traffic.
| Field | Description |
|---|---|
| Secure Cache Efficiency | Indicates the percentage of data transferred for HTTPS requests that were served from cache. This metric measures when a cached version of the requested content was served directly from the CDN (edge servers) to requesters (for example, web browser) over HTTPS. |
| Secure Transfer Rate | Indicates the average rate at which content was transferred from the CDN (edge servers) to requesters (for example, web servers) over HTTPS. |
| Average Secure Duration | Indicates the average time, in milliseconds, it took to deliver an asset to a requester (for example, web browser) over HTTPS. |
| Secure Hits | Indicates the number of HTTPS requests for CDN content. |
| Secure Bytes Out | Indicates the amount of HTTPS traffic, in bytes that were delivered from the CDN (edge servers) to the requester (for example, web browser). |
Reports
Each report in this module contains a chart and statistics on bandwidth and traffic usage for different types of metrics. For example, HTTP status codes, cache status codes, request URL, and so on. This information might be used to delve deeper into how content is being served to your clients and to fine-tune CDN behavior to improve data delivery performance.
Accessing the edge performance reports
From the CDN profile page, select the Manage button.
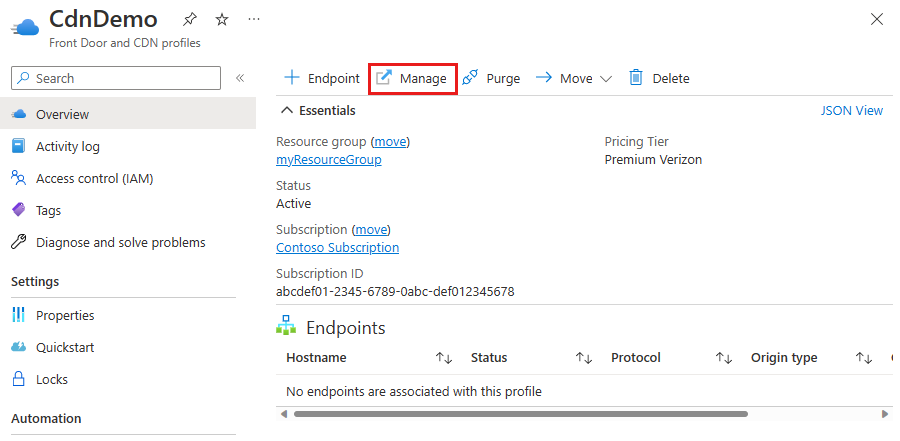
The CDN management portal opens.
Hover over the Analytics tab, then hover over the Edge Performance Analytics flyout. Select on HTTP Large Object.
The edge node analytics reports screen is displayed.
| Report | Description |
|---|---|
| Daily Summary | Allows you to view daily traffic trends over a specified time period. Each bar on this graph represents a particular date. The size of the bar indicates the total number of hits that occurred on that date. |
| Hourly Summary | Allows you to view hourly traffic trends over a specified time period. Each bar on this graph represents a single hour on a particular date. The size of the bar indicates the total number of hits that occurred during that hour. |
| Protocols | Displays the breakdown of traffic between the HTTP and HTTPS protocols. A donut chart indicates the percentage of hits that occurred for each type of protocol. |
| HTTP Methods | Allows you to get a quick sense of which HTTP methods are being used to request your data. Typically, the most common HTTP request methods are GET, HEAD, and POST. A donut chart indicates the percentage of hits that occurred for each type of HTTP request method. |
| URLs | Contains a graph that displays the top 10 requested URLs. A bar is displayed for each URL. The height of the bar indicates how many hits that particular URL has generated over the time span covered by the report. Statistics for the top 100 requested URLs are displayed directly below this graph. |
| CNAMEs | Contains a graph that displays the top 10 CNAMEs used to request assets over the time span of a report. Statistics for the top 100 requested CNAMEs are displayed directly below this graph. |
| Origins | Contains a graph that displays the top 10 CDN or customer origin servers from which assets were requested over a specified period of time. Statistics for the top 100 requested CDN or customer origin servers are displayed directly below this graph. Customer origin servers get identified by the name defined in the Directory Name option. |
| Geo POPs | Shows how much of your traffic is being routed through a particular point of presence (POP). The three-letter abbreviation represents a POP in our CDN network. |
| Clients | Contains a graph that displays the top 10 clients that requested assets over a specified period of time. For the purposes of this report, all requests that originate from the same IP address are considered to be from the same client. Statistics for the top 100 clients are displayed directly below this graph. This report is useful for determining download activity patterns for your top clients. |
| Cache Statuses | Gives a detailed breakdown of cache behavior, which may reveal approaches for improving the overall end-user experience. Since the fastest performance comes from cache hits, you can optimize data delivery speeds by minimizing cache misses and expired cache hits. |
| NONE Details | Contains a graph that displays the top 10 URLs for assets for which cache content freshness wasn't checked over a specified period of time. Statistics for the top 100 URLs for these types of assets are displayed directly below this graph. |
| CONFIG_NOCACHE Details | Contains a graph that displays the top 10 URLs for assets that weren't cached due to the customer's CDN configuration. These types of assets were served directly from the origin server. Statistics for the top 100 URLs for these types of assets are displayed directly below this graph. |
| UNCACHEABLE Details | Contains a graph that displays the top 10 URLs for assets that couldn't be cached due to request header data. Statistics for the top 100 URLs for these types of assets are displayed directly below this graph. |
| TCP_HIT Details | Contains a graph that displays the top 10 URLs for assets that are served immediately from cache. Statistics for the top 100 URLs for these types of assets are displayed directly below this graph. |
| TCP_MISS Details | Contains a graph that displays the top 10 URLs for assets that have a cache status of TCP_MISS. Statistics for the top 100 URLs for these types of assets are displayed directly below this graph. |
| TCP_EXPIRED_HIT Details | Contains a graph that displays the top 10 URLs for stale assets that were served directly from the POP. Statistics for the top 100 URLs for these types of assets are displayed directly below this graph. |
| TCP_EXPIRED_MISS Details | Contains a graph that displays the top 10 URLs for stale assets for which a new version had to be retrieved from the origin server. Statistics for the top 100 URLs for these types of assets are displayed directly below this graph. |
| TCP_CLIENT_REFRESH_MISS Details | Contains a bar chart that displays the top 10 URLs for assets were retrieved from an origin server due to a no-cache request from the client. Statistics for the top 100 URLs for these types of requests are displayed directly below this chart. |
| Client Request Types | Indicates the type of requests that were made by HTTP clients (for example, browsers). This report includes a donut chart that provides a sense as to how requests are being handled. Bandwidth and traffic information for each request type is displayed below the chart. |
| User Agent | Contains a bar graph displaying the top 10 user agents to request your content through our CDN. Typically, a user agent is a web browser, media player, or a mobile phone browser. Statistics for the top 100 user agents are displayed directly below this chart. |
| Referrers | Contains a bar graph displaying the top 10 referrers to content accessed through our CDN. Typically, a referrer is the URL of the web page or resource that links to your content. Detailed information is provided below the graph for the top 100 referrers. |
| Compression Types | Contains a donut chart that breaks down requested assets by whether they get compressed by our edge servers. The percentage of compressed assets broken down by the type of compression used. Detailed information is provided below the graph for each compression type and status. |
| File Types | Contains a bar graph that displays the top 10 file types that have been requested through our CDN for your account. For the purposes of this report, a file type gets defined by the asset's file name extension and Internet media type (for example, .html [text/html], .htm [text/html], .aspx [text/html], and so on). Detailed information is provided below the graph for the top 100 file types. |
| Unique Files | Contains a graph that plots the total number of unique assets that gets requested on a particular day over a specified period of time. |
| Token Auth Summary | Contains a pie chart that provides a quick overview on whether requested assets were protected by Token-Based Authentication. Protected assets are displayed in the chart according to the results of their attempted authentication. |
| Token Auth Deny Details | Contains a bar graph that allows you to view the top 10 requests that were denied due to Token-Based Authentication. |
| HTTP Response Codes | Provides a breakdown of the HTTP status codes (for example, 200 OK, 403 Forbidden, 404 Not Found, and so on.) that were delivered to your HTTP clients by our edge servers. A pie chart allows you to quickly assess how your assets were served. Detailed statistical data is provided for each response code below the graph. |
| 404 Errors | Contains a bar graph that allows you to view the top 10 requests that resulted in a 404 Not Found response code. |
| 403 Errors | Contains a bar graph that allows you to view the top 10 requests that resulted in a 403 Forbidden response code. A 403 Forbidden response code occurs when a request gets denied by a customer origin server or an edge server on our POP. |
| 4xx Errors | Contains a bar graph that allows you to view the top 10 requests that resulted in a response code in the 400 range. Excluded from this report are 403 Not Found and 404 Forbidden response codes. Typically, a 4xx response code occurs when a request is denied as a result of a client error. |
| 504 Errors | Contains a bar graph that allows you to view the top 10 requests that resulted in a 504 Gateway Timeout response code. A 504 Gateway Timeout response code occurs when a timeout occurs when an HTTP proxy is trying to communicate with another server. With our CDN, a 504 Gateway Timeout response code typically occurs when an edge server is unable to establish communication with a customer origin server. |
| 502 Errors | Contains a bar graph that allows you to view the top 10 requests that resulted in a 502 Bad Gateway response code. A 502 Bad Gateway response code occurs when an HTTP protocol failure occurs between a server and an HTTP proxy. With our CDN, a 502 Bad Gateway response code typically occurs when a customer origin server returns an invalid response to an edge server. A response is invalid if it can't be parsed or if it's incomplete. |
| 5xx Errors | Contains a bar graph that allows you to view the top 10 requests that resulted in a response code in the 500 range. Excluded from this report are 502 Bad Gateway and 504 Gateway Timeout response codes. |