Real-time Monitoring, metrics, and access Logs for Azure CDN
With Azure CDN from Microsoft, you can monitor resources in the following ways to help you troubleshoot, track, and debug issues.
- Raw logs provide rich information about every request that CDN receives. Raw logs differ from activity logs. Activity logs provide visibility into the operations done on Azure resources.
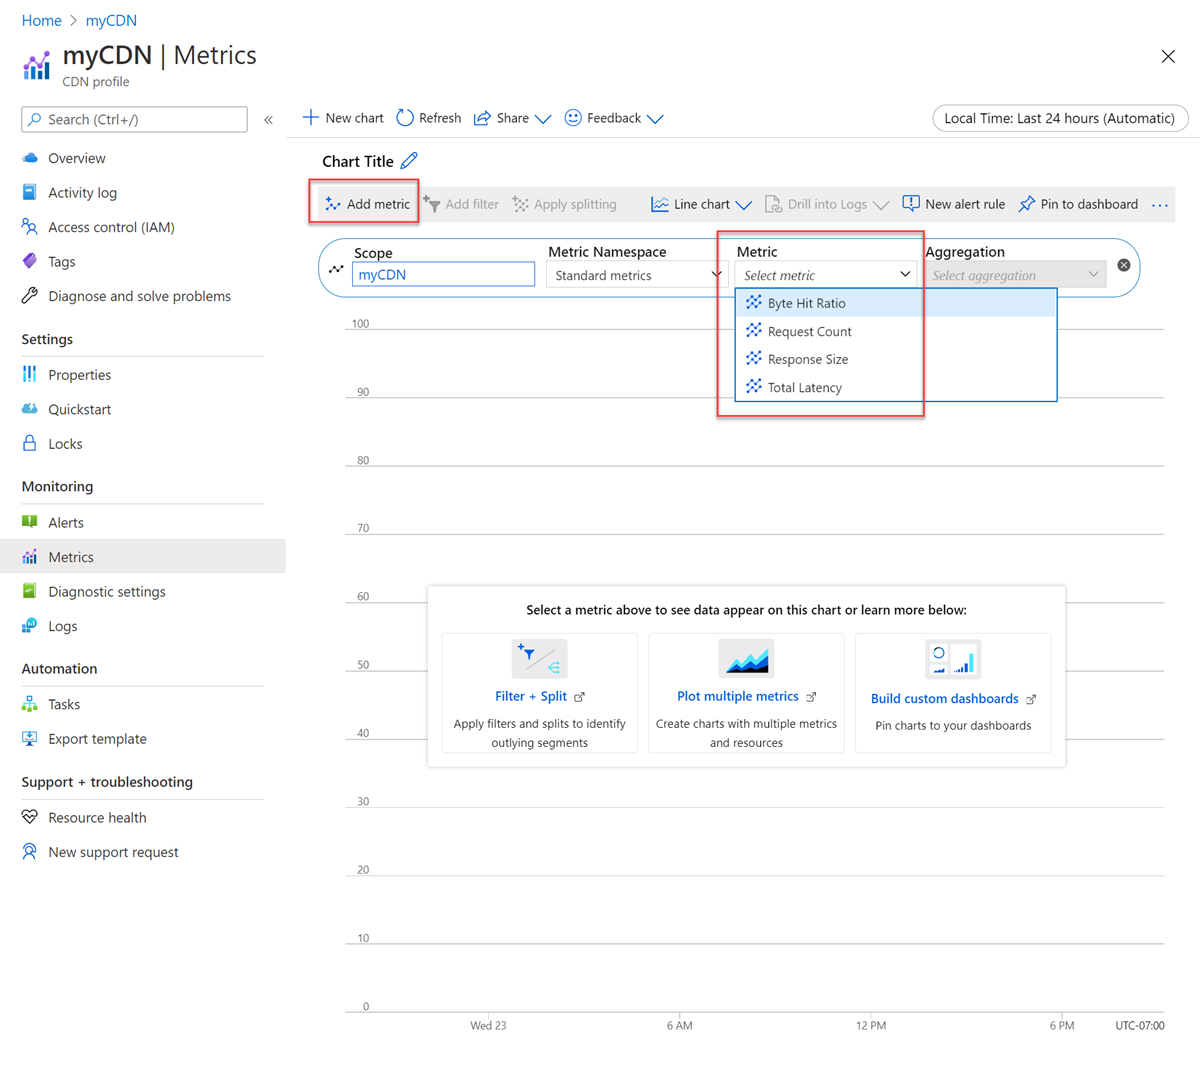
- Metrics, which display four key metrics on CDN, including Byte Hit Ratio, Request Count, Response Size and Total Latency. It also provides different dimensions to break down metrics.
- Alert, which allows customer to set up alert for key metrics
- More metrics, which allow customers to use Azure Log Analytics to enable more metrics of value. We also provide query samples for a few other metrics under Azure Log Analytics.
Important
The HTTP raw logs feature is available for Azure CDN from Microsoft.
If you don't have an Azure subscription, create a free account before you begin.
Sign in to Azure
Sign in to the Azure portal.
Configuration - Azure portal
To configure Raw logs for your Azure CDN from Microsoft profile:
From the Azure portal menu, select All Resources >> <your-CDN-profile>.
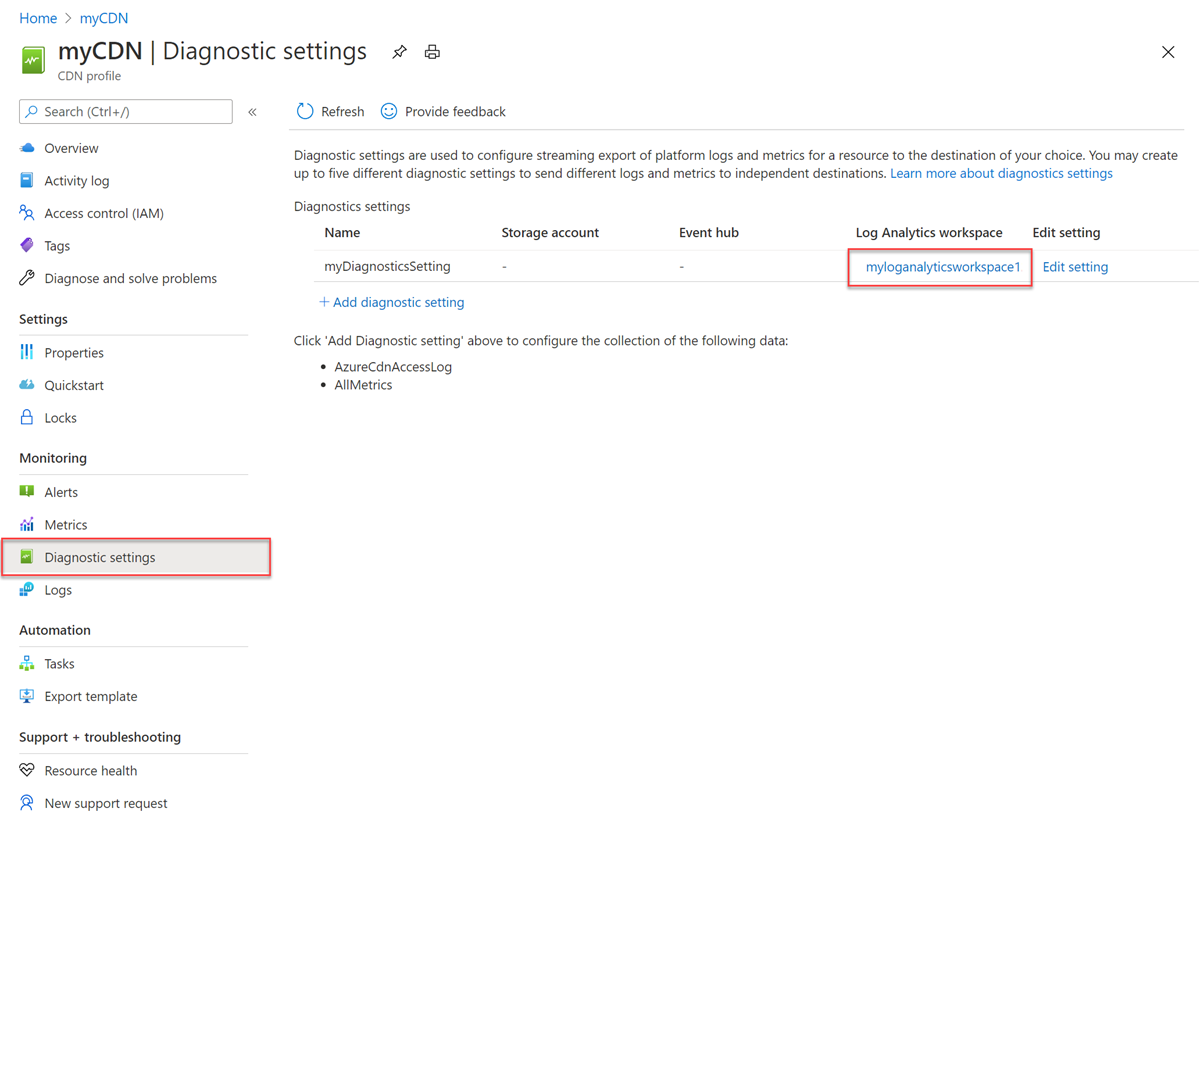
Under Monitoring, select Diagnostics settings.
Select + Add diagnostic setting.
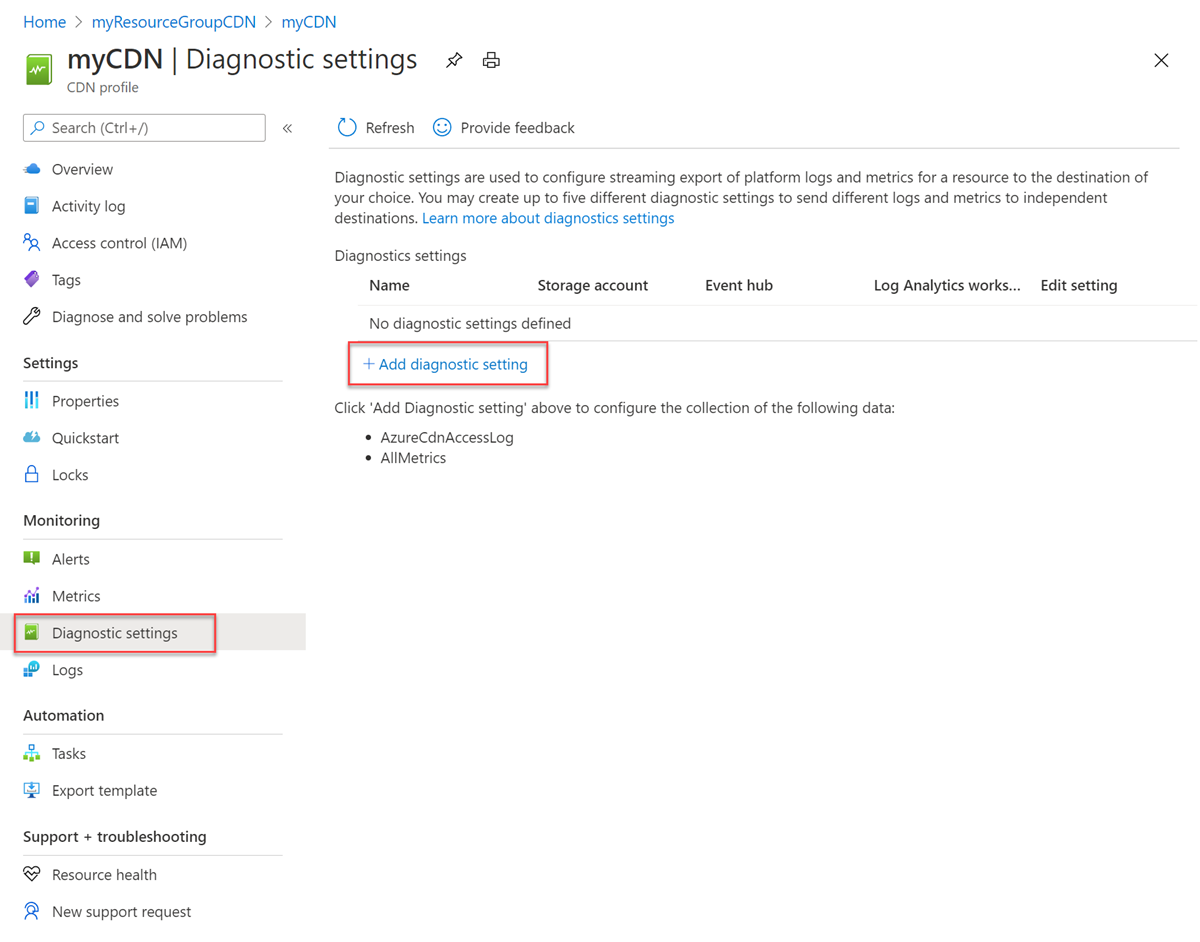
Important
Raw logs is only available in the profile level while aggregated HTTP status code logs are available in the endpoint level.
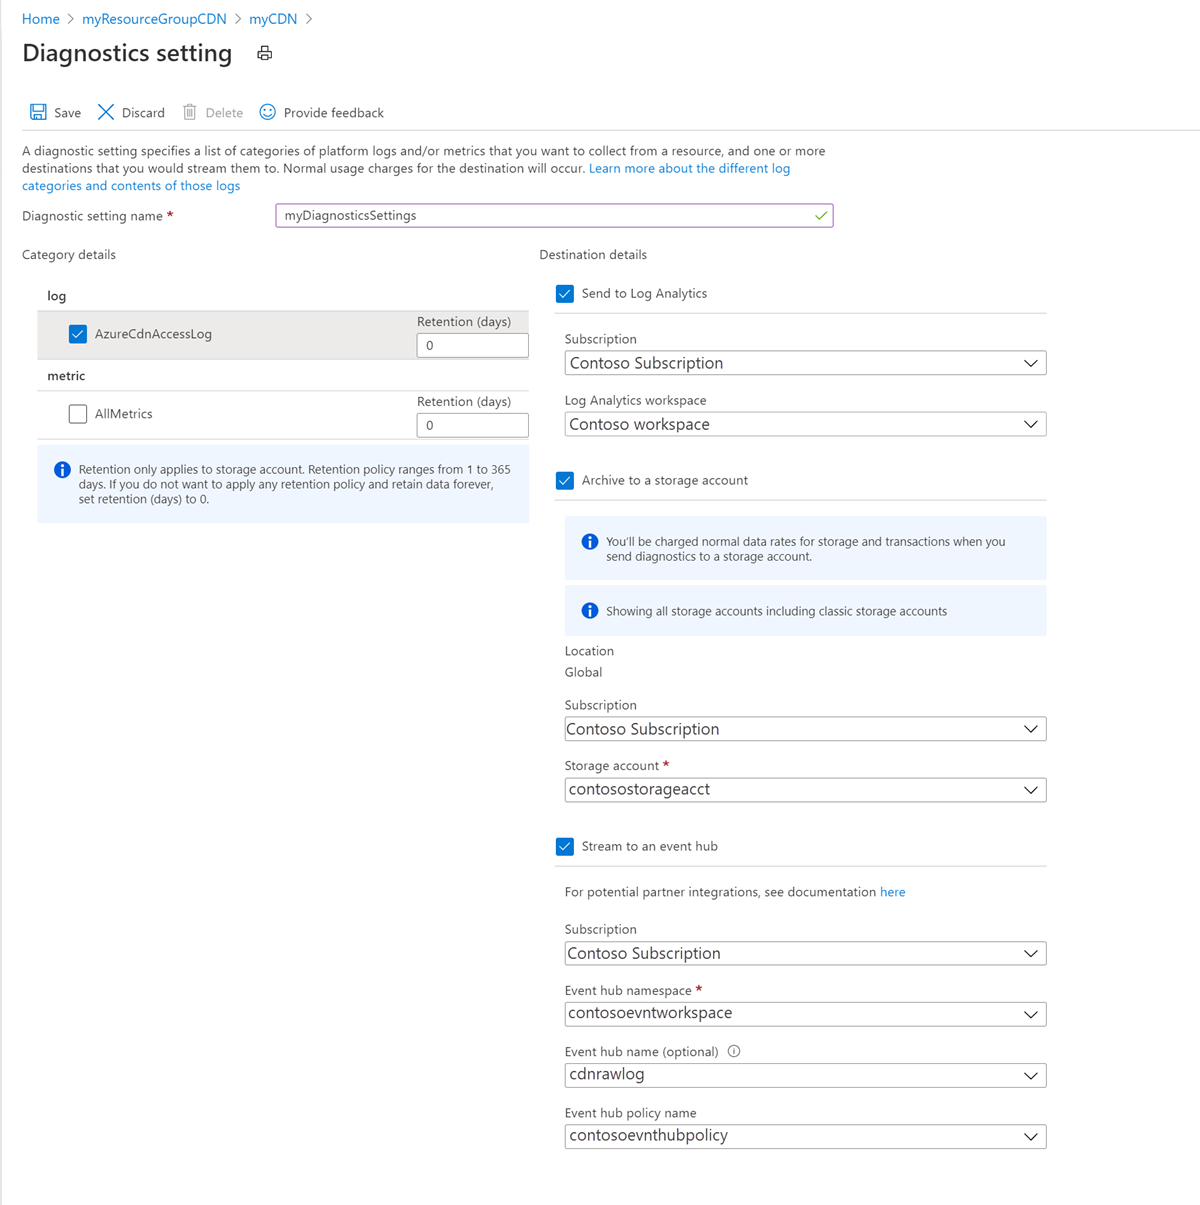
Under Diagnostic settings, enter a name for the diagnostic setting under Diagnostic settings name.
Select the AzureCdnAccessLog and set the retention in days.
Select the Destination details. Destination options are:
- Send to Log Analytics
- Select the Subscription and Log Analytics workspace.
- Archive to a storage account
- Select the Subscription and the Storage Account.
- Stream to an event hub
- Select the Subscription, Event hub namespace, Event hub name (optional), and Event hub policy name.
- Send to Log Analytics
Select Save.
Configuration - Azure PowerShell
Use Set-AzDiagnosticSetting to configure the diagnostic setting for raw logs.
Retention data is defined by the -RetentionInDays option in the command.
Note
We recommend that you use the Azure Az PowerShell module to interact with Azure. See Install Azure PowerShell to get started. To learn how to migrate to the Az PowerShell module, see Migrate Azure PowerShell from AzureRM to Az.
Enable diagnostic logs in a storage account
Sign in to Azure PowerShell:
Connect-AzAccountTo enable Diagnostic Logs in a storage account, enter these commands. Replace the variables with your values:
## Variables for the commands ##
$rsg = <your-resource-group-name>
$cdnprofile = <your-cdn-profile-name>
$cdnendpoint = <your-cdn-endpoint-name>
$storageacct = <your-storage-account-name>
$diagname = <your-diagnostic-setting-name>
$days = '30'

$cdn = Get-AzCdnProfile -ResourceGroupName $rsg -ProfileName $cdnprofile

$storage = Get-AzStorageAccount -ResourceGroupName $rsg -Name $storageacct

Set-AzDiagnosticSetting -Name $diagname -ResourceId $cdn.id -StorageAccountId $storage.id -Enabled $true -Category AzureCdnAccessLog -RetentionEnabled 1 -RetentionInDays $days
Enable diagnostics logs for Log Analytics workspace
Sign in to Azure PowerShell:
Connect-AzAccountTo enable Diagnostic Logs for a Log Analytics workspace, enter these commands. Replace the variables with your values:
## Variables for the commands ##
$rsg = <your-resource-group-name>
$cdnprofile = <your-cdn-profile-name>
$cdnendpoint = <your-cdn-endpoint-name>
$workspacename = <your-log-analytics-workspace-name>
$diagname = <your-diagnostic-setting-name>
$days = '30'

$cdn = Get-AzCdnEndpoint -ResourceGroupName $rsg -ProfileName $cdnprofile -EndpointName $cdnendpoint

$workspace = Get-AzOperationalInsightsWorkspace -ResourceGroupName $rsg -Name $workspacename

Set-AzDiagnosticSetting -Name $diagname -ResourceId $cdn.id -WorkspaceId $workspace.ResourceId -Enabled $true -Category AzureCdnAccessLog -RetentionEnabled 1 -RetentionInDays $days
Enable diagnostics logs for event hub namespace
Sign in to Azure PowerShell:
Connect-AzAccountTo enable Diagnostic Logs for an event hub namespace, enter these commands. Replace the variables with your values:
## Variables for the commands ##
$rsg = <your-resource-group-name>
$cdnprofile = <your-cdn-profile-name>
$cdnendpoint = <your-cdn-endpoint-name>
$evthubnamespace = <your-event-hub-namespace-name>
$diagname = <your-diagnostic-setting-name>

$cdn = Get-AzCdnEndpoint -ResourceGroupName $rsg -ProfileName $cdnprofile -EndpointName $cdnendpoint

$eventhub = Get-AzEventHubNamespace -ResourceGroupName $rsg -Name $eventhubname

Set-AzDiagnosticSetting -Name $diagname -ResourceId $cdn.id -EventHubName $eventhub.id -Enabled $true -Category AzureCdnAccessLog -RetentionEnabled 1 -RetentionInDays $days
Raw logs properties
Azure CDN from Microsoft Service currently provides Raw logs. Raw logs provide individual API requests with each entry having the following schema:
| Property | Description |
|---|---|
| BackendHostname | If the request is being forwarded to a backend, this field represents the hostname of the backend. This field is blank if the request gets redirected or forwarded to a regional cache (when caching gets enabled for the routing rule). |
| CacheStatus | For caching scenarios, this field defines the cache hit/miss at the POP |
| ClientIp | The IP address of the client that made the request. If there was an X-Forwarded-For header in the request, then the Client IP is picked from the same. |
| ClientPort | The IP port of the client that made the request. |
| HttpMethod | HTTP method used by the request. |
| HttpStatusCode | The HTTP status code returned from the proxy. If a request to the origin timeouts the value for HttpStatusCode is set to 0. |
| HttpStatusDetails | Resulting status on the request. Meaning of this string value can be found at a Status reference table. |
| HttpVersion | Type of the request or connection. |
| POP | Short name of the edge where the request landed. |
| RequestBytes | The size of the HTTP request message in bytes, including the request headers and the request body. |
| RequestUri | URI of the received request. |
| ResponseBytes | Bytes sent by the backend server as the response. |
| RoutingRuleName | The name of the routing rule that the request matched. |
| RulesEngineMatchNames | The names of the rules that the request matched. |
| SecurityProtocol | The TLS/SSL protocol version used by the request or null if no encryption. |
| SentToOriginShield (deprecated) * See notes on deprecation in the following section. |
If true, it means that request was answered from origin shield cache instead of the edge pop. Origin shield is a parent cache used to improve cache hit ratio. |
| isReceivedFromClient | If true, it means that the request came from the client. If false, the request is a miss in the edge (child POP) and is responded from origin shield (parent POP). |
| TimeTaken | The length of time from first byte of request into Azure Front Door to last byte of response out, in seconds. |
| TrackingReference | The unique reference string that identifies a request served by Azure Front Door, also sent as X-Azure-Ref header to the client. Required for searching details in the access logs for a specific request. |
| UserAgent | The browser type that the client used. |
| ErrorInfo | This field contains the specific type of error to narrow down troubleshooting area. Possible values include: NoError: Indicates no errors were found. CertificateError: Generic SSL certificate error. CertificateNameCheckFailed: The host name in the SSL certificate is invalid or doesn't match. ClientDisconnected: Request failure because of client network connection. UnspecifiedClientError: Generic client error. InvalidRequest: Invalid request. It might occur because of malformed header, body, and URL. DNSFailure: DNS Failure. DNSNameNotResolved: The server name or address couldn't be resolved. OriginConnectionAborted: The connection with the origin was stopped abruptly. OriginConnectionError: Generic origin connection error. OriginConnectionRefused: The connection with the origin wasn't able to established. OriginError: Generic origin error. OriginInvalidResponse: Origin returned an invalid or unrecognized response. OriginTimeout: The timeout period for origin request expired. ResponseHeaderTooBig: The origin returned too large of a response header. RestrictedIP: The request was blocked because of restricted IP. SSLHandshakeError: Unable to establish connection with origin because of SSL hand shake failure. UnspecifiedError: An error occurred that didn't fit in any of the errors in the table. |
| TimeToFirstByte | The length of time in milliseconds from when Microsoft CDN receives the request to the time the first byte gets sent to the client. The time is measured only from the Microsoft side. Client-side data isn't measured. |
| Result | SSLMismatchedSNI is a status code that signifies a successful request with a mismatch warning between the Server Name Indication (SNI) and the host header. This status code implies domain fronting, a technique that violates Azure Front Door's terms of service. Requests with SSLMismatchedSNI will be rejected after January 22, 2024. |
| SNI | This field specifies the Server Name Indication (SNI) that is sent during the TLS/SSL handshake. It can be used to identify the exact SNI value if there was a SSLMismatchedSNI status code. Additionally, it can be compared with the host value in the requestUri field to detect and resolve the mismatch issue. |
Note
The logs can be viewed under your Log Analytics profile by running a query. A sample query would look like:
AzureDiagnostics | where Category == "AzureCdnAccessLog"
Sent to origin shield deprecation
The raw log property isSentToOriginShield is deprecated and replaced by a new field isReceivedFromClient. Use the new field if you're already using the deprecated field.
Raw logs include logs generated from both CDN edge (child POP) and origin shield. Origin shield refers to parent nodes that are strategically located across the globe. These nodes communicate with origin servers and reduce the traffic load on origin.
For every request that goes to origin shield, there are two log entries:
- One for edge nodes
- One for origin shield.
To differentiate the egress or responses from the edge nodes vs. origin shield, you can use the field isReceivedFromClient to get the correct data.
If the value is false, then it means the request is responded from origin shield to edge nodes. This approach is effective to compare raw logs with billing data. Charges aren't incurred for egress from origin shield to the edge nodes. Charges are incurred for egress from the edge nodes to clients.
Kusto query sample to exclude logs generated on origin shield in Log Analytics.
AzureDiagnostics
| where OperationName == "Microsoft.Cdn/Profiles/AccessLog/Write" and Category == "AzureCdnAccessLog"
| where isReceivedFromClient == true
Important
The HTTP Raw logs feature is available automatically for any profiles created or updated after 25th February 2020. For CDN profiles created earlier, one should update the CDN endpoint after setting up logging. For example, one can navigate to geo filtering under CDN endpoints and block any country/region not relevant to their workload and hit save.
Metrics
Azure CDN from Microsoft is integrated with Azure Monitor and publishes four CDN metrics to help track, troubleshoot, and debug issues.
The Metrics are displayed in charts and accessible via PowerShell, CLI, and API. The CDN metrics are free of charge.
Azure CDN from Microsoft measures and sends its metrics in 60-second intervals. The metrics can take up to 3 mins to appear in the portal.
For more information, see Azure Monitor metrics.
Metrics supported by Azure CDN from Microsoft
| Metrics | Description | Dimensions |
|---|---|---|
| Bytes Hit ratio* | The percentage of egress from CDN cache, computed against the total egress. | Endpoint |
| RequestCount | The number of client requests served by CDN. | Endpoint Client country. Client region. HTTP status. HTTP status group. |
| ResponseSize | The number of bytes sent as responses from CDN edge to clients. | Endpoint Client country. Client region. HTTP status. HTTP status group. |
| TotalLatency | The total time from the client request received by CDN until the last response byte send from CDN to client. | Endpoint Client country. Client region. HTTP status. HTTP status group. |
Note
If a request to the origin timeout, the value for HttpStatusCode is set to 0.
*Bytes Hit Ratio = (egress from edge - egress from origin)/egress from edge
Scenarios excluded in bytes hit ratio calculation:
- You explicitly configure no cache either through Rules Engine or Query String caching behavior.
- You explicitly configure cache-control directive with no-store or private cache.
Metrics configuration
From the Azure portal menu, select All Resources >> <your-CDN-profile>.
Under Monitoring, select Metrics:
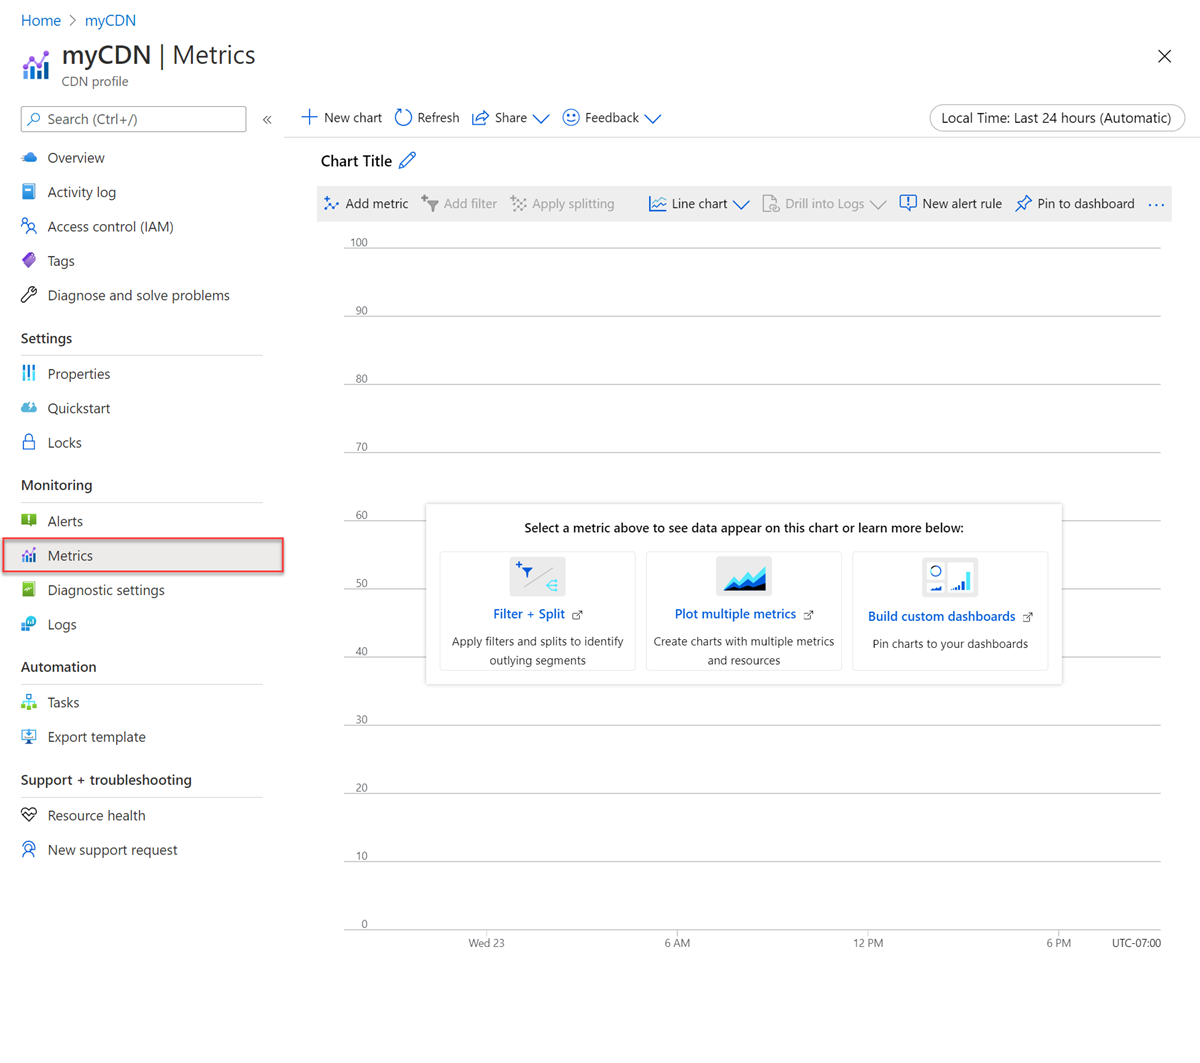
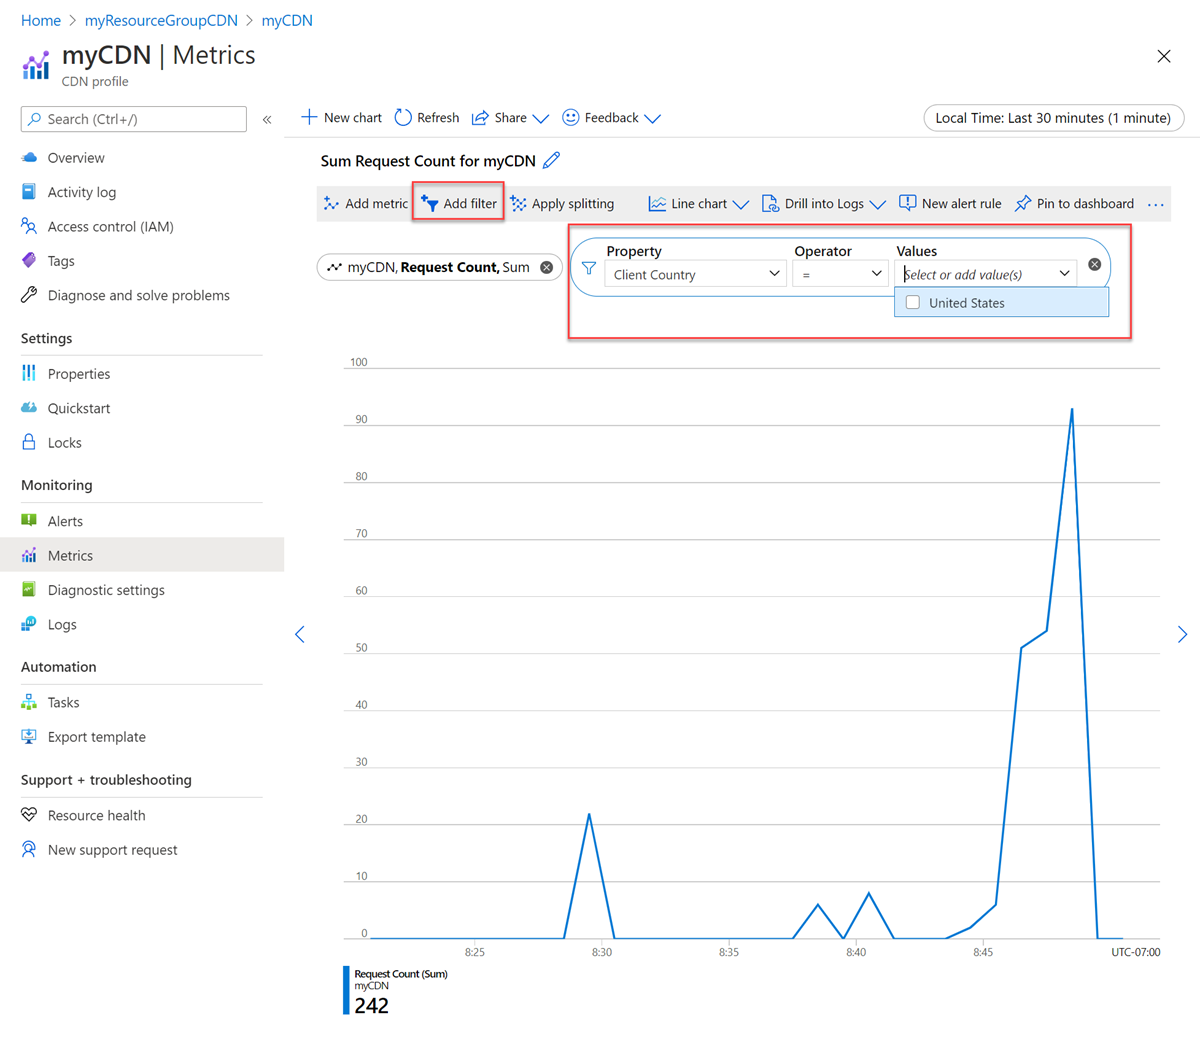
Select Add metric, select the metric to add:
Select Add filter to add a filter:
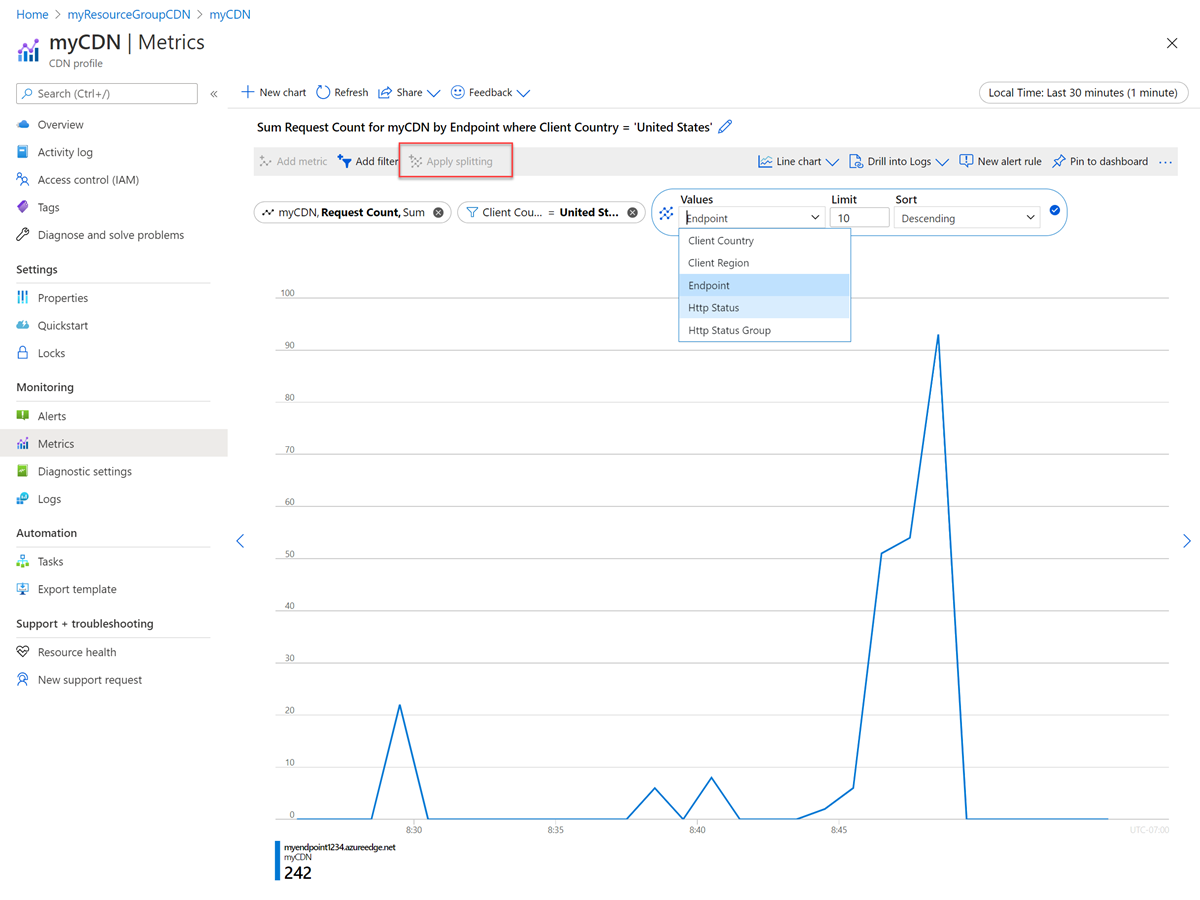
Select Apply splitting to see trend by different dimensions:
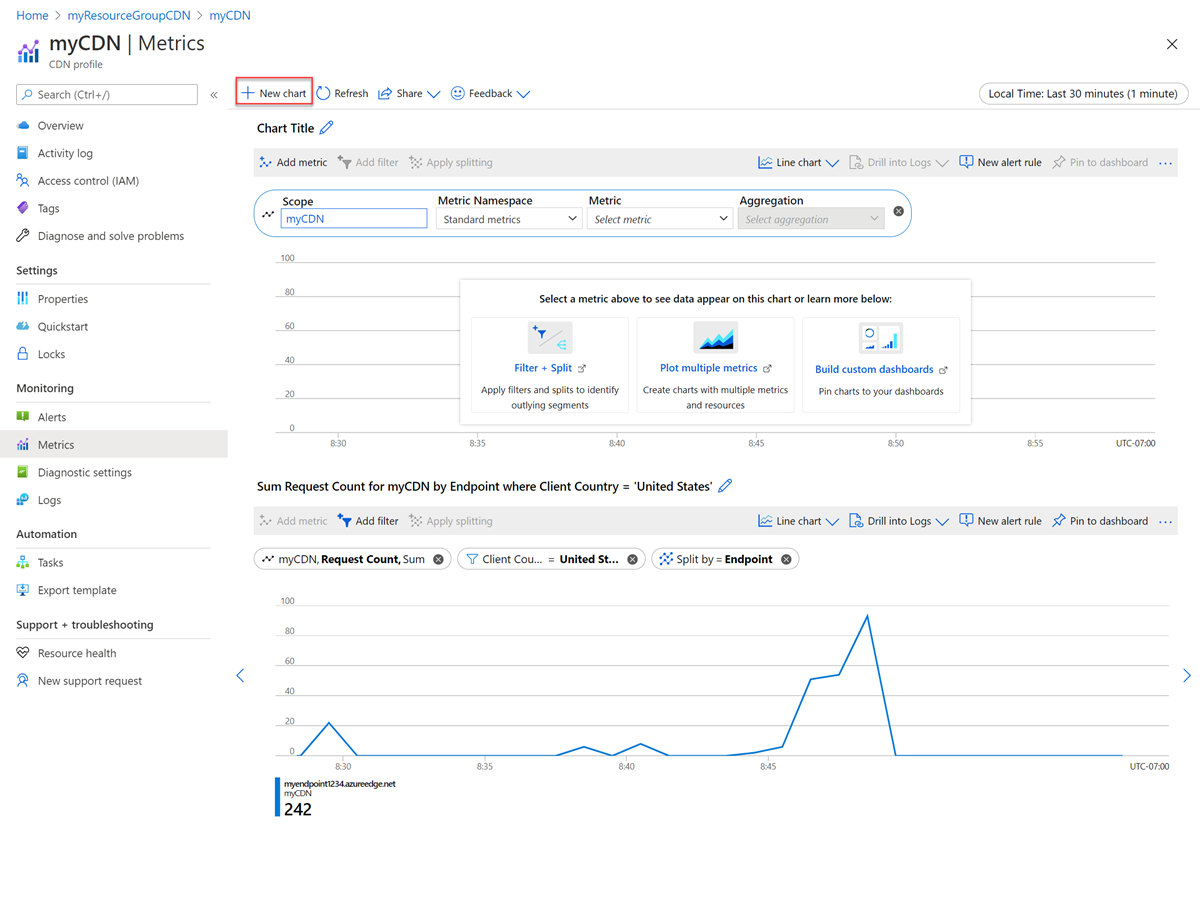
Select New chart to add a new chart:
Alerts
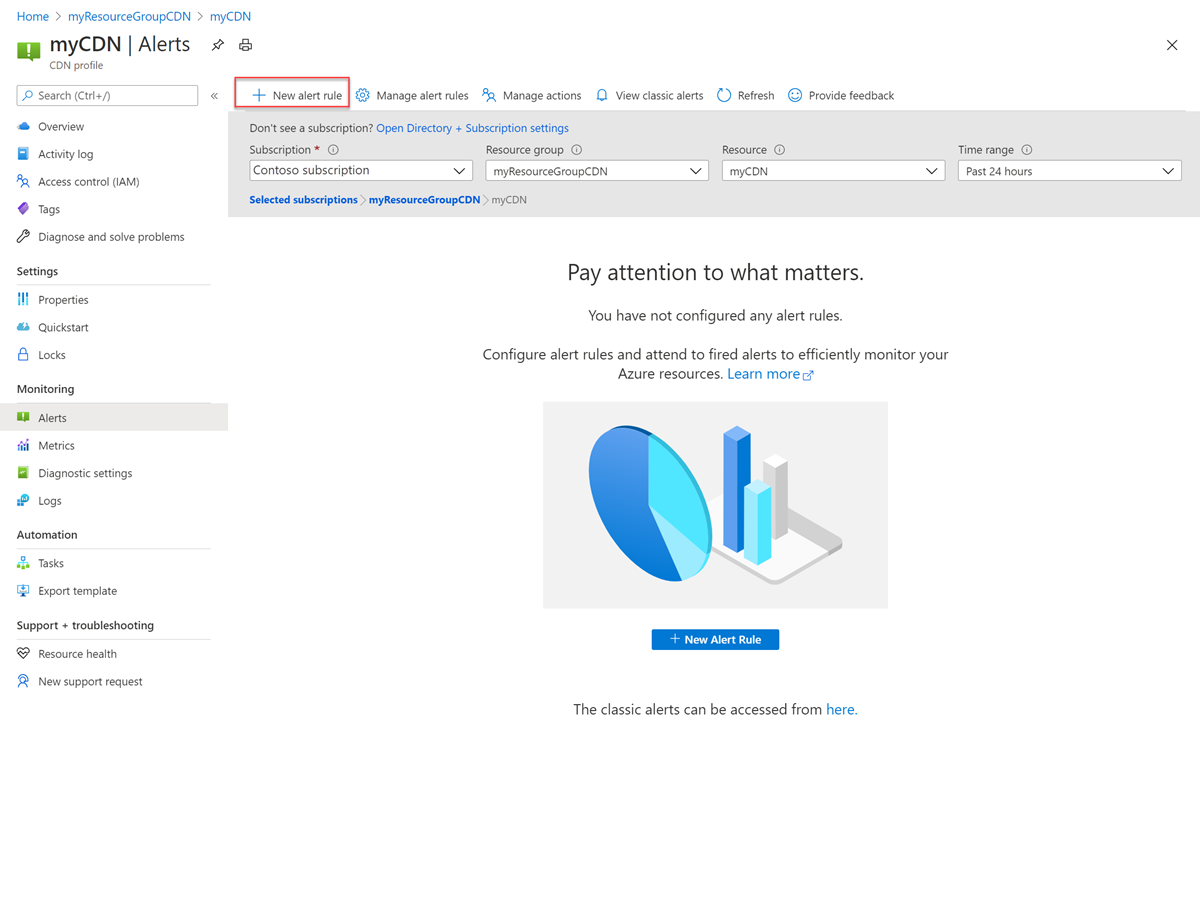
You can setup alerts on Microsoft CDN by selecting Monitoring >> Alerts.
Select New alert rule for metrics listed in Metrics section:
Alert is charged based on Azure Monitor. For more information about alerts, see Azure Monitor alerts.
More Metrics
You can enable more metrics using Azure Log Analytics and raw logs for an extra cost.
Follow steps in the previous section to enable diagnostics to send raw log to Log Analytics.
Select the Log Analytics workspace you created:
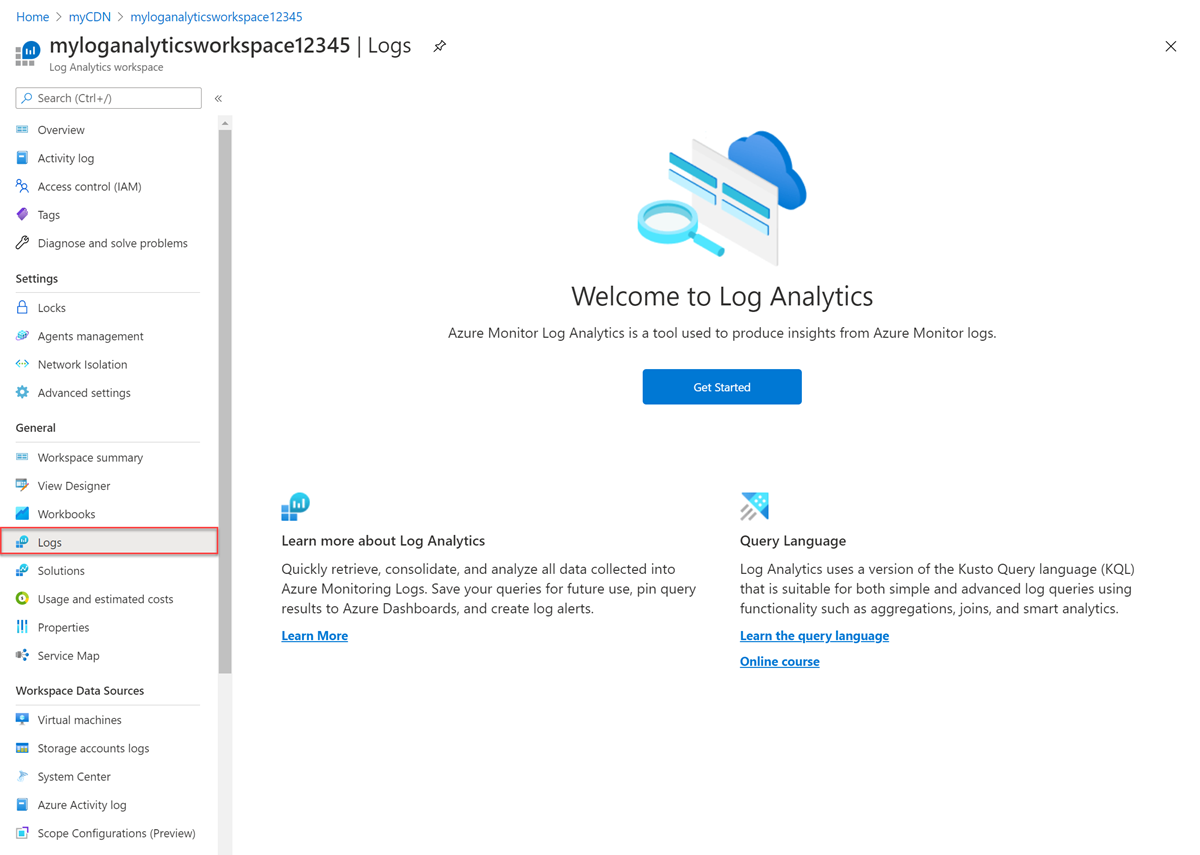
Select Logs under General in the Log Analytics workspace. Then select Get Started:
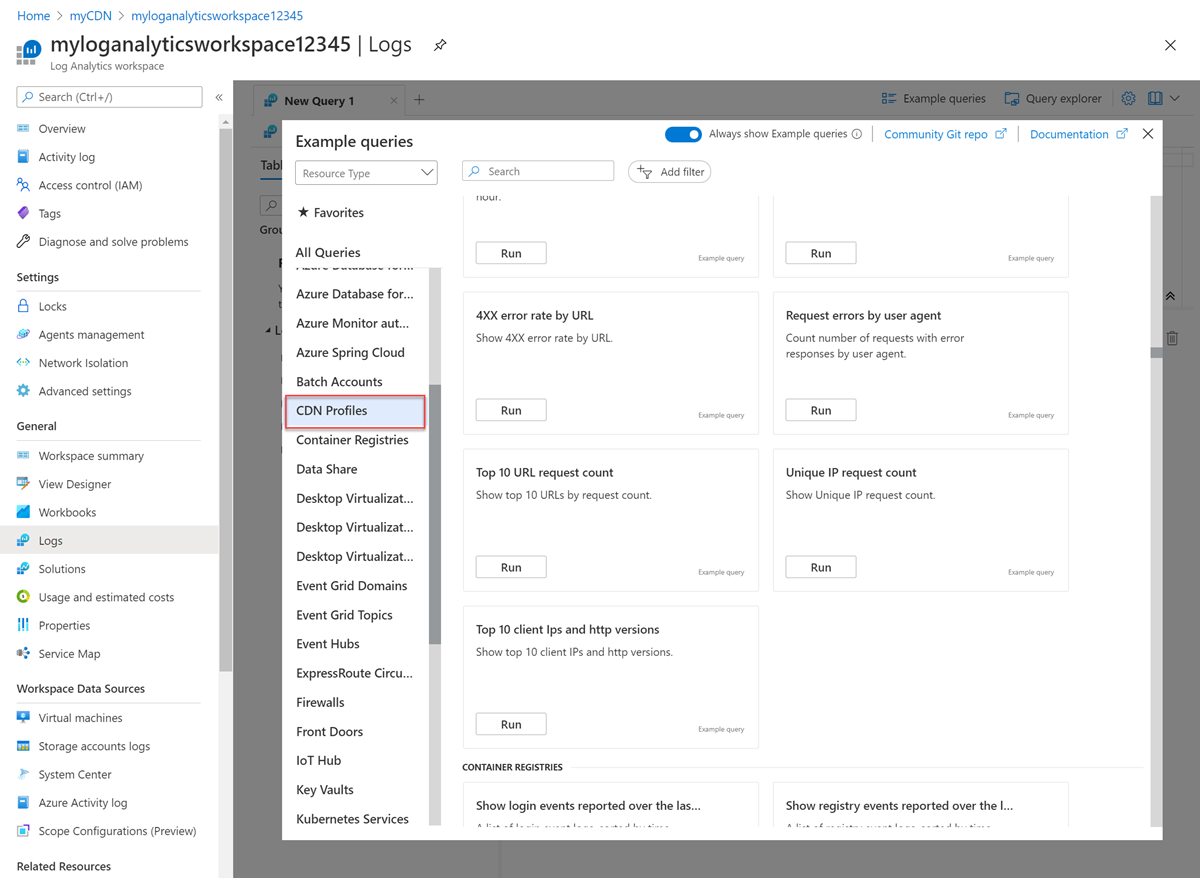
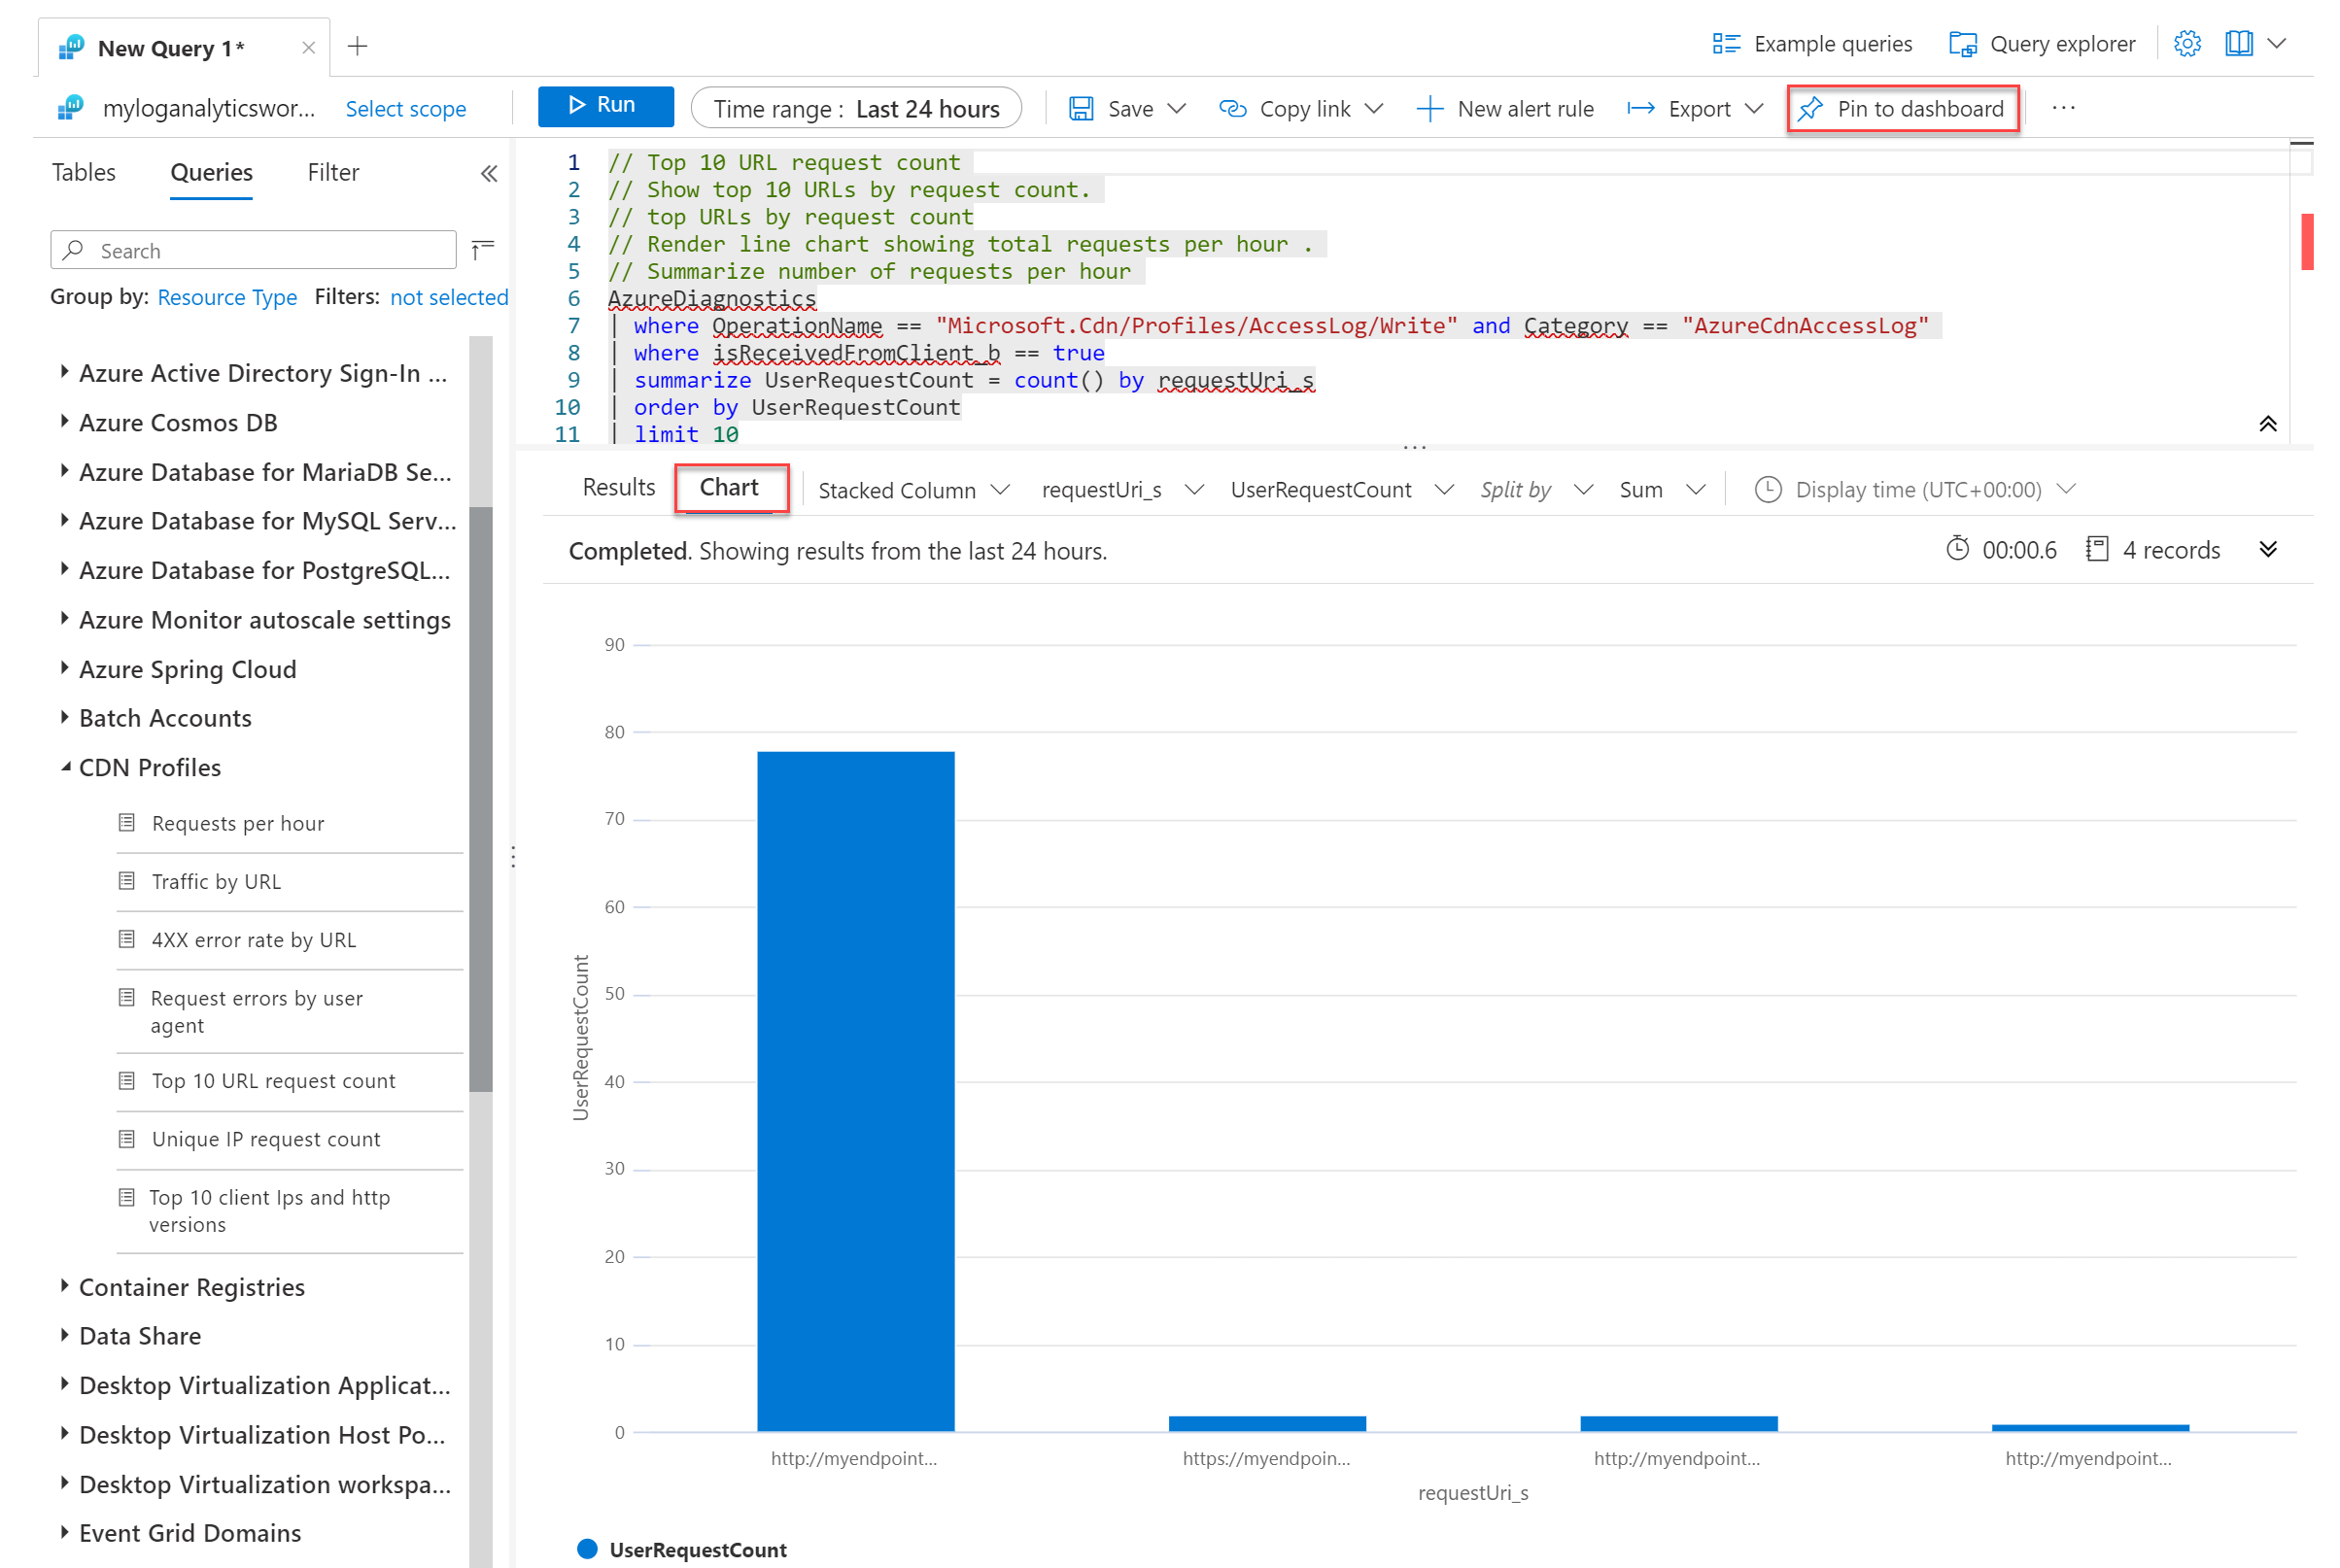
Select CDN Profiles. Select an example query to RUN or close the example screen to enter a custom query:
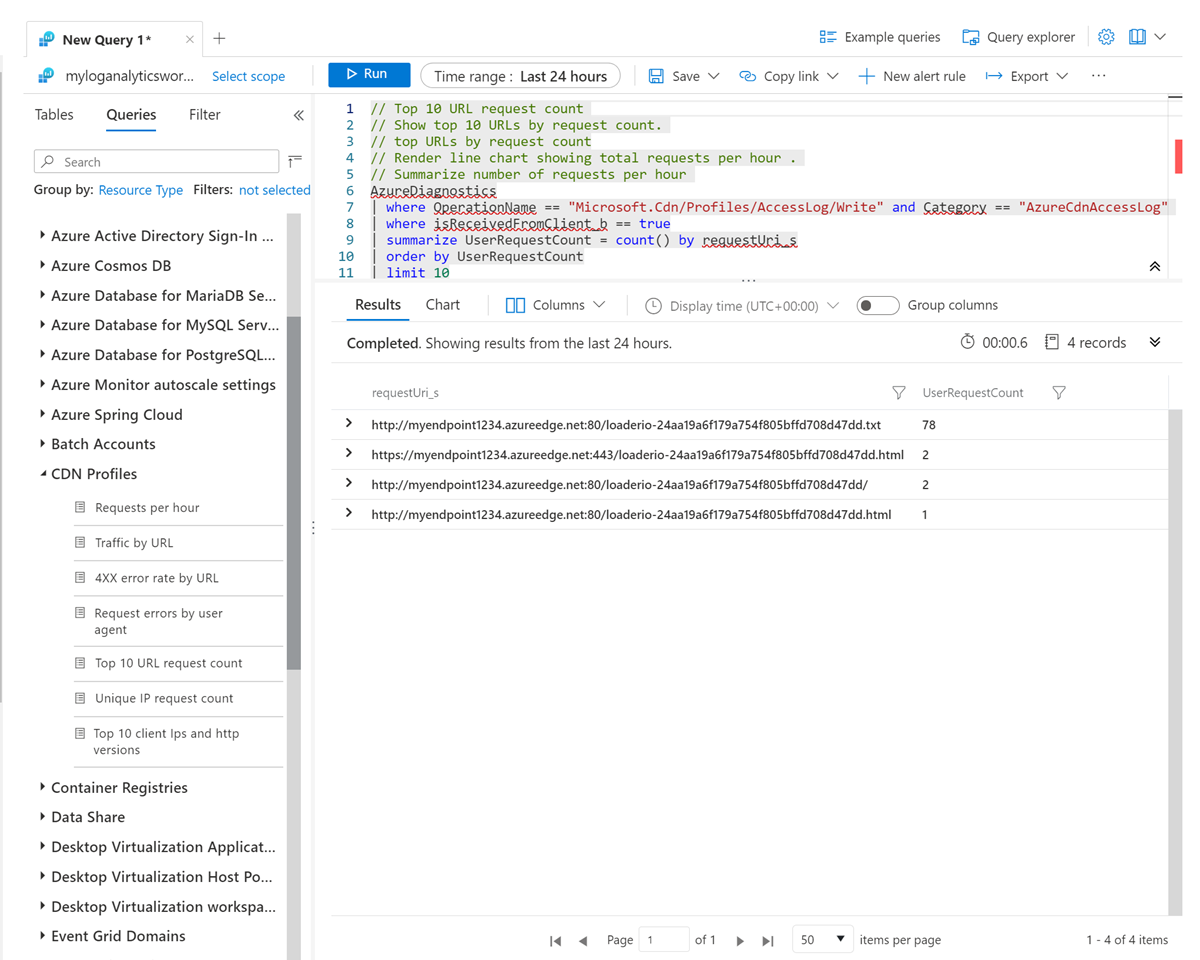
To view data by chart, select Chart. Select Pin to dashboard to pin the chart to the Azure dashboard:
Next Steps
In this article, you enabled HTTP raw logs for the Microsoft CDN service.
For more information on Azure CDN and the other Azure services mentioned in this article, see:
Analyze Azure CDN usage patterns.
Learn more about Azure Monitor.
Configure Log Analytics in Azure Monitor.
Feedback
Coming soon: Throughout 2024 we will be phasing out GitHub Issues as the feedback mechanism for content and replacing it with a new feedback system. For more information see: https://aka.ms/ContentUserFeedback.
Submit and view feedback for