Note
Access to this page requires authorization. You can try signing in or changing directories.
Access to this page requires authorization. You can try changing directories.
Azure Monitor collects metric data from your container app at regular intervals to help you gain insights into the performance and health of your container app.
The metrics explorer in the Azure portal allows you to visualize the data. You can also retrieve raw metric data through the Azure CLI and Azure PowerShell cmdlets.
Available metrics
Container Apps provide these basic metrics.
| Title | Dimensions | Description | Metric ID | Unit |
|---|---|---|---|---|
| CPU Usage | Replica, Revision | CPU consumed by the container app, in nano cores (1,000,000,000 nanocores = 1 core) | UsageNanoCores |
Nanocores |
| Memory Working Set Bytes | Replica, Revision | Container app working set memory used in bytes | WorkingSetBytes |
Bytes |
| Network In Bytes | Replica, Revision | Network received bytes | RxBytes |
Bytes |
| Network Out Bytes | Replica, Revision | Network transmitted bytes | TxBytes |
Bytes |
| Replica count | Revision | Number of active replicas | Replicas |
Count |
| Total Replica Restart Count | Replica, Revision | Total number of restarts for app container instances only, excluding platform-managed sidecar containers | RestartCount |
Count |
| Requests | Replica, Revision, Status Code, Status Code Category | Requests processed | Requests |
Count |
| Reserved Cores | Revision | Number of reserved cores for container app revisions | CoresQuotaUsed |
Count |
| Resiliency Connection Timeouts | Revision | Total connection timeouts | ResiliencyConnectTimeouts |
Count |
| Resiliency Ejected Hosts | Revision | Number of currently ejected hosts | ResiliencyEjectedHosts |
Count |
| Resiliency Ejections Aborted | Revision | Number of ejections aborted due to the max ejection % | ResiliencyEjectionsAborted |
Count |
| Resiliency Request Retries | Revision | Total request retries | ResiliencyRequestRetries |
Count |
| Resiliency Request Timeouts | Revision | Total requests that timed out waiting for a response | ResiliencyRequestTimeouts |
Count |
| Resiliency Requests Pending Connection Pool | Replica | Total requests pending a connection pool connection | ResiliencyRequestsPendingConnectionPool |
Count |
| Total Reserved Cores | None | Total cores reserved for the container app | TotalCoresQuotaUsed |
Count |
| Average Response Time (Preview) | Status Code, Status Code Category | Average response time per status code | ResponseTime |
Milliseconds |
| CPU Usage Percentage (Preview) | Replica | Percentage of CPU limit used, in percentage points | CpuPercentage |
Percent |
| Memory Percentage (Preview) | Replica | Percentage of memory limit used, in percentage points | MemoryPercentage |
Percent |
The metrics namespace is Microsoft.App/containerapps.
Container Apps environments provides this basic metric. You can only view this metric in Azure Monitor metrics.
| Title | Dimensions | Description | Metric ID | Unit |
|---|---|---|---|---|
| Workload Profile Node Count (Preview) | Workload Profile Name | The node count per workload profile | NodeCount |
Count |
The metrics namespace is Microsoft.App/managedEnvironments.
More runtime specific metrics are available, Java metrics.
Metrics snapshots
Select the Monitoring tab on your app's Overview page to display charts showing your container app's current CPU, memory, and network utilization.
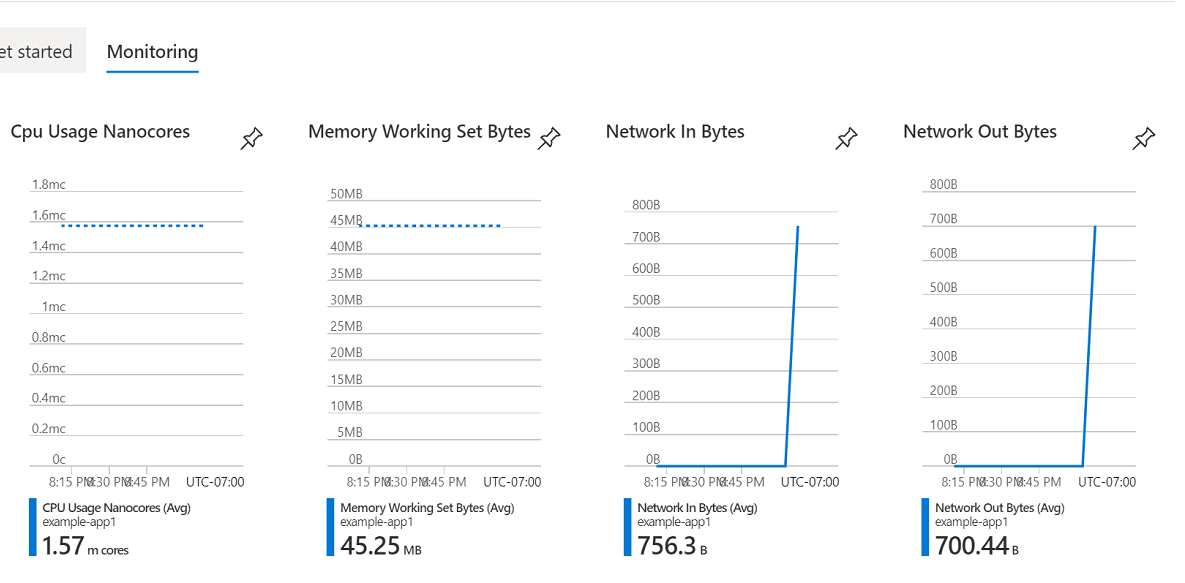
From this view, you can pin one or more charts to your dashboard or select a chart to open it in the metrics explorer.
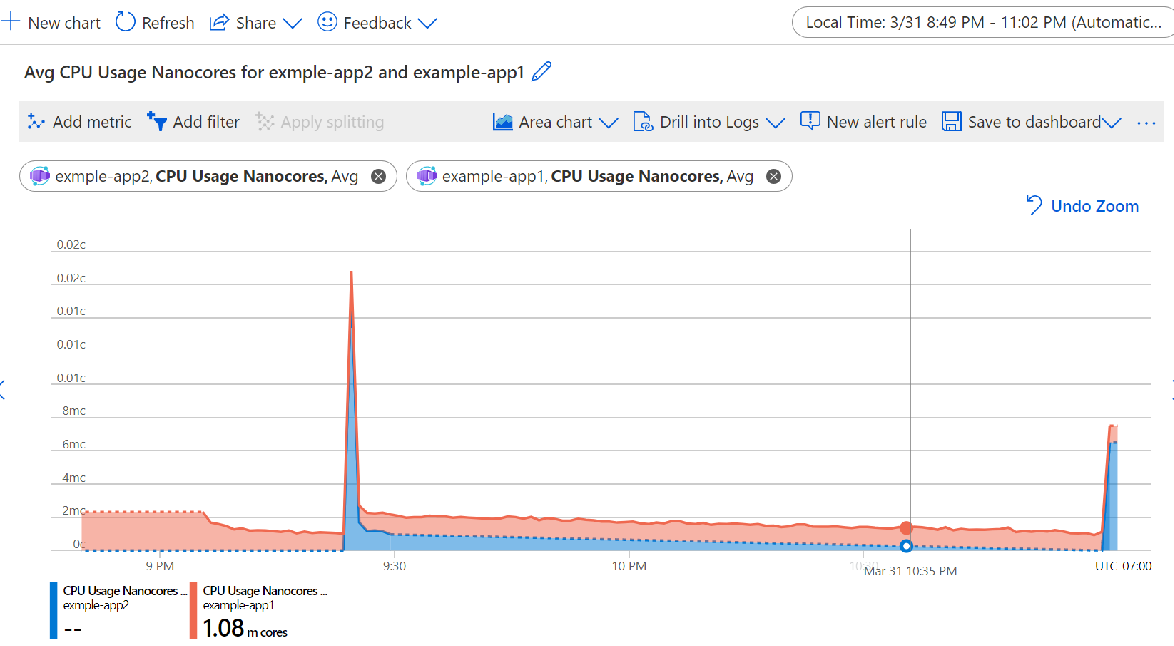
Using metrics explorer
The Azure Monitor metrics explorer lets you create charts from metric data to help you analyze your container app's resource and network usage over time. You can pin charts to a dashboard or in a shared workbook.
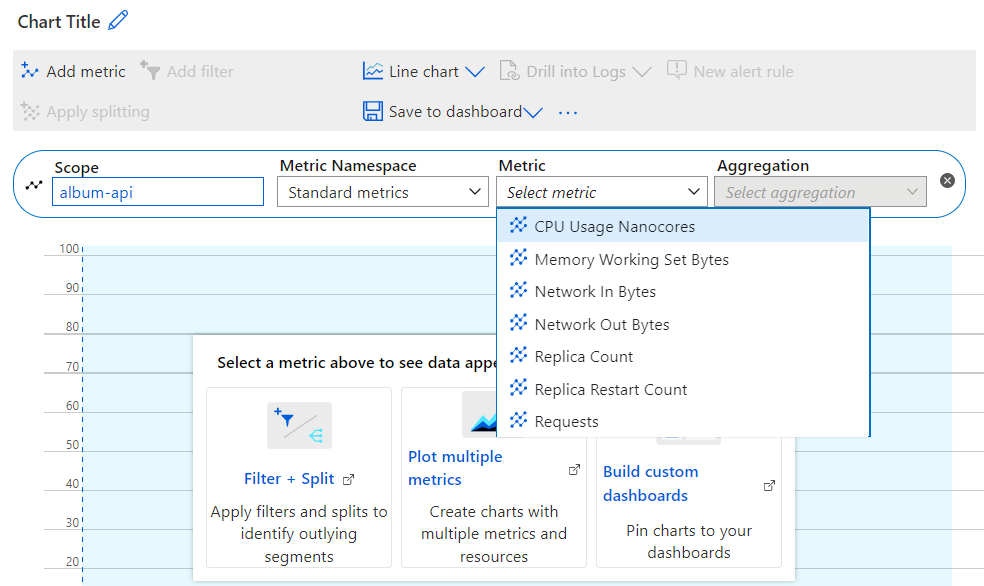
Open the metrics explorer in the Azure portal by selecting Metrics from the sidebar menu on your container app's page. To learn more about metrics explorer, see Analyze metrics with Azure Monitor metrics explorer.
Create a chart by selecting Metric. You can modify the chart by changing aggregation, adding more metrics, changing time ranges and intervals, adding filters, and applying splitting.
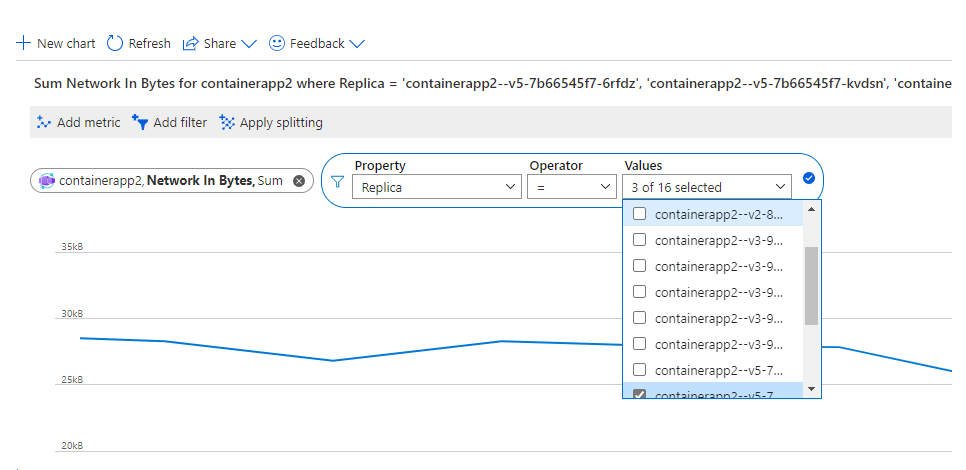
Add filters
Optionally, you can create filters to limit the data shown based on revisions and replicas.
To create a filter:
Select Add filter.
Select a revision or replica from the Property list.
Select values from the Value list.
Split metrics
When your chart contains a single metric, you can choose to split the metric information by revision or replica with the exceptions:
- The Replica count metric can only split by revision.
- The Requests metric can also be split on the status code and status code category.
To split by revision or replica:
Select Apply splitting.
From the Values drop-down list, select Revision or Replica.
You can set the limit of the number of revisions or replicas to display in the chart. The default value is 10.
You can set sort order to Ascending or Descending. The default value is Descending.
Add scopes
You can add more scopes to view metrics across multiple container apps.