How to audit Azure Cosmos DB control plane operations
APPLIES TO:
![]() NoSQL
NoSQL
![]() MongoDB
MongoDB
![]() Cassandra
Cassandra
![]() Gremlin
Gremlin
![]() Table
Table
Control Plane in Azure Cosmos DB is a RESTful service that enables you to perform a diverse set of operations on the Azure Cosmos DB account. It exposes a public resource model (for example: database, account) and various operations to the end users to perform actions on the resource model. The control plane operations include changes to the Azure Cosmos DB account or container. For example, operations such as create an Azure Cosmos DB account, add a region, update throughput, region failover, add a VNet etc. are some of the control plane operations. This article explains how to audit the control plane operations in Azure Cosmos DB. You can run the control plane operations on Azure Cosmos DB accounts by using Azure CLI, PowerShell or Azure portal, whereas for containers, use Azure CLI or PowerShell.
The following are some example scenarios where auditing control plane operations is helpful:
You want to get an alert when the firewall rules for your Azure Cosmos DB account are modified. The alert is required to find unauthorized modifications to rules that govern the network security of your Azure Cosmos DB account and take quick action.
You want to get an alert if a new region is added or removed from your Azure Cosmos DB account. Adding or removing regions has implications on billing and data sovereignty requirements. This alert will help you detect an accidental addition or removal of region on your account.
You want to get more details from the diagnostic logs on what has changed. For example, a VNet was changed.
Disable key based metadata write access
Before you audit the control plane operations in Azure Cosmos DB, disable the key-based metadata write access on your account. When key based metadata write access is disabled, clients connecting to the Azure Cosmos DB account through account keys are prevented from accessing the account. You can disable write access by setting the disableKeyBasedMetadataWriteAccess property to true. After you set this property, changes to any resource can happen from a user with the proper Azure role and credentials.
After the disableKeyBasedMetadataWriteAccess is turned on, if the SDK based clients run create or update operations, an error "Operation 'POST' on resource 'ContainerNameorDatabaseName' is not allowed through Azure Cosmos DB endpoint is returned. You have to turn on access to such operations for your account, or perform the create/update operations through Azure Resource Manager, Azure CLI or Azure PowerShell. To switch back, set the disableKeyBasedMetadataWriteAccess to false by using Azure CLI. Make sure to change the value of disableKeyBasedMetadataWriteAccess to false instead of true.
Consider the following points when turning off the metadata write access:
Evaluate and ensure that your applications do not make metadata calls that change the above resources (For example, create collection, update throughput, …) by using the SDK or account keys.
When
disableKeyBasedMetadataWriteAccessis set to true, the metadata operations issued by the SDK are blocked. Alternatively, you can use Azure portal, Azure CLI, Azure PowerShell, or Azure Resource Manager template deployments to perform these operations.
Enable diagnostic logs for control plane operations
You can enable diagnostic logs for control plane operations by using the Azure portal. After enabling, the diagnostic logs will record the operation as a pair of start and complete events with relevant details. For example, the RegionFailoverStart and RegionFailoverComplete will complete the region failover event.
Use the following steps to enable logging on control plane operations:
Sign in to the Azure portal and navigate to your Azure Cosmos DB account.
Open the Diagnostic settings pane, provide a Name for the logs to create.
Select ControlPlaneRequests for log type and select the Send to Log Analytics option.
Optionally, send the diagnostic logs to Azure Storage, Azure Event Hubs, Azure Monitor, or a third party.
You can also store the logs in a storage account or stream to an event hub. This article shows how to send logs to log analytics and then query them. After you enable, it takes a few minutes for the diagnostic logs to take effect. All the control plane operations performed after that point can be tracked. The following screenshot shows how to enable control plane logs:

View the control plane operations
After you turn on logging, use the following steps to track down operations for a specific account:
Sign in to the Azure portal.
Open the Monitor tab from the left-hand navigation and then select the Logs pane. It opens a UI where you can easily run queries with that specific account in scope. Run the following query to view control plane logs:
AzureDiagnostics
| where ResourceProvider=="MICROSOFT.DOCUMENTDB" and Category=="ControlPlaneRequests"
| where TimeGenerated >= ago(1h)
The following screenshots capture logs when a consistency level is changed for an Azure Cosmos DB account. The
activityId_gvalue from results is different from the activity ID of an operation: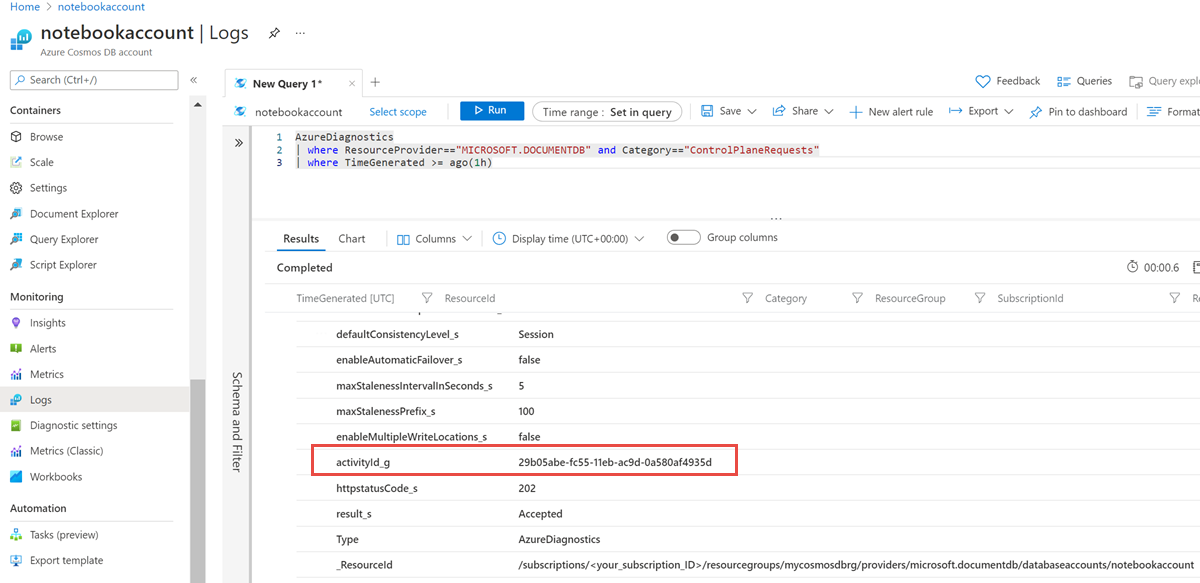
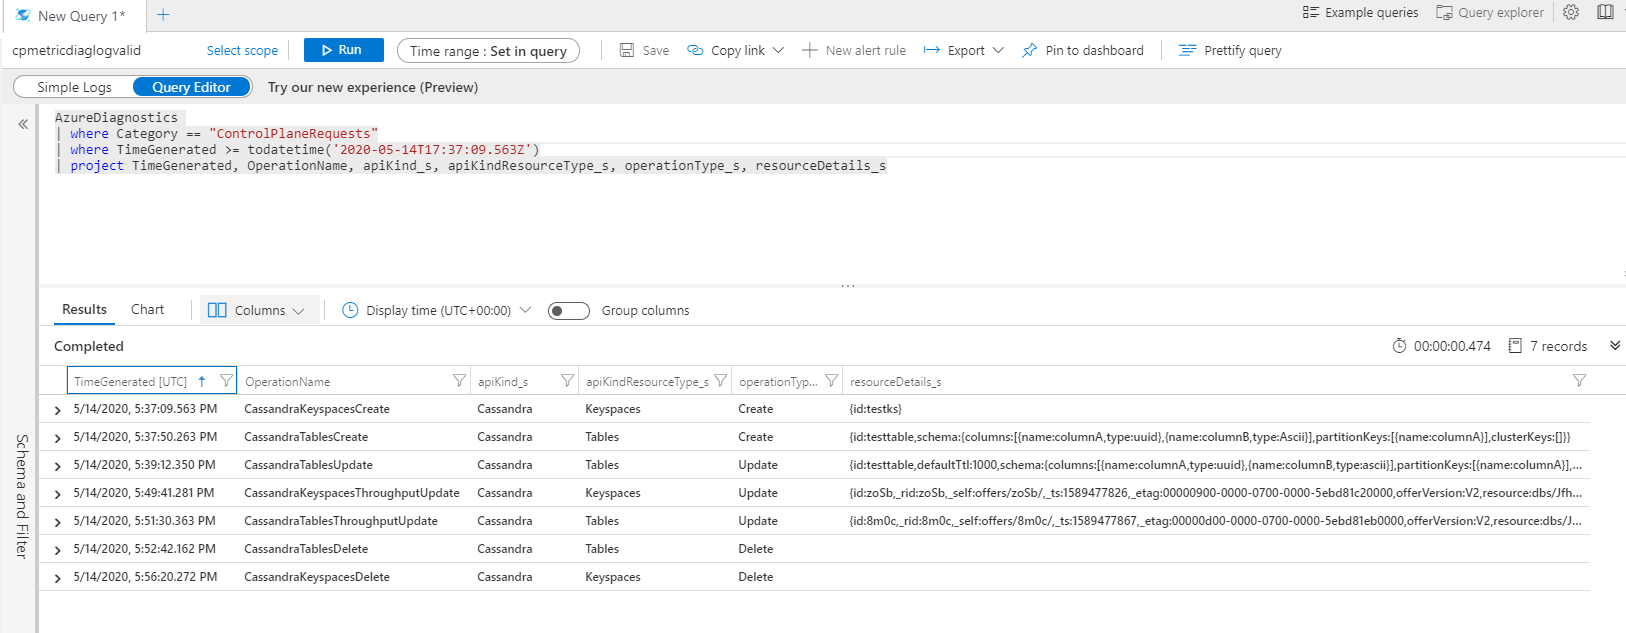
The following screenshots capture logs when the keyspace or a table of a Cassandra account are created and when the throughput is updated. The control plane logs for create and update operations on the database and the container are logged separately as shown in the following screenshot:
Identify the identity associated to a specific operation
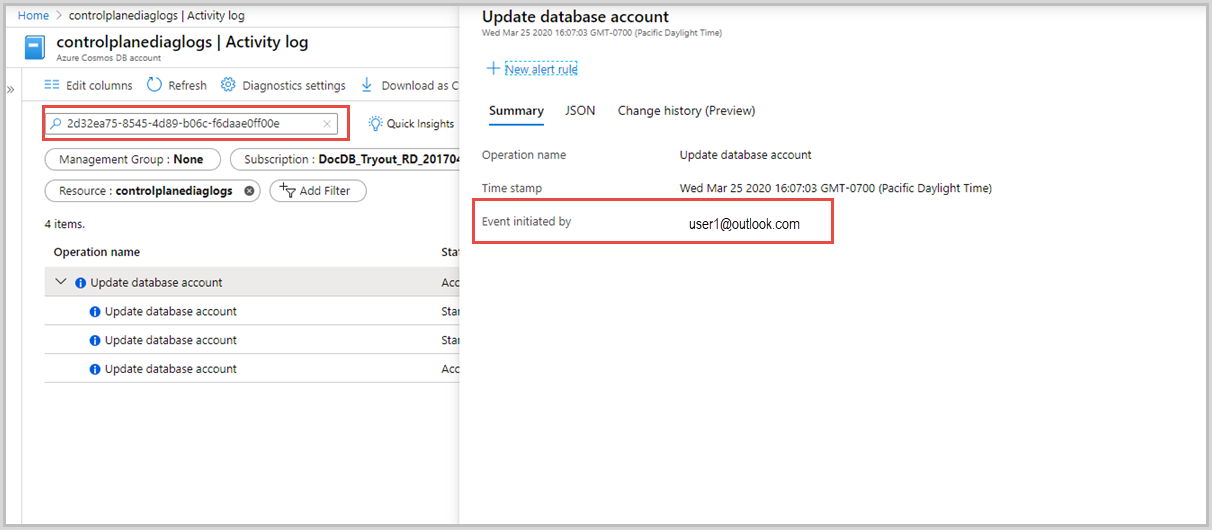
If you want to debug further, you can identify a specific operation in the Activity log by using the activityId_g or by the timestamp of the operation. Timestamp is used for some Resource Manager clients where the activity ID is not explicitly passed. The Activity log gives details about the identity with which the operation was initiated. The following screenshot shows how to use the activityId_g to find the operations associated with it in the Activity log:
Control plane operations for Azure Cosmos DB account
The following are the control plane operations available at the account level. Most of the operations are tracked at account level. These operations are available as metrics in Azure monitor:
- Region added
- Region removed
- Account deleted
- Region failed over
- Account created
- Virtual network deleted
- Account network settings updated
- Account replication settings updated
- Account keys updated
- Account backup settings updated
- Account diagnostic settings updated
Control plane operations for database or containers
The following are the control plane operations available at the database and container level. These operations are available as metrics in Azure monitor:
- SQL Database Created
- SQL Database Updated
- SQL Database Throughput Updated
- SQL Database Deleted
- SQL Container Created
- SQL Container Updated
- SQL Container Throughput Updated
- SQL Container Deleted
- Cassandra Keyspace Created
- Cassandra Keyspace Updated
- Cassandra Keyspace Throughput Updated
- Cassandra Keyspace Deleted
- Cassandra Table Created
- Cassandra Table Updated
- Cassandra Table Throughput Updated
- Cassandra Table Deleted
- Gremlin Database Created
- Gremlin Database Updated
- Gremlin Database Throughput Updated
- Gremlin Database Deleted
- Gremlin Graph Created
- Gremlin Graph Updated
- Gremlin Graph Throughput Updated
- Gremlin Graph Deleted
- Mongo Database Created
- Mongo Database Updated
- Mongo Database Throughput Updated
- Mongo Database Deleted
- Mongo Collection Created
- Mongo Collection Updated
- Mongo Collection Throughput Updated
- Mongo Collection Deleted
- AzureTable Table Created
- AzureTable Table Updated
- AzureTable Table Throughput Updated
- AzureTable Table Deleted
Diagnostic log operations
The following are the operation names in diagnostic logs for different operations:
- RegionAddStart, RegionAddComplete
- RegionRemoveStart, RegionRemoveComplete
- AccountDeleteStart, AccountDeleteComplete
- RegionFailoverStart, RegionFailoverComplete
- AccountCreateStart, AccountCreateComplete
- AccountUpdateStart, AccountUpdateComplete
- VirtualNetworkDeleteStart, VirtualNetworkDeleteComplete
- DiagnosticLogUpdateStart, DiagnosticLogUpdateComplete
For API-specific operations, the operation is named with the following format:
- ApiKind + ApiKindResourceType + OperationType
- ApiKind + ApiKindResourceType + "Throughput" + operationType
Example
- CassandraKeyspacesCreate
- CassandraKeyspacesUpdate
- CassandraKeyspacesThroughputUpdate
- SqlContainersUpdate
The ResourceDetails property contains the entire resource body as a request payload and it contains all the properties requested to update
Diagnostic log queries for control plane operations
The following are some examples to get diagnostic logs for control plane operations:
AzureDiagnostics
| where Category startswith "ControlPlane"
| where OperationName contains "Update"
| project httpstatusCode_s, statusCode_s, OperationName, resourceDetails_s, activityId_g
AzureDiagnostics
| where Category =="ControlPlaneRequests"
| where TimeGenerated >= todatetime('2020-05-14T17:37:09.563Z')
| project TimeGenerated, OperationName, apiKind_s, apiKindResourceType_s, operationType_s, resourceDetails_s
AzureDiagnostics
| where Category == "ControlPlaneRequests"
| where OperationName startswith "SqlContainersUpdate"
AzureDiagnostics
| where Category == "ControlPlaneRequests"
| where OperationName startswith "SqlContainersThroughputUpdate"
Query to get the activityId and the caller who initiated the container delete operation:
(AzureDiagnostics
| where Category == "ControlPlaneRequests"
| where OperationName == "SqlContainersDelete"
| where TimeGenerated >= todatetime('9/3/2020, 5:30:29.300 PM')
| summarize by activityId_g )
| join (
AzureActivity
| parse HTTPRequest with * "clientRequestId\": \"" activityId_g "\"" *
| summarize by Caller, HTTPRequest, activityId_g)
on activityId_g
| project Caller, activityId_g
Query to get index or ttl updates. You can then compare the output of this query with an earlier update to see the change in index or ttl.
AzureDiagnostics
| where Category =="ControlPlaneRequests"
| where  OperationName == "SqlContainersUpdate"
| project resourceDetails_s
output:
{id:skewed,indexingPolicy:{automatic:true,indexingMode:consistent,includedPaths:[{path:/*,indexes:[]}],excludedPaths:[{path:/_etag/?}],compositeIndexes:[],spatialIndexes:[]},partitionKey:{paths:[/pk],kind:Hash},defaultTtl:1000000,uniqueKeyPolicy:{uniqueKeys:[]},conflictResolutionPolicy:{mode:LastWriterWins,conflictResolutionPath:/_ts,conflictResolutionProcedure:}