Note
Access to this page requires authorization. You can try signing in or changing directories.
Access to this page requires authorization. You can try changing directories.
APPLIES TO:
![]() Gremlin
Gremlin
You can visualize data stored in Azure Cosmos DB for Gremlin by using various data visualization solutions.
Important
Solutions mentioned in this article are for information purpose only, the ownership lies to individual solution owner. We recommend users to do thorough evaluation and then select most suitable to you.
Linkurious Enterprise
Linkurious Enterprise uses graph technology and data visualization to turn complex datasets into interactive visual networks. The platform connects to your data sources and enables investigators to seamlessly navigate across billions of entities and relationships. The result is a new ability to detect suspicious relationships without juggling with queries or tables.
The interactive interface of Linkurious Enterprise offers an easy way to investigate complex data. You can search for specific entities, expand connections to uncover hidden relationships, and apply layouts of your choice to untangle complex networks. Linkurious Enterprise is now compatible with Azure Cosmos DB for Gremlin. It's suitable for end-to-end graph visualization scenarios and supports read and write capabilities from the user interface. You can request a demo of Linkurious with Azure Cosmos DB
Figure: Linkurious Enterprise visualization flow
Useful links
Cambridge Intelligence
Cambridge Intelligence’s graph visualization toolkits support Azure Cosmos DB. The following two visualization toolkits are supported by Azure Cosmos DB:
Figure: KeyLines visualization example at various levels of detail.
These toolkits let you design high-performance graph visualization and analysis applications. They harness powerful Web Graphics Library(WebGL) rendering and carefully crafted code to give users a fast and insightful visualization experience. These tools are compatible with any browser, device, server or database, and come with step-by-step tutorials, fully documented APIs, and interactive demos.
Figure: Re-Graph visualization example at various levels of details
Useful links
- Try the toolkits
- KeyLines technology overview
- Re-Graph technology overview
- Graph visualization use cases
Tom Sawyer
Tom Sawyer Perspectives is a robust platform for building enterprise grade graph data visualization and analysis applications. It is a low-code graph & data visualization development platform, which includes integrated design, preview interface, and extensive API libraries. The platform integrates enterprise data sources with powerful graph visualization, layout, and analysis technology to solve big data problems.
Perspectives enables developers to quickly develop production-quality, data-oriented visualization applications. Two graphic modules, the "Designer" and the "Previewer" are used to build applications to visualize and analyze the specific data that drives each project. When used together, the Designer and Previewer provide an efficient round-trip process that dramatically speeds up application development. To visualize Azure Cosmos DB for Gremlin data using this platform, request a free 60-day evaluation of this tool.
Figure: Tom Sawyer Perspectives in action
Tom Sawyer Graph Database Browser makes it easy to visualize and analyze data in Azure Cosmos DB for Gremlin. The Graph Database Browser helps you see and understand connections in your data without extensive knowledge of the query language or the schema. You can manually define the schema for your project or use schema extraction to create it. So, even less technical users can interact with the data by loading the neighbors of selected nodes and building the visualization in whatever direction they need. Advanced users can execute queries using Gremlin, Cypher, or SPARQL to gain other insights. When you define the schema then you can load the Azure Cosmos DB data into the Perspectives model. With the help of integrator definition, you can specify the location and configuration for the Gremlin endpoint. Later you can bind elements from the Azure Cosmos DB data source to elements in the Perspectives model and visualize your data.
Users of all skill levels can take advantage of five unique graph layouts to display the graph in a way that provides the most meaning. And there are built-in centrality, clustering, and path-finding analyses to reveal previously unseen patterns. Using these techniques, organizations can identify critical patterns in areas like fraud detection, customer intelligence, and cybersecurity. Pattern recognition is very important for network analysts in areas such as general IT and network management, logistics, legacy system migration, and business transformation. Try a live demo of Tom Sawyer Graph Database Browser.
Figure: Tom Sawyer Database Browser's visualization capabilities
Useful links
Graphistry
Graphistry automatically transforms your data into interactive, visual investigation maps built for the needs of analysts. It can quickly surface relationships between events and entities without having to write queries or wrangle data. You can harness your data without worrying about scale. You can detect security, fraud, and IT investigations to 3600 views of customers and supply chains, Graphistry turns the potential of your data into human insight and value.
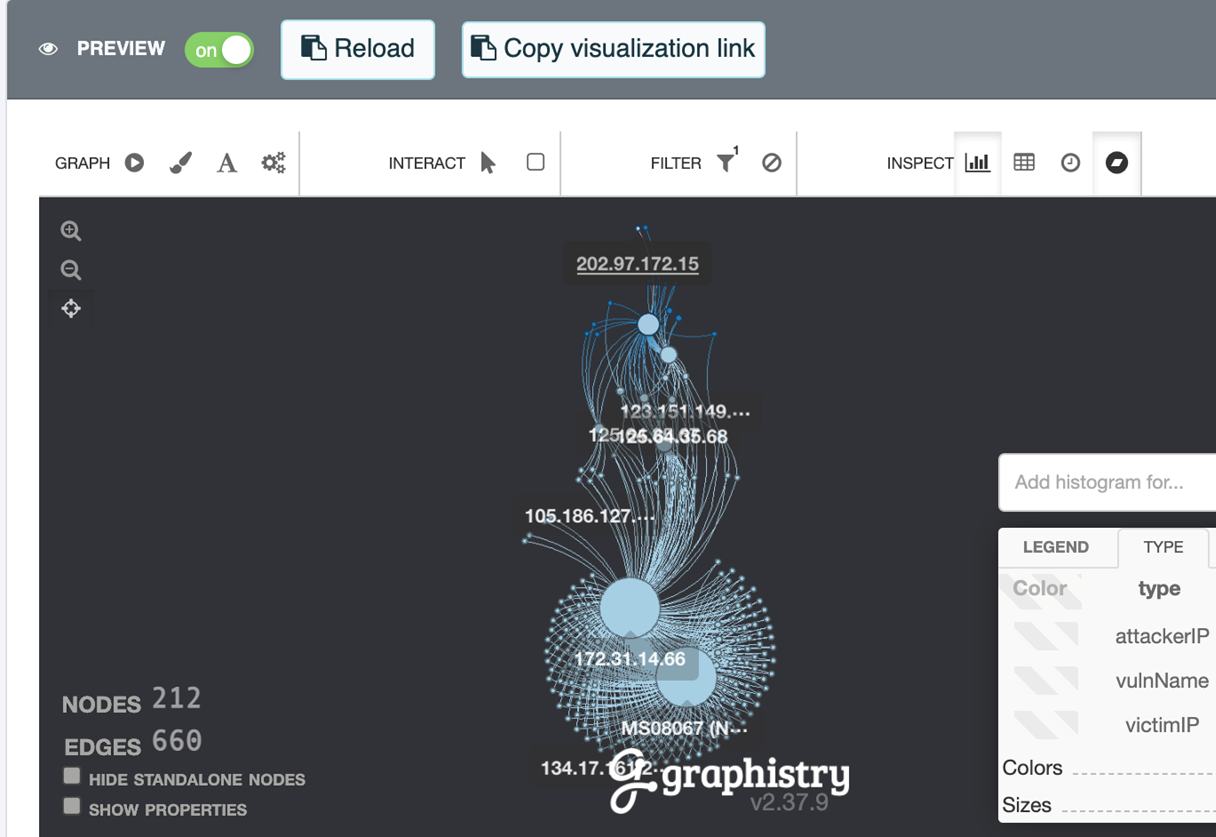
Figure: Graphistry Visualization snapshot
With the Graphistry's GPU client/cloud technology, you can do interactive visualization. By using their standard browser and the cloud, you can use all the data you want, and still remain fast, responsive, and interactive. If you want to run the browser on your hardware, it’s as easy as installing a Docker. That way you get the analytical power of GPUs without having to think about GPUs.
Figure: Graphistry in action
Useful links
Graphlytic
Graphlytic is a highly customizable web application for graph visualization and analysis. Users can interactively explore the graph, look for patterns with the Gremlin language, or use filters to find answers to any graph question. Graph rendering is done with the 'Cytoscape.js' library, which allows Graphlytic to render tens of thousands of nodes and hundreds of thousands of relationships at once.
Graphlytic is compatible with Azure Cosmos DB and can be deployed to Azure in minutes. Graphlytic’s UI can be customized and extended in many ways, for instance the default visualization configuration, data schema, style mappings, virtual properties in the visualization, or custom implemented widgets that can enhance the visualization features with bespoke reports or integrations.
The following are two example scenarios:
IT Management use case Companies running their IT operations on their own infrastructure, Telco, or IP providers, all need a solid network documentation and a functional configuration management. Impact analyses describing interdependencies among network elements (active and passive) are being developed to overcome blackouts, which cause significant financial losses, or even single outages causing no or low availability of service. Bottlenecks and single points of failure are determined and solved. Endpoint as well as route redundancies are being implemented. Graphlytic property graph visualization is a perfect enabler for all above mentioned points - network documentation, network configuration management, impact analysis and asset management. It stores and depicts all relevant network configuration information in one place, bringing a completely new added value to IT managers and field technicians.
Figure: Graphlytic IT management use case
Anti-fraud use case Fraud pattern is a well-known term to every single insurance company, bank or e-commerce enterprise. Modern fraudsters build sophisticated fraud rings and schemes that are hard to unveil with traditional tools. It can cause serious losses if not detected properly and on time. On the other hand, traditional red flag systems with too strict criteria must be adjusted to eliminate false positive indicators, as it would lead to overwhelming fraud indications. Great amounts of time are spent trying to detect complex fraud, paralyzing investigators in their daily tasks. The basic idea behind Graphlytic is the fact that the human eye can simply distinguish and find any pattern in a graphical form much easier than in any table or data set. It means that the antifraud analyst can capture fraud schemes within graph visualization more easily, faster and smarter than with solely traditional tools.
Figure: Graphlytic Fraud detection use case demo
Useful links
- Documentation
- Free Online Demo
- Blog
- REST API documentation
- ETL job drivers & examples
- SMTP Email Server Integration
- Geo Map Server Integration
- Single Sign-on Configuration
yWorks
yWorks specializes in the development of professional software solutions that enable the clear visualization of graphs, diagrams, and networks. yWorks has brought together efficient data structures, complex algorithms, and advanced techniques that provide excellent user interaction on a multitude of target platforms. This allows the user to experience highly versatile and sophisticated diagram visualization in applications across many diverse areas.
Azure Cosmos DB can be queried for data using Gremlin, an efficient graph traversal language. The user can query the database for the stored entities and use the relationships to traverse the connected neighborhood. This approach requires in-depth technical knowledge of the database itself and also the query language Gremlin to explore the stored data. Where as with yWorks visualization you can visually explore the Azure Cosmos DB data, identify significant structures, and get a better understanding of relationships. Besides the visual exploration, you can also interactively edit the stored data by modifying the diagram without any knowledge of the associated query language like Gremlin. This way it provides a high-quality visualization and can analyze large data sets from Azure Cosmos DB data. You can use yFiles to add visualization capabilities to your own applications, dashboards, and reports, or to create new, white-label apps and tools for both in-house and customer facing products.
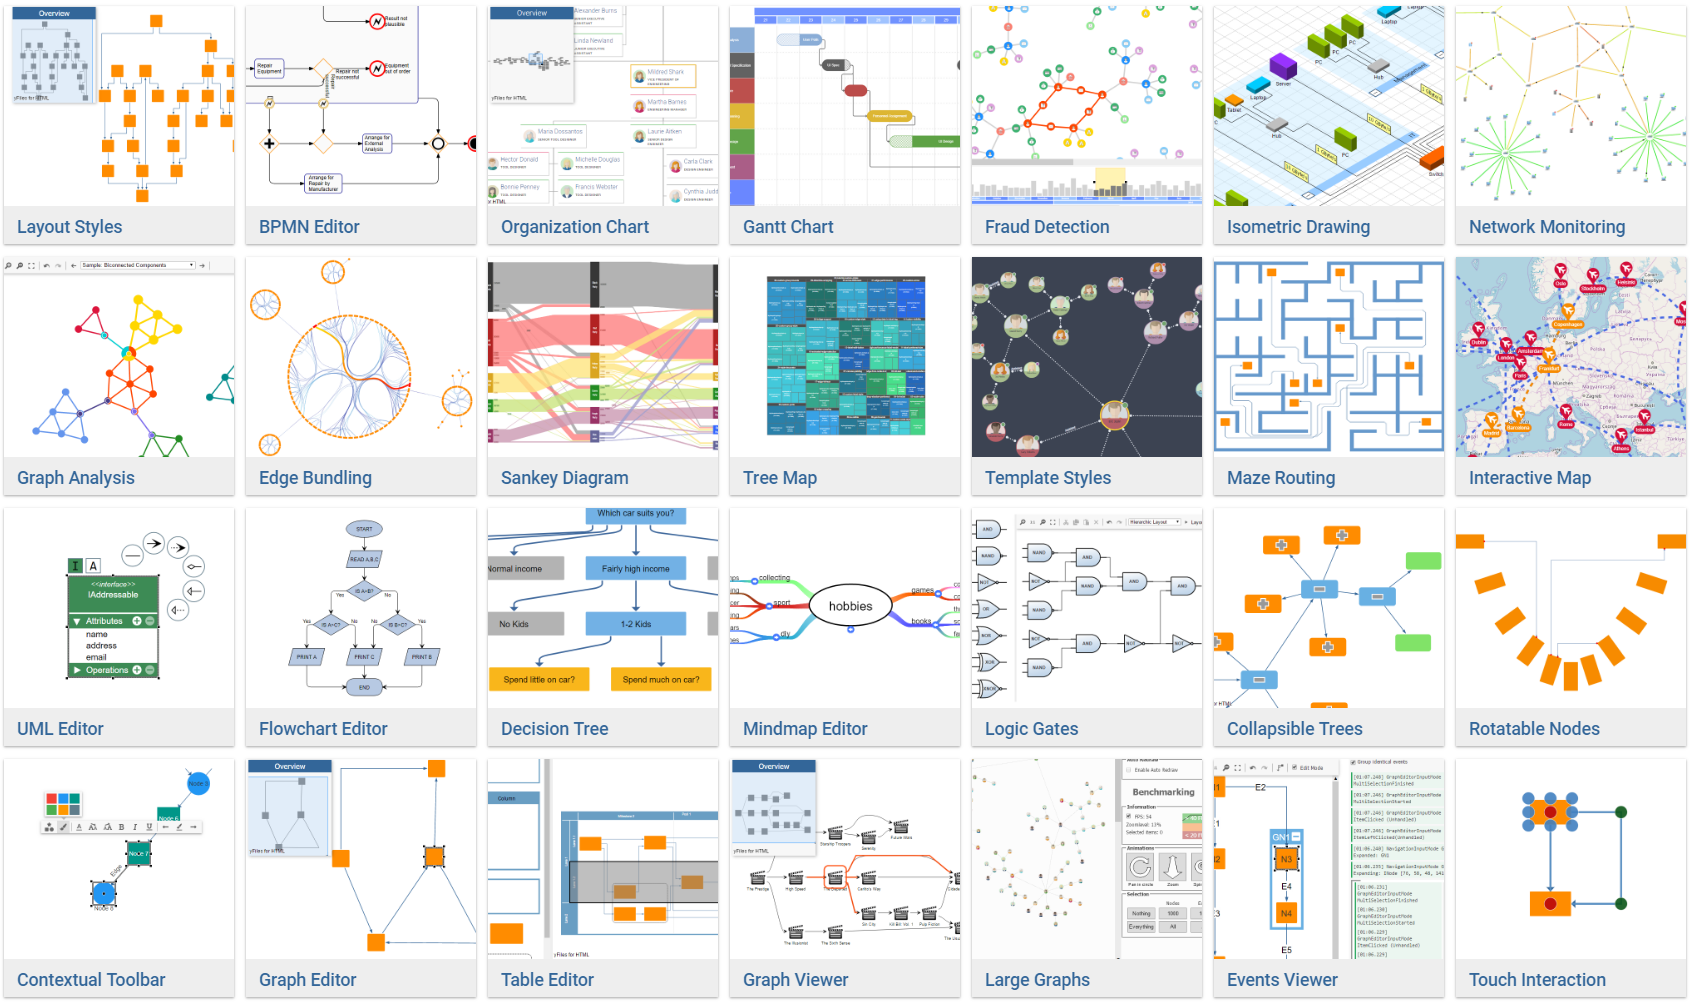
Figure: yWorks visualization snapshot
With yWorks, you can create meaningful visualizations that help users gain insights into the data quickly and easily. Build interactive user-interfaces that match your company's corporate design and easily connect to existing infrastructure and services. Use highly sophisticated automatic graph layouts to generate clear visualizations of the data hidden in your Azure Cosmos DB account. Efficient implementations of the most important graph analysis algorithms enable the creation of responsive user interfaces that highlight the information the user is interested in or needs to be aware of. Use yFiles to create interactive apps that work on desktops, and mobile devices alike.
Typical use-cases and data models include:
- Social networks, money laundering data, and cash-flow networks, where similar entities are connected to each other
- Process data where entities are being processed and move from one state to another
- organizational charts and networks, showing team hierarchies, but also majority ownership dependencies and relationships between companies or customers
- data lineage information & compliance data can be visualized, reviewed & audited
- computer networks logs, website logs, customer journey logs
- knowledge graphs, stored as triplets and in other formats
- Product Lifecycle Management data
- Bill of Material lists and Supply Chain data