Note
Access to this page requires authorization. You can try signing in or changing directories.
Access to this page requires authorization. You can try changing directories.
Important
Azure Cosmos DB for PostgreSQL is no longer supported for new projects. Don't use this service for new projects. Instead, use one of these two services:
Use Azure Cosmos DB for NoSQL for a distributed database solution designed for high-scale scenarios with a 99.999% availability service level agreement (SLA), instant autoscale, and automatic failover across multiple regions.
Use the Elastic Clusters feature of Azure Database For PostgreSQL for sharded PostgreSQL using the open-source Citus extension.
Resource metrics are available for every node of a cluster, and in aggregate across the nodes.
View metrics
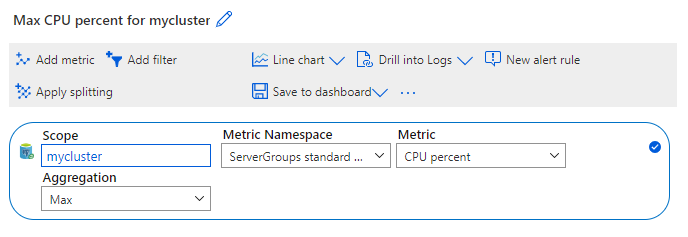
To access metrics for a cluster, open Metrics under Monitoring in the Azure portal.
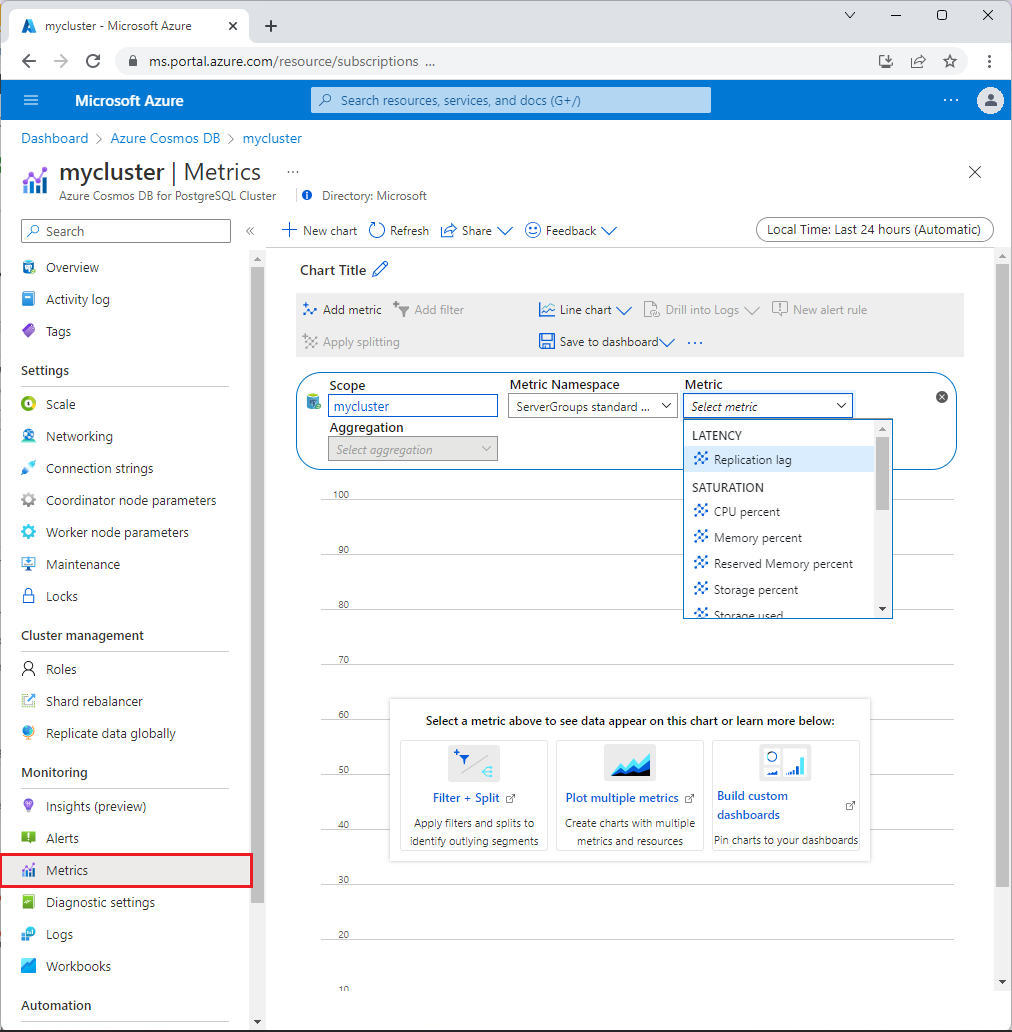
Choose a dimension and an aggregation, for instance CPU percent and Max, to view the metric aggregated across all nodes. For an explanation of each metric, see here.
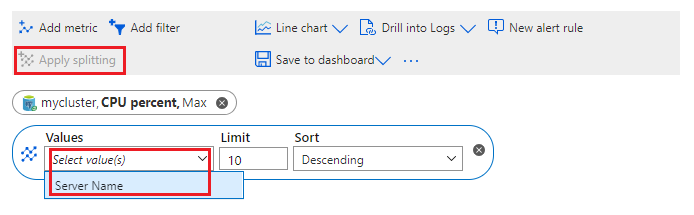
View metrics per node
Viewing each node's metrics separately on the same graph is called splitting. To enable splitting, select Apply splitting, and then select the value by which to split. For nodes, choose Server name.
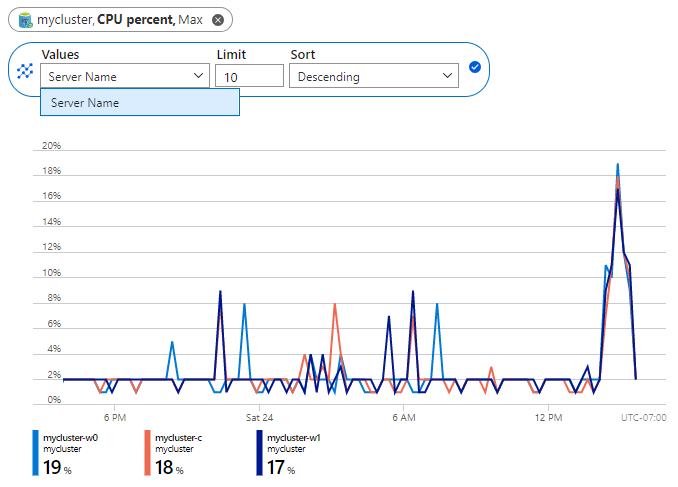
The metrics will now be plotted in one color-coded line per node.
Next steps
- Review Azure Cosmos DB for PostgreSQL monitoring concepts.