Enable preview features in Cost Management Labs

Cost Management Labs is an experience in the Azure portal where you can get a sneak peek at what's coming in Cost Management. You can engage directly with us to share feedback and help us better understand how you use the service, so we can deliver more tuned and optimized experiences.

This article explains how to explore preview features and provides a list of the recent previews you might be interested in.

Explore preview features

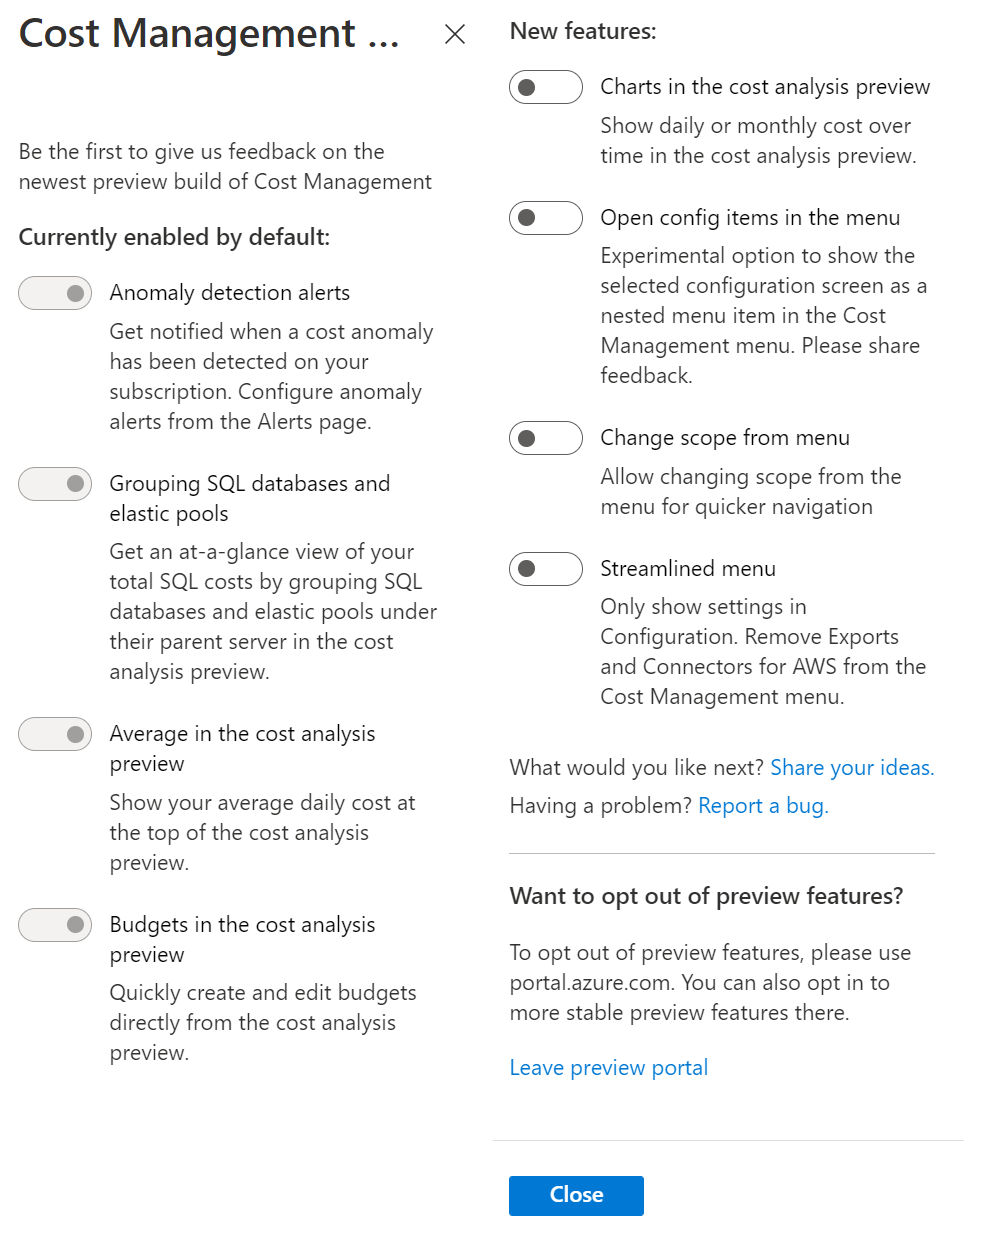
You can explore preview features from the Cost Management overview.

  1. On the Cost Management overview page, select the Try preview command at the top of the page.
  2. From there, enable the features you'd like to use and select Close at the bottom of the page.
    Screenshot showing the Cost Management labs preview options.
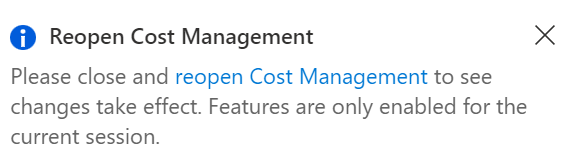
  3. To see the features enabled, close and reopen Cost Management. You can reopen Cost Management by selecting the link in the notification in the top-right corner.
    Screenshot showing the Reopen Cost Management notification.

If you're interested in getting preview features even earlier:

  1. Navigate to Cost Management.
  2. Select Go to preview portal.

Or, you can go directly to the Azure preview portal.

It's the same experience as the public portal, except with new improvements and preview features. Every change in Cost Management is available in the preview portal a week before it's in the full Azure portal.

We encourage you to try out the preview features available in Cost Management Labs and share your feedback. It's your chance to influence the future direction of Cost Management. To provide feedback, use the Report a bug link in the Try preview menu. It's a direct way to communicate with the Cost Management engineering team.

Remember preview features across sessions

Cost Management now remembers preview features across sessions in the preview portal. Select the preview features you're interested in from the Try preview menu and you'll see them enabled by default the next time you visit the portal. There's no need to enable the option – preview features are remembered automatically.

Total KPI tooltip

View more details about what costs are included and not included in the Cost analysis preview. You can enable this option from the Try Preview menu.

The Total KPI tooltip can be enabled from the Try preview menu in the Azure portal. Use the How would you rate the cost analysis preview? option at the bottom of the page to share feedback about the preview.

Cloud Solution Provider (CSP) partners can view a breakdown of costs by customer and subscription in the Cost analysis preview. Note this view is only available for Microsoft Partner Agreement (MPA) billing accounts and billing profiles.

The Customers view can be enabled from the Try preview menu in the Azure portal. Use the How would you rate the cost analysis preview? option at the bottom of the page to share feedback about the preview.

Anomaly detection alerts

Get notified by email when a cost anomaly is detected on your subscription.

Anomaly detection is available for Azure global subscriptions in the cost analysis preview.

Here's an example of a cost anomaly shown in cost analysis:

Screenshot showing an example cost anomaly.

To configure anomaly alerts:

  1. Open the cost analysis preview.
  2. Navigate to Cost alerts and select Add > Add Anomaly alert.

Screenshot showing Add anomaly alert navigation.

For more information about anomaly detection and how to configure alerts, see Identify anomalies and unexpected changes in cost.

Anomaly detection is now available by default in Azure global.

Recent and pinned views in the cost analysis preview

Cost analysis is your tool for interactive analytics and insights. You've seen the addition of new views and capabilities, like anomaly detection, in the cost analysis preview. However, classic cost analysis is still the best tool for quick data exploration with simple filtering and grouping. While these capabilities are coming to the preview, we're introducing a new experience that allows you to select which view you want to start with. Whether that is a preview view, a built-in view, or a custom view you created.

The first time you open the cost analysis preview, you see a list of all views. When you return, you see a list of the recently used views to help you get back to where you left off quicker than ever. You can pin any view or even rename or subscribe to alerts for your saved views.

Recent and pinned views are available by default in the cost analysis preview. Use the How would you rate the cost analysis preview? option at the bottom of the page to share feedback.

Grouping SQL databases and elastic pools

Get an at-a-glance view of your total SQL costs by grouping SQL databases and elastic pools. They're shown under their parent server in the cost analysis preview. This feature is enabled by default.

Understanding what you're being charged for can be complicated. The best place to start for many people is the Resources view in the cost analysis preview. It shows resources that are incurring cost. But even a straightforward list of resources can be hard to follow when a single deployment includes multiple, related resources. To help summarize your resource costs, we're trying to group related resources together. So, we're changing cost analysis to show child resources.

Many Azure services use nested or child resources. SQL servers have databases, storage accounts have containers, and virtual networks have subnets. Most of the child resources are only used to configure services, but sometimes the resources have their own usage and charges. SQL databases are perhaps the most common example.

SQL databases are deployed as part of a SQL server instance, but usage is tracked at the database level. Additionally, you might also have charges on the parent server, like for Microsoft Defender for Cloud. To get the total cost for your SQL deployment in classic cost analysis, you need to manually sum up the cost of the server and each individual database. As an example, you can see the aepool elastic pool at the top of the following list and the treyanalyticsengine server lower down on the first page. What you don't see is another database even lower in the list. You can imagine how troubling this situation would be when you need the total cost of a large server instance with many databases.

Here's an example showing classic cost analysis where multiple related resource costs aren't grouped.

Screenshot showing classic cost analysis where multiple related resource costs aren't grouped.

In the cost analysis preview, the child resources are grouped together under their parent resource. The grouping shows a quick, at-a-glance view of your deployment and its total cost. Using the same subscription, you can now see all three charges grouped together under the server, offering a one-line summary for your total server costs.

Here's an example showing grouped resource costs with the Grouping SQL databases and elastic pools preview option enabled.

Screenshot showing grouped resource costs.

You might also notice the change in row count. Classic cost analysis shows 53 rows where every resource is broken out on its own. The cost analysis preview only shows 25 rows. The difference is that the individual resources are being grouped together, making it easier to get an at-a-glance cost summary.

In addition to SQL servers, you also see other services with child resources, like App Service, Synapse, and VNet gateways. Each is similarly shown grouped together in the cost analysis preview.

Grouping SQL databases and elastic pools is available by default in the cost analysis preview.

Group related resources, like disks under VMs or web apps under App Service plans, by adding a “cm-resource-parent” tag to the child resources with a value of the parent resource ID. Wait 24 hours for tags to be available in usage and your resources are grouped. Leave feedback to let us know how we can improve this experience further for you.

Some resources have related dependencies that aren't explicit children or nested under the logical parent in Azure Resource Manager. Examples include disks used by a virtual machine or web apps assigned to an App Service plan. Unfortunately, Cost Management isn't aware of these relationships and can't group them automatically. This experimental feature uses tags to summarize the total cost of your related resources together. You see a single row with the parent resource. When you expand the parent resource, you see each linked resource listed individually with their respective cost.

As an example, let's say you have an Azure Virtual Desktop host pool configured with two VMs. Tagging the VMs and corresponding network/disk resources groups them under the host pool, giving you the total cost of the session host VMs in your host pool deployment. This example gets even more interesting if you want to also include the cost of any cloud solutions made available via your host pool.

Screenshot of the cost analysis preview showing VMs and disks grouped under an Azure Virtual Desktop host pool.

Before you link resources together, think about how you'd like to see them grouped. You can only link a resource to one parent and cost analysis only supports one level of grouping today.

Once you know which resources you'd like to group, use the following steps to tag your resources:

  1. Open the resource that you want to be the parent.
  2. Select Properties in the resource menu.
  3. Find the Resource ID property and copy its value.
  4. Open All resources or the resource group that has the resources you want to link.
  5. Select the checkboxes for every resource you want to link and then select the Assign tags command.
  6. Specify a tag key of "cm-resource-parent" (make sure it's typed correctly) and paste the resource ID from step 3.
  7. Wait 24 hours for new usage to be sent to Cost Management with the tags. (Keep in mind resources must be actively running with charges for tags to be updated in Cost Management.)
  8. Open the Resources view in the cost analysis preview.

Wait for the tags to load in the Resources view and you should now see your logical parent resource with its linked children. If you don't see them grouped yet, check the tags on the linked resources to ensure they're set. If not, check again in 24 hours.

Grouping related resources is available by default in the cost analysis preview.

Charts in the cost analysis preview

Charts in the cost analysis preview include a chart of daily or monthly charges for the specified date range.

Screenshot showing a chart in cost analysis preview.

Charts are enabled on the Try preview page in the Azure portal. Use the How would you rate the cost analysis preview? Option at the bottom of the page to share feedback about the preview.

Forecast in the cost analysis preview

Show the forecast for the current period at the top of the cost analysis preview.

The Forecast KPI can be enabled from the Try preview page in the Azure portal. Use the How would you rate the cost analysis preview? option at the bottom of the page to share feedback about the preview.

Cost savings insights in the cost analysis preview

Cost insights surface important details about your subscriptions, like potential anomalies or top cost contributors. To support your cost optimization goals, cost insights now include the total cost savings available from Azure Advisor for your subscription.

Cost savings insights are available by default for all subscriptions in the cost analysis preview.

View cost for your resources

Cost analysis is available from every management group, subscription, resource group, and billing scope in the Azure portal and the Microsoft 365 admin center. To make cost data more readily accessible for resource owners, you can now find a View cost link at the top-right of every resource overview screen, in Essentials. Select the link to open classic cost analysis with a resource filter applied.

The view cost link is enabled by default in the Azure preview portal.

Streamlined menu

Cost Management includes a central management screen for all configuration settings. Some of the settings are also available directly from the Cost Management menu currently. Enabling the Streamlined menu option removes configuration settings from the menu.

In the following image, the left menu is classic cost analysis. The right menu is the streamlined menu.

Screenshot showing the Streamlined menu in cost analysis preview.

You can enable Streamlined menu on the Try preview page in the Azure portal. Feel free to share your feedback. As an experimental feature, we need your feedback to determine whether to release or remove the preview.

Open config items in the menu

Cost Management includes a central management view for all configuration settings. Currently, selecting a setting opens the configuration page outside of the Cost Management menu.

Screenshot showing configuration items after the Open config items in the menu option is selected.

Open config items in the menu is an experimental option to open the configuration page in the Cost Management menu. The option makes it easier to switch to other menu items with one selection. The feature works best with the streamlined menu.

You can enable Open config items in the menu on the Try preview page in the Azure portal.

Share your feedback about the feature. As an experimental feature, we need your feedback to determine whether to release or remove the preview.

Change scope from menu

If you manage many subscriptions, resource groups, or management groups and need to switch between them often, you might want to include the Change scope from menu option.

Screenshot showing the Change scope option added to the menu after selecting the Change menu from scope preview option.

It allows changing the scope from the menu for quicker navigation. To enable the feature, navigate to the Cost Management Labs preview page in the Azure portal.

Share your feedback about the feature. As an experimental feature, we need your feedback to determine whether to release or remove the preview.

Reservation utilization alerts

Azure reservations can provide cost savings by committing to one-year or three-year plans. However, reservations can sometimes go unutilized or underutilized, resulting in financial losses. As a billing account or reservation user, you can review the utilization percentage of your reservation purchases in the Azure portal, but you might miss out important changes. By enabling reservation utilization alerts, you solve this by receiving email notifications whenever any of your reservations exhibit low utilization. This allows you to take prompt action and optimize your reservation purchases for maximum efficiency.

The alert email provides essential information including top unutilized reservations and a hyperlink to the list of reservations. By promptly optimizing your reservation purchases, you can avoid financial losses and ensure that your investments are delivering the expected cost savings. For more information, see Reservation utilization alerts.

Screenshot showing Create alert rule.

How to share feedback

We're always listening and making constant improvements based on your feedback, so we welcome it. Here are a few ways to share your feedback with the team:

  • If you have a problem or are seeing data that doesn't make sense, submit a support request. It's the fastest way to investigate and resolve data issues and major bugs.
  • For feature requests, you can share ideas and vote up others in the Cost Management feedback forum.
  • Take advantage of the How would you rate… prompts in the Azure portal to let us know how each experience is working for you. We monitor the feedback proactively to identify and prioritize changes. You see either a blue option in the bottom-right corner of the page or a banner at the top.

Next steps

Learn about what's new in Cost Management.