Note
Access to this page requires authorization. You can try signing in or changing directories.
Access to this page requires authorization. You can try changing directories.
Azure CycleCloud tracks cluster cost and usage. It monitors a number of resources, including instances and volumes, and uses this data to estimate runtime and charges per resource.
Usage Alerts
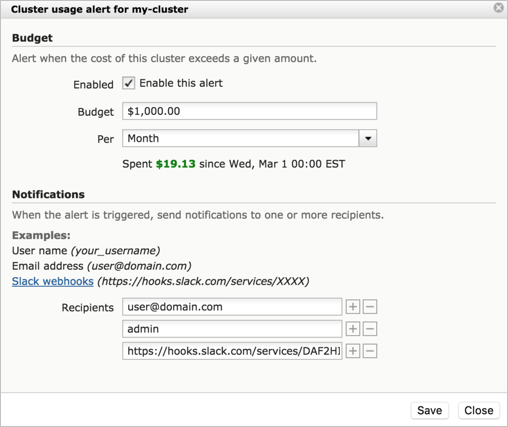
CycleCloud allows you to set an alert per cluster that displays your estimated cost and notifies you if that spend exceeds a specified dollar amount.
To display your cluster usage, select Create New Alert within the cluster to open the alert window. Enable the alert by selecting the checkbox if you want to track the spend for this particular cluster. Set a budget for the cluster, and select whether the budget is for the day or the month. Select Save to activate the alert. On the cluster page, you see the current spend for the day or the month (depending on your selection).
Note
Usage Alerts are informational only. Going over your budget doesn't stop or pause the instance. The spend amount per cluster is cumulative per time period selected.
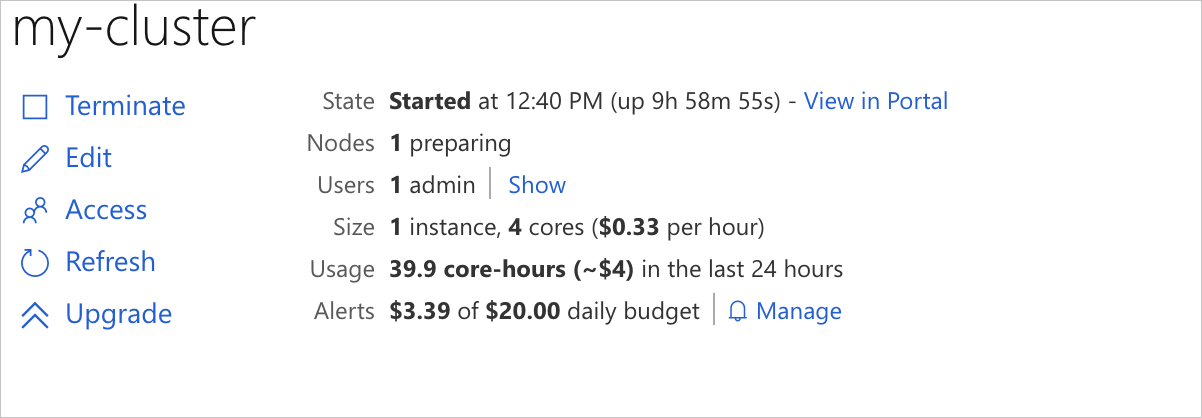
Current spend within budget:
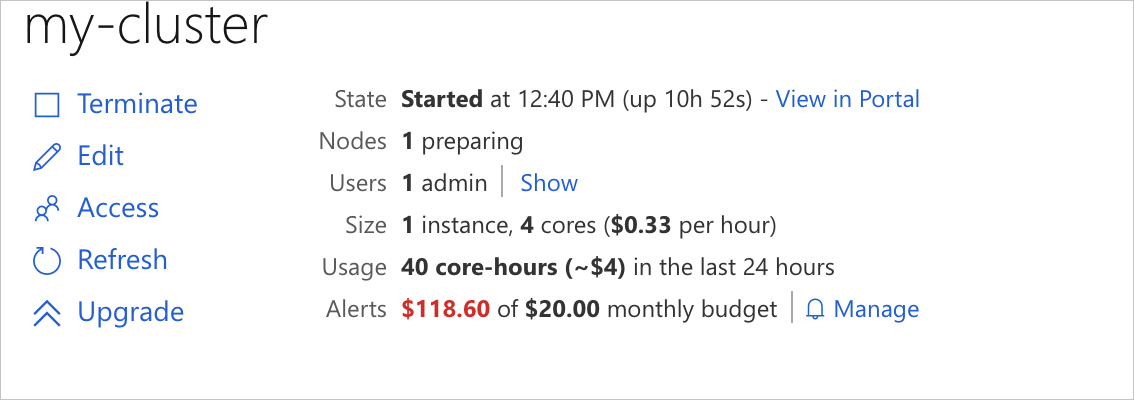
Current spend with overage:
Notifications
If you want to receive email, Microsoft Teams, or Slack™ notifications when your cluster exceeds the budget, enter one of the following values:
- User Name: The user account associated with an email address to use.
- Email Address: The email address for the alert.
- Teams: If you're using Microsoft Teams, set up a webhook. This method is deprecated and will no longer be supported. There's currently no support in CycleCloud for the new Workflows method.
- Slack: If you're using Slack, set up a webhook to have notifications sent to a specific channel.
Add the alert recipient's information and select Save. To add more recipients, select +, or - to delete.
Notifications are sent out once per day.
To edit the alert, budget, or notification settings, select Manage from the alert line on the cluster page.
Pricing
CycleCloud collects pricing for instances running in all cloud providers. The data is updated constantly throughout the day to provide accurate estimates. This requirement means that the subscription credentials in CycleCloud must provide access to the RateCard API.
Includes:
- Base price of VMs, including preview-only machine types, at standard "pay-as-you-go" rates
- Linux/Windows rates
- Regular/Spot
- Boot disks and other disks (7.8.0+)
Doesn't include:
- Other software charges
- Reserved-VM rates
- Volume-usage discounts
Note
All usage and cost numbers are approximations.
Cost Tracking
CycleCloud 8.2 includes the ability to track aggregate usage and costs. Usage is measured in core-hours (where one vCPU used for one hour counts as one core-hour). Cost is measured in US dollars at retail pay-as-you-go rates.
Cost tracking is on by default, but it requires access to the RateCard API. If that API doesn't work with the given Azure credentials, the calls only show usage, but no costs.
Tracking Costs Through Microsoft Cost Management
CycleCloud tags VMs with CycleCloudCluster and CycleCloudNodeArray for the cluster and nodearray that they're in. For more information on tagging, see Tagging Nodes. This tagging makes the costs show up in Microsoft Cost Management. The benefit of tracking costs this way is that Cost Management shows the actual costs associated with that VM, including network and disk usage, billed at the actual rate for your subscription. The downside is that costs might take up to 48 hours to be listed there.
Tracking Costs Through CycleCloud
CycleCloud shows costs on an ongoing basis. These costs immediately reflect changes in the cluster, but they're approximate (see the limitations in the Pricing section).
CycleCloud includes a REST API for cost data to get the data programmatically. In addition, there are some built-in commands that you can run directly on the CycleCloud VM. The commands produce output in a text format. To get JSON output, use -format json.
To get usage and cost for all clusters in the last 24 hours:
/opt/cycle_server/cycle_server execute -format tabular 'select * using cluster_cost where @last(`1d`)'
To get usage and cost for a single cluster named MyCluster:
/opt/cycle_server/cycle_server execute -format tabular 'select * using cluster_cost where @last(`1d`) && ClusterName == "MyCluster"'
To get usage and cost between in a custom time range:
/opt/cycle_server/cycle_server execute -format tabular 'select * using cluster_cost where @timerange(`2020-08-01T12:15:00Z`, `2020-08-02T01:30:00Z`)'
To get an automatic summary of the usage and cost over the previous month, current month, last seven days, and last 24 hours:
/opt/cycle_server/cycle_server execute -format tabular 'select * using cluster_cost_summary'