hll_merge()
Merges HLL results. This is the scalar version of the aggregate version hll_merge().
Read about the underlying algorithm (HyperLogLog) and estimation accuracy.
Important
The results of hll(), hll_if(), and hll_merge() can be stored and later retrieved. For example, you may want to create a daily unique users summary, which can then be used to calculate weekly counts. However, the precise binary representation of these results may change over time. There's no guarantee that these functions will produce identical results for identical inputs, and therefore we don't advise relying on them.
Syntax
hll_merge( hll, hll2, [ hll3, ... ])
Learn more about syntax conventions.
Parameters
| Name | Type | Required | Description |
|---|---|---|---|
| hll, hll2, ... | string |
✔️ | The column names containing HLL values to merge. The function expects between 2-64 arguments. |
Returns
Returns one HLL value. The value is the result of merging the columns hll, hll2, ... hllN.
Examples
This example shows the value of the merged columns.
range x from 1 to 10 step 1
| extend y = x + 10
| summarize hll_x = hll(x), hll_y = hll(y)
| project merged = hll_merge(hll_x, hll_y)
| project dcount_hll(merged)
Output
dcount_hll_merged |
|---|
| 20 |
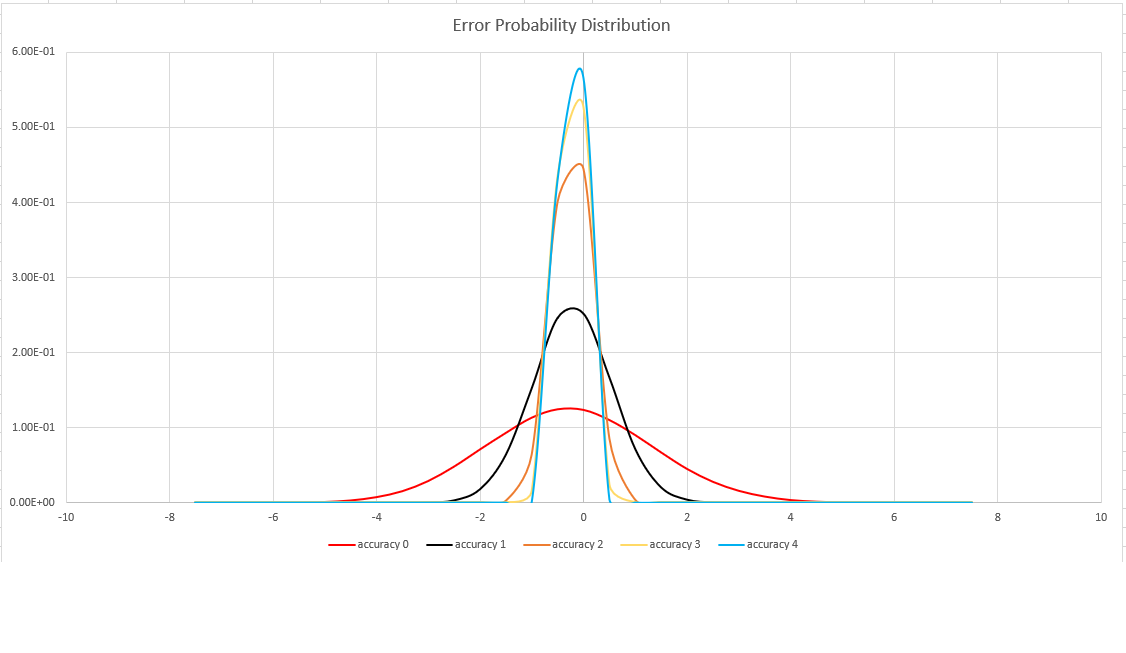
Estimation accuracy
This function uses a variant of the HyperLogLog (HLL) algorithm, which does a stochastic estimation of set cardinality. The algorithm provides a "knob" that can be used to balance accuracy and execution time per memory size:
| Accuracy | Error (%) | Entry count |
|---|---|---|
| 0 | 1.6 | 212 |
| 1 | 0.8 | 214 |
| 2 | 0.4 | 216 |
| 3 | 0.28 | 217 |
| 4 | 0.2 | 218 |
Note
The "entry count" column is the number of 1-byte counters in the HLL implementation.
The algorithm includes some provisions for doing a perfect count (zero error), if the set cardinality is small enough:
- When the accuracy level is
1, 1000 values are returned - When the accuracy level is
2, 8000 values are returned
The error bound is probabilistic, not a theoretical bound. The value is the standard deviation of error distribution (the sigma), and 99.7% of the estimations will have a relative error of under 3 x sigma.
The following image shows the probability distribution function of the relative estimation error, in percentages, for all supported accuracy settings:
Feedback
Coming soon: Throughout 2024 we will be phasing out GitHub Issues as the feedback mechanism for content and replacing it with a new feedback system. For more information see: https://aka.ms/ContentUserFeedback.
Submit and view feedback for