Note
Access to this page requires authorization. You can try signing in or changing directories.
Access to this page requires authorization. You can try changing directories.
Redash connects and queries your data sources, builds dashboards to visualize data and share them with peers. In this article, you learn how to set up Azure Data Explorer as a data source for Redash, and then visualize data.
Prerequisites
- An Azure subscription. Create a free Azure account.
- An Azure Data Explorer cluster and database. Create a cluster and database.
- Ingest data as explained in ingest sample data into Azure Data Explorer. For more ingestion options, see ingestion overview.
Configure the data source
You perform the following steps to configure Azure Data Explorer as a data source for your dashboard tool. We'll cover these steps in more detail in this section:
Create a Microsoft Entra service principal. The service principal is used by your dashboard tool to access the Azure Data Explorer service.
Add the Microsoft Entra service principal to the viewers role in the Azure Data Explorer database.
Specify your dashboard tool connection properties based on information from the Microsoft Entra service principal, then test the connection.
Create a service principal
You can create the service principal in the Azure portal or using the Azure CLI command-line experience. Regardless of which method you use, after creation you get values for four connection properties that you'll use in later steps.
Azure portal
To create the service principal, follow the instructions in the Azure portal documentation.
In the Assign the application to a role section, assign a role type of Reader to your Azure Data Explorer cluster.
In the Get values for signing in section, copy the three property values covered in the steps: Directory ID (tenant ID), Application ID, and Password.
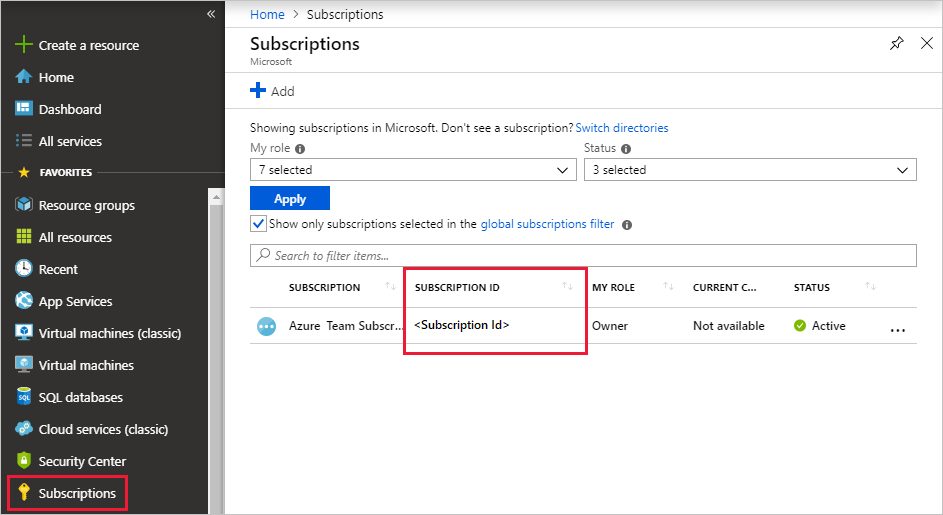
In the Azure portal, select Subscriptions then copy the ID for the subscription in which you created the service principal.
Azure CLI
Create a service principal. Set an appropriate scope and a role type of
reader.az ad sp create-for-rbac --name "https://{UrlToYourDashboard}:{PortNumber}" --role "reader" \ --scopes /subscriptions/{SubID}/resourceGroups/{ResourceGroupName}For more information, see Create an Azure service principal with Azure CLI.
The command returns a result set like the following. Copy the three property values: appID, password, and tenant.
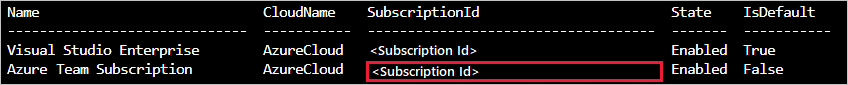
{
  "appId": "XXXXXXXX-XXXX-XXXX-XXXX-XXXXXXXXXXXX",
  "displayName": "{UrlToYourDashboard}:{PortNumber}",
  "name": "https://{UrlToYourDashboard}:{PortNumber}",
  "password": "XXXXXXXX-XXXX-XXXX-XXXX-XXXXXXXXXXXX",
  "tenant": "XXXXXXXX-XXXX-XXXX-XXXX-XXXXXXXXXXXX"
}
Get a list of your subscriptions.
az account list --output tableCopy the appropriate subscription ID.
Add the service principal to the viewers role
Now that you have a service principal, you add it to the viewers role in the Azure Data Explorer database. You can perform this task under Permissions in the Azure portal, or under Query by using a management command.
Azure portal - Permissions
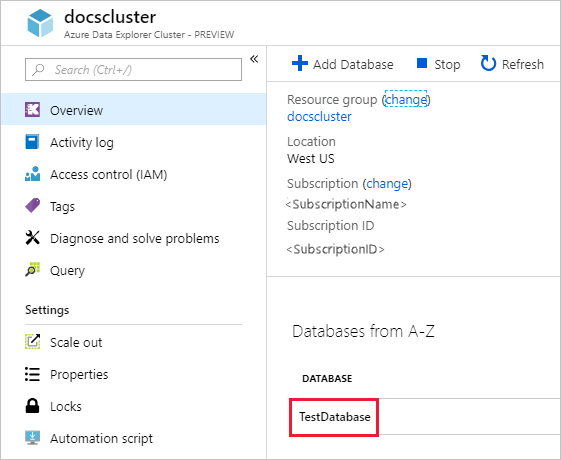
In the Azure portal, go to your Azure Data Explorer cluster.
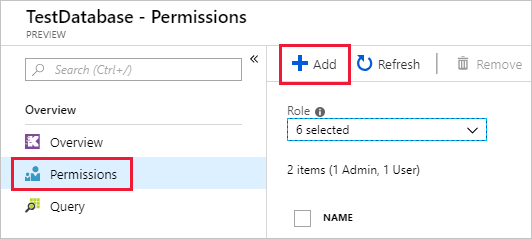
In the Overview section, select the database with the StormEvents sample data.
Select Permissions then Add.
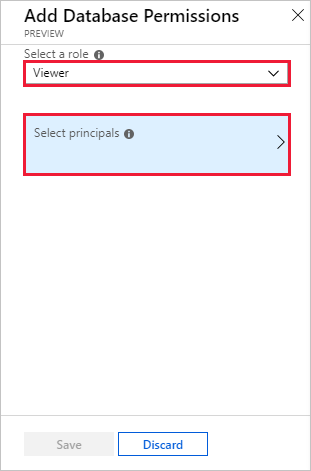
Under Add database permissions, select the Viewer role then Select principals.
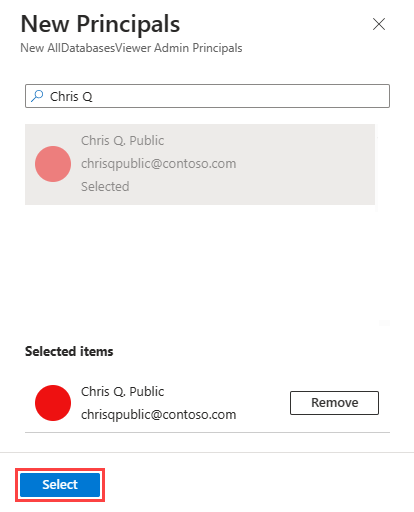
Search for the service principal you created. Select the principal, then Select.
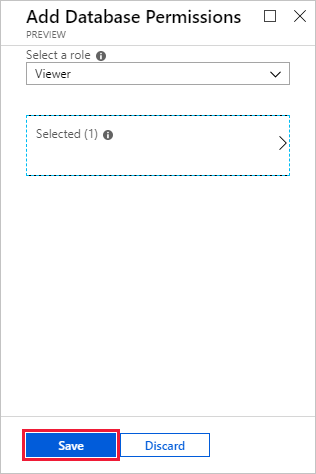
Select Save.
Management command - Query
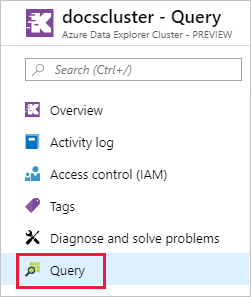
In the Azure portal, go to your Azure Data Explorer cluster, and select Query.
Run the following command in the query window. Use the application ID and tenant ID from the Azure portal or CLI.
.add database {TestDatabase} viewers ('aadapp={ApplicationID};{TenantID}')The command returns a result set like the following. In this example, the first row is for an existing user in the database, and the second row is for the service principal that was just added.

Create Azure Data Explorer Connector in Redash
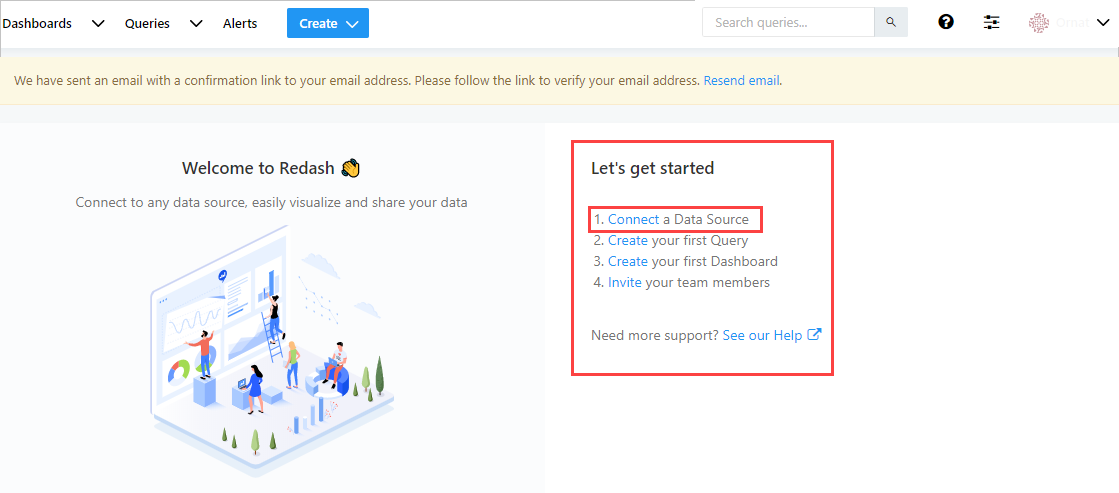
Sign in to Redash. Select Get Started to create an account.
Under Let's get started, Select Connect a Data Source.
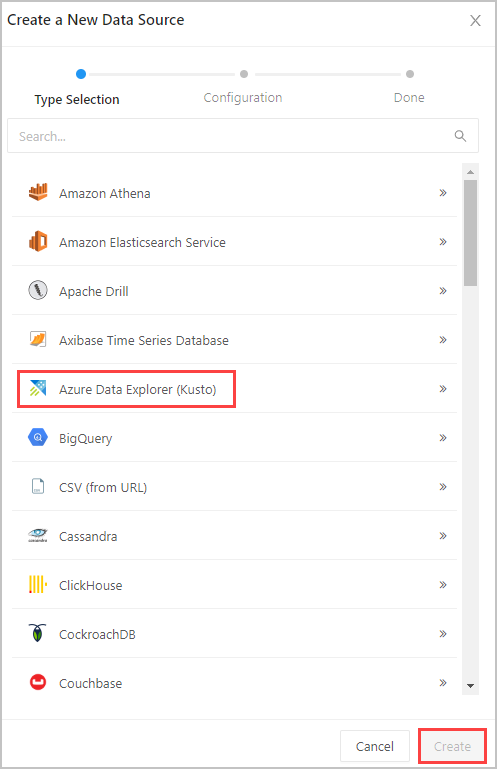
In Create a New Data Source window, select Azure Data Explorer (Kusto), then select Create.
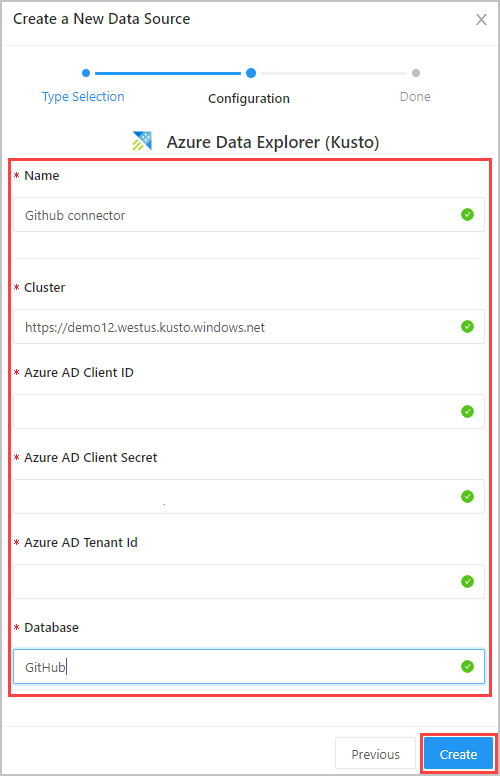
In Azure Data Explorer (Kusto) window, complete the following form and select Create.
In Settings window, select Save and Test Connection to test your Azure Data Explorer (Kusto) data source connection.
Create queries in Redash
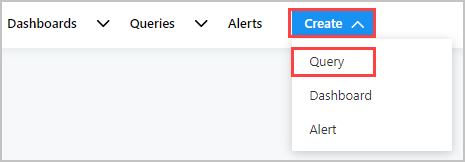
On top left of Redash, select Create > Query. Click on New Query and rename the query.
Type your query in the top editing pane and select Save and Execute. Select Publish to publish query for future use.
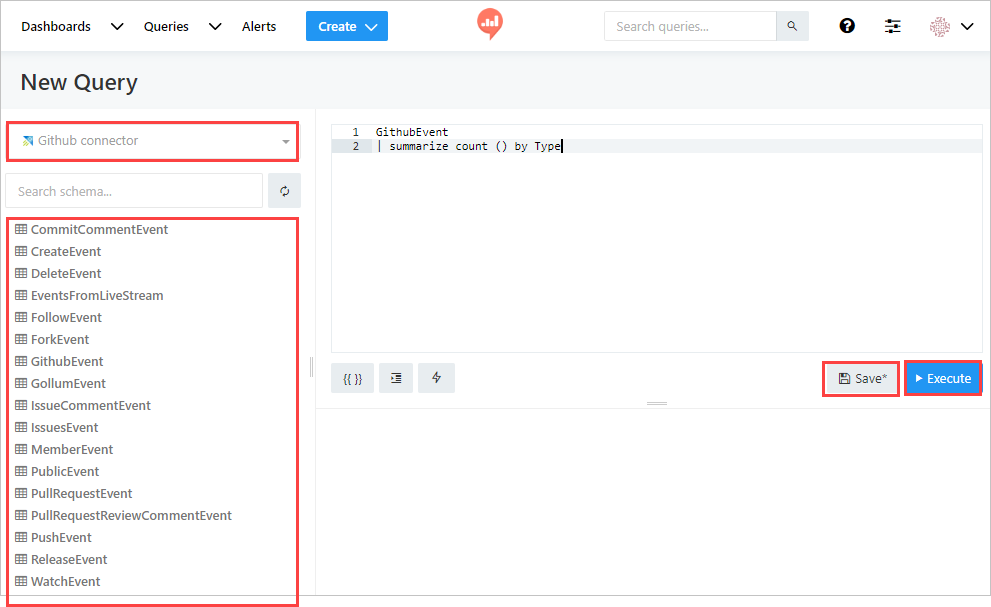
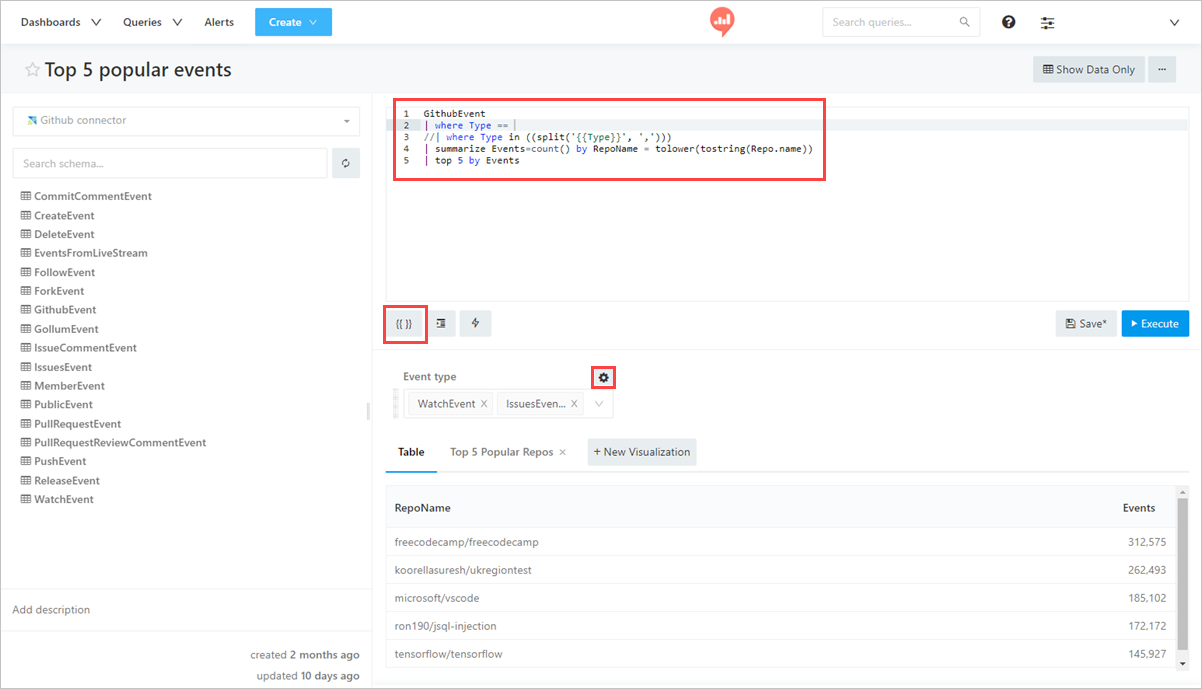
In the left pane, you can see the data source connection name (Github connector in our flow) in the dropdown menu, and the tables in the selected database.
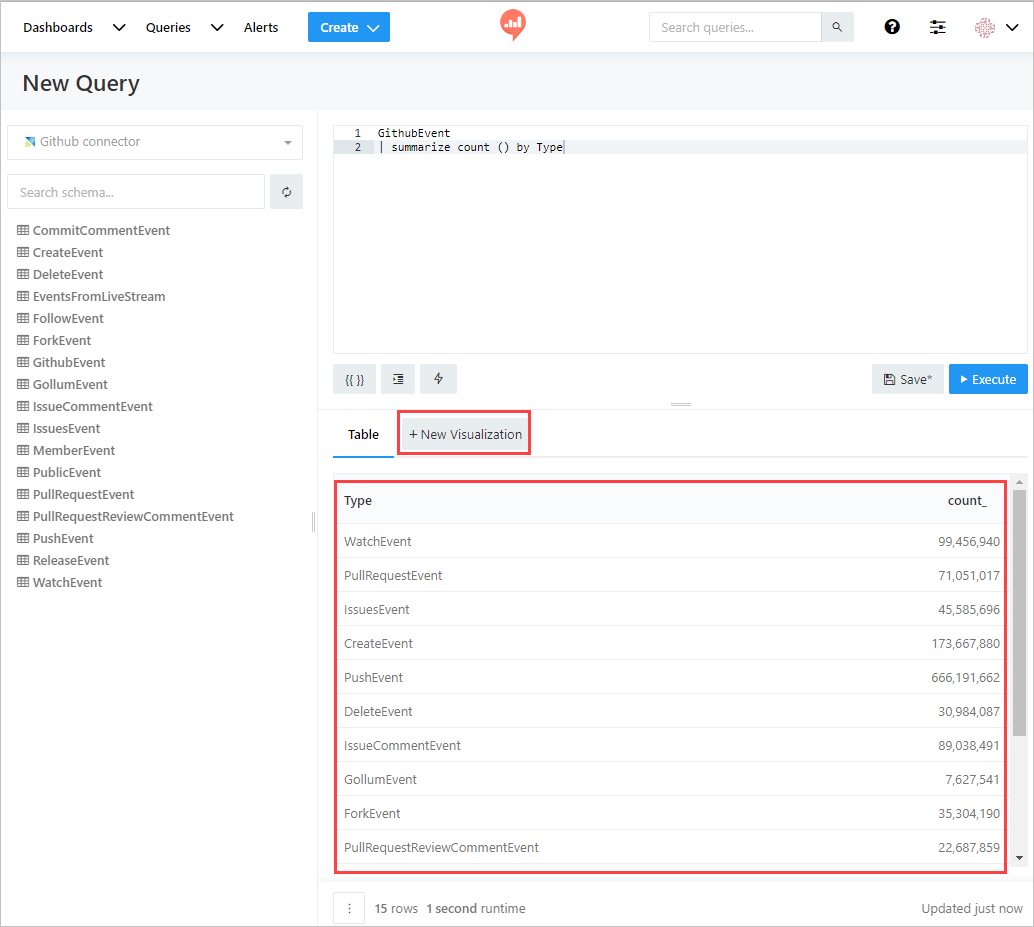
View the query results in the bottom central pane. Create a visualization to go with the query by selecting the New Visualization button.
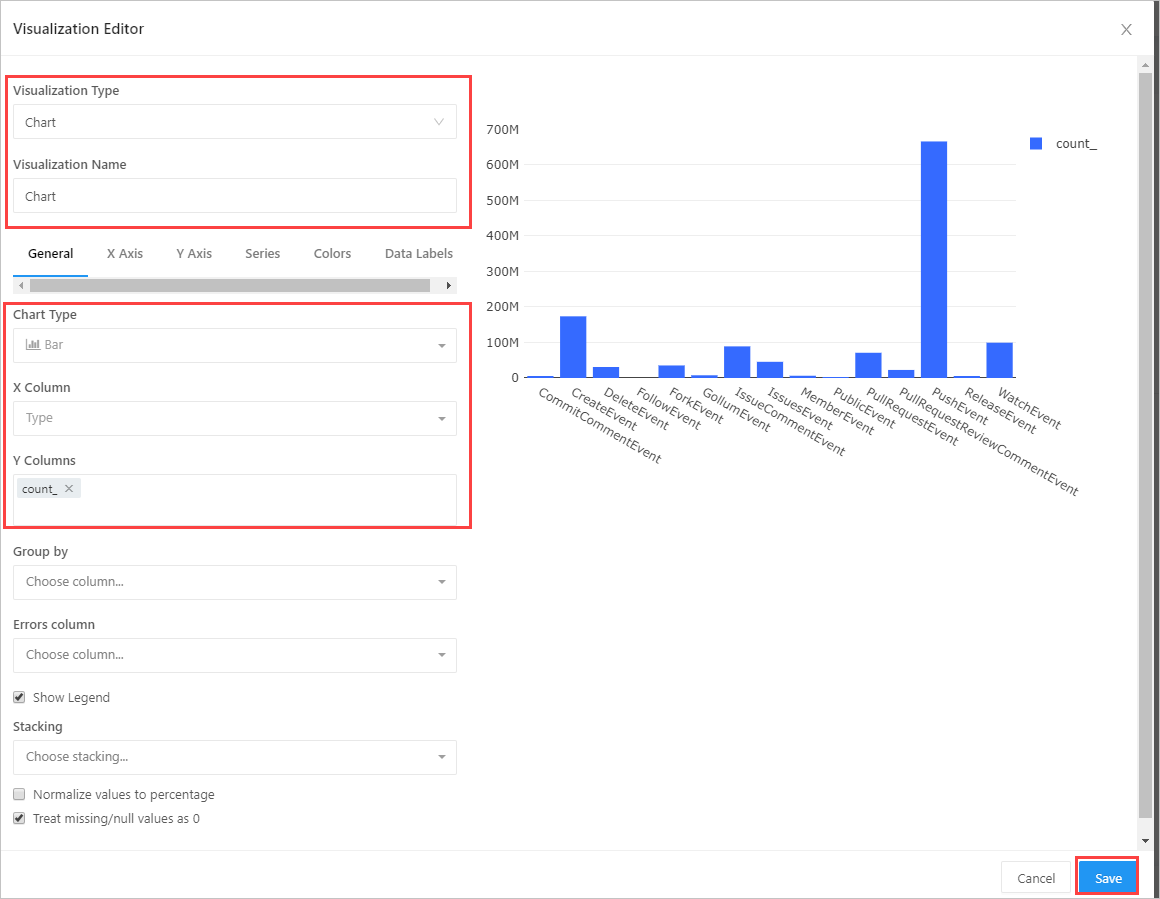
In the visualization screen, select the Visualization Type and the relevant fields such as X Column and Y Column. Save the visualization.
Create a query using a parameter
Create > Query to create a new query. Add a parameter to it using {{}} curly brackets. Select {{}} to open Add Parameter window. You can also select the settings icon to modify the attributes of an existing parameter and open the <parameter_name> window.
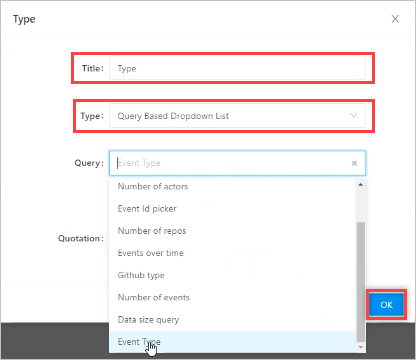
Name your parameter. Select Type: Query Based Dropdown List from dropdown menu. Select OK
Note
The query uses multiple values, therefore you must include the following syntax
| where Type in ((split('{{Type}}', ','))). For more information, see in operator. This results in multiple query parameter options in redash app
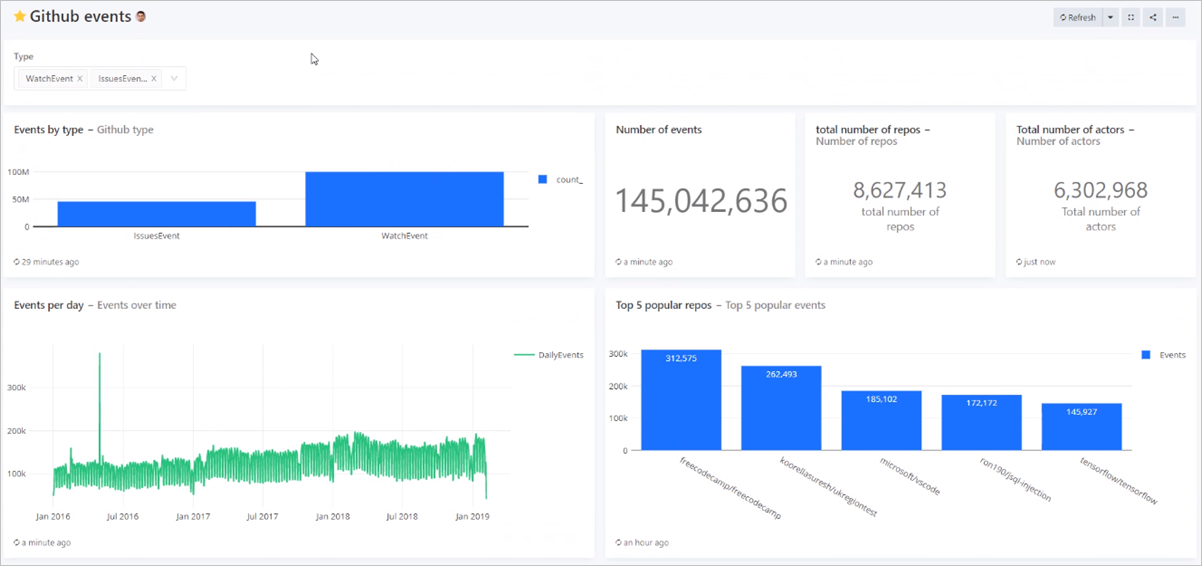
Create a dashboard in Redash
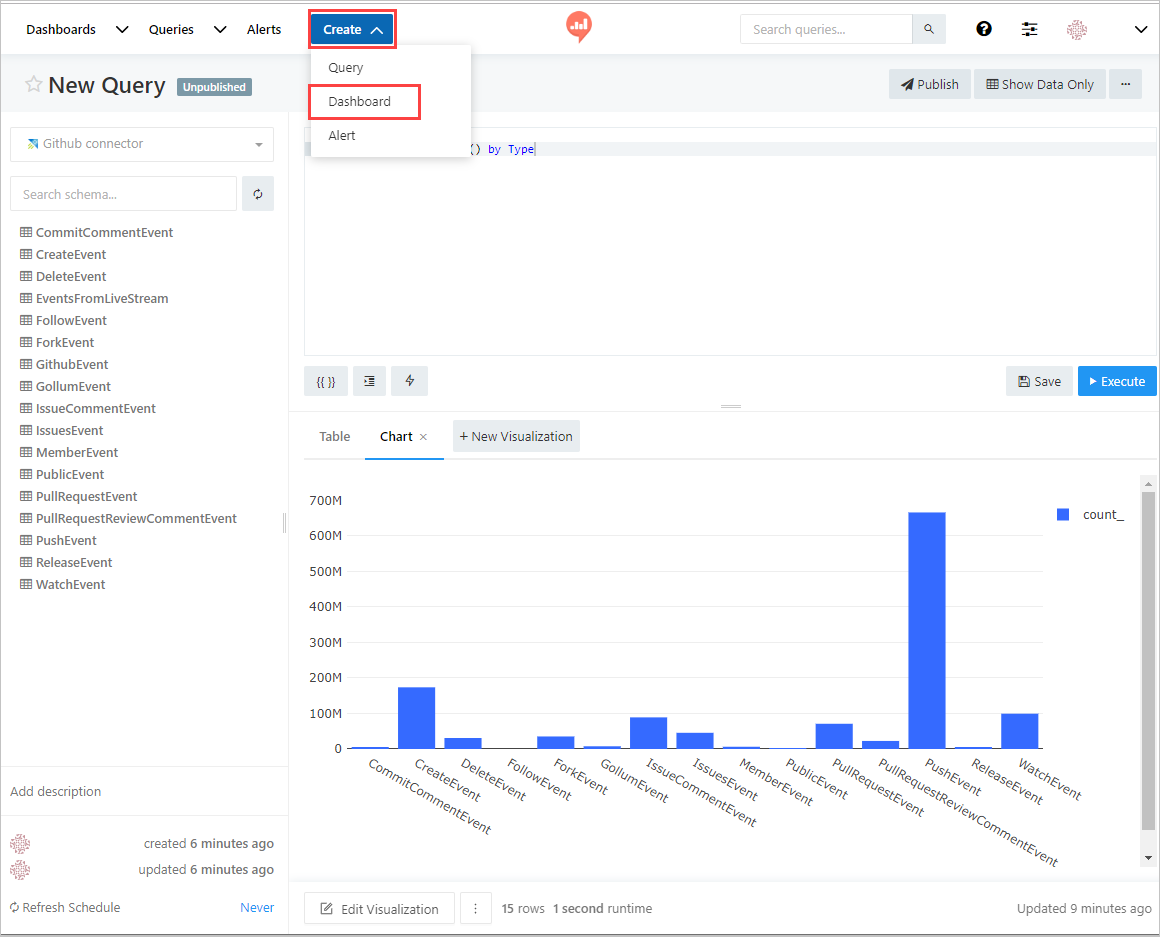
To create your dashboard, Create > Dashboard. Alternatively, select existing dashboard, Dashboards > select a dashboard from the list.
In New Dashboard window, name your dashboard and select Save. In <Dashboard_name> window, select Add Widget to create a new widget.
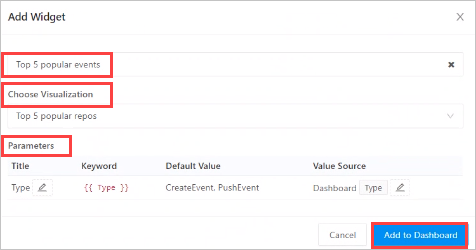
In Add Widget window, select query name, Choose Visualization, and Parameters. Select Add to Dashboard
Select Done Editing to complete dashboard creation.
In the dashboard edit mode, select Use Dashboard Level Filters to use the Type parameter previously defined.