Note
Access to this page requires authorization. You can try signing in or changing directories.
Access to this page requires authorization. You can try changing directories.
Important
This feature is in Private Preview. To try it, reach out to your Azure Databricks contact.
App Analytics helps app owners understand which pages people visit, which actions they take, and how the app performs in their browsers. Use the Analytics page for your Databricks app to explore usage, investigate browser performance, and inspect recent events.
The dashboard combines events that your app sends with app access information collected by Azure Databricks. You don't need a specific client library to send analytics events. Any producer that follows the event schema can supply them.
Requirements
App Analytics access and telemetry configuration have separate requirements.
Configure telemetry
Enable app telemetry and redeploy the app before sending analytics events. For supported regions, destination-table requirements, and configuration permissions, see Requirements and Enable app telemetry.
Telemetry creates or reuses the otel_logs table in the catalog and schema you select. If you configure a table prefix, use the corresponding <prefix>_otel_logs table.
View analytics
The person opening Analytics must have the following access:
CAN MANAGEon the app.USE CATALOGon the catalog,USE SCHEMAon the schema, andSELECTon the telemetry logs table.- SQL access and
CAN USEon the SQL warehouse used to query the table.
Access to the app doesn't automatically grant access to its telemetry table or warehouse. See Configure permissions for a Databricks app.
Open Analytics and complete setup
- Open the details page for your app.
- Select Analytics in the app navigation.
- Select a SQL warehouse to query the telemetry table.
- If setup is incomplete, follow the onboarding page to configure telemetry, send events, and check that events have arrived. See Get started with App Analytics.
Analytics displays a dedicated permission page when you can't access the app or its data sources. Follow the guidance for the resource that needs access. Depending on the missing permission, request table access or copy the access request for the resource owner. After access is granted, check again. A permission error doesn't mean you need to configure telemetry again.
The onboarding page and the permission page address different conditions. Onboarding helps you configure telemetry and receive your first events. The permission page helps you obtain access to resources that might already be configured.
Explore the dashboard
Select a time range and warehouse for your analysis. The Overview and Web Vitals tabs show historical data for the selected range. Use refresh to retrieve updated results.
Overview
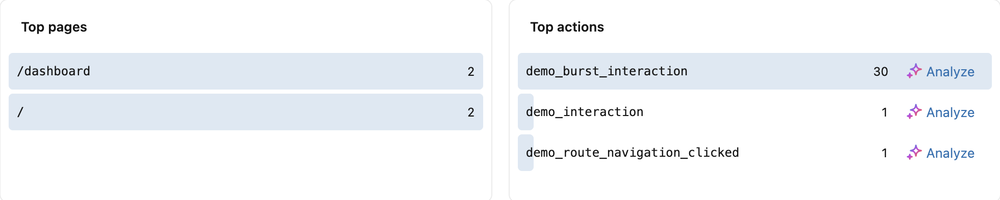
The Overview tab shows page views, sessions, tracked actions, pages per session, and unique viewers. It also shows traffic over time, frequently visited pages, and frequently recorded actions.
The following screenshot shows Top pages and Top actions, including the Analyze action.
Sessions and unique viewers measure different things:
- Sessions: Analytics activity windows identified by
session_id. A session isn't a person. The event schema makessession_idoptional. Session-based analysis depends on producers supplying it. - Unique viewers: Viewer information from app access logs, separate from the custom analytics event schema. Sending analytics events doesn't create a user identity.
For a tracked action, select Analyze to inspect its volume, sessions, routes, and surrounding actions. When Genie Code is available, use the handoff to continue investigating. Review the prepared prompt in Genie Code before submitting it.
Web Vitals
The Web Vitals tab shows browser performance measurements, rating distributions, trends, and route-level results. Select a metric to inspect its thresholds and sample size.
The default percentile is the 75th percentile (p75): 75% of samples have a value at or below it. You can also select p50, p90, or p99 in the metric detail view.
The following screenshot shows the detail view for Largest Contentful Paint (LCP).
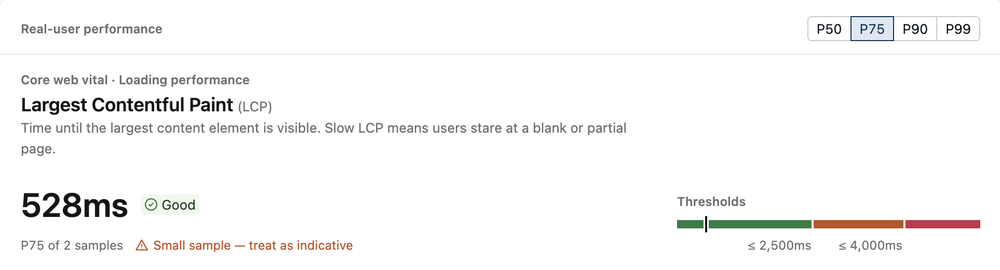
The Core Web Vitals are LCP, Interaction to Next Paint (INP), and Cumulative Layout Shift (CLS). The page also includes First Contentful Paint (FCP) and Time to First Byte (TTFB). See Web Vital rules.
Treat results based on fewer than 30 samples as indicative. A displayed value doesn't establish a reliable trend.
Live Events
The Live Events tab periodically retrieves recent events. Use its filters to inspect event types, names, and routes, and open an event to view its details.
This view uses a bounded event buffer. It isn't an exhaustive export of the telemetry table. For historical analysis beyond the displayed events, query the table directly.
Collect analytics events
Your app must send the following event types to populate usage and browser-performance analysis:
| Event type | What it records |
|---|---|
action |
A named interaction or outcome, such as a report export. |
page_view |
A visit to an application route. |
web_vital |
A browser performance measurement. |
Enabling telemetry doesn't automatically instrument your app's routes or business actions. Add instrumentation or use a producer that implements the event schema. See Get started with App Analytics.
The following diagram shows the path for app-generated analytics events. Viewer information uses a separate app-access source.
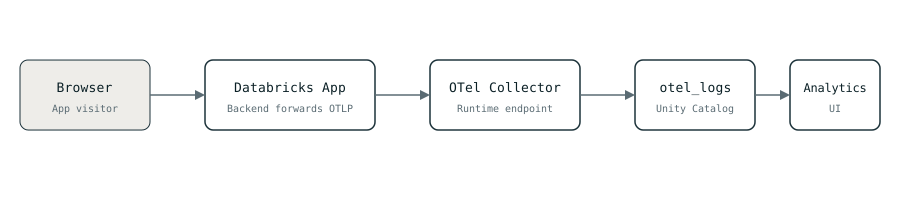
- The browser sends an event to your app's backend.
- The backend exports an OpenTelemetry (OTel) log record to the collector running alongside the app.
- The collector writes the record to
otel_logsin Unity Catalog. - Analytics queries the table using a SQL warehouse.
Use the endpoint and transport supported by your app runtime. Don't expose the collector directly to browsers. For the injected environment variables, see App telemetry environment variables.
Limitations and data handling
Analytics events support product analysis. They aren't authoritative transaction records or security audit logs. Delivery is best effort, so events can be lost or delivered more than one time.
Sanitize event names, paths, and properties before sending them. Don't include credentials, personal data, or user-entered text. Query-side filtering doesn't remove sensitive data that a producer has already written to the underlying telemetry table.
Telemetry ingestion and SQL warehouse queries use platform resources. For telemetry billing details, see Pricing.