Note
Access to this page requires authorization. You can try signing in or changing directories.
Access to this page requires authorization. You can try changing directories.
Every Lakeflow pipeline emits events that capture audit logs, data quality checks, pipeline progress, and data lineage. You can query these events from two sources:
- The
pipeline_eventssystem table contains events for all pipelines across the workspaces in a region and is the recommended way to query events. It is in Beta. - The per-pipeline event log is a Delta table that contains events for a single pipeline.
You query events with standard SQL. To help you get started, this page also provides an example dashboard and common queries for the system table.
Requirements
To access this system table, users must either:
- Be both a metastore admin and an account admin, or
- Have
USEandSELECTpermissions on the system schemas. See Grant access to system tables.
Example dashboard
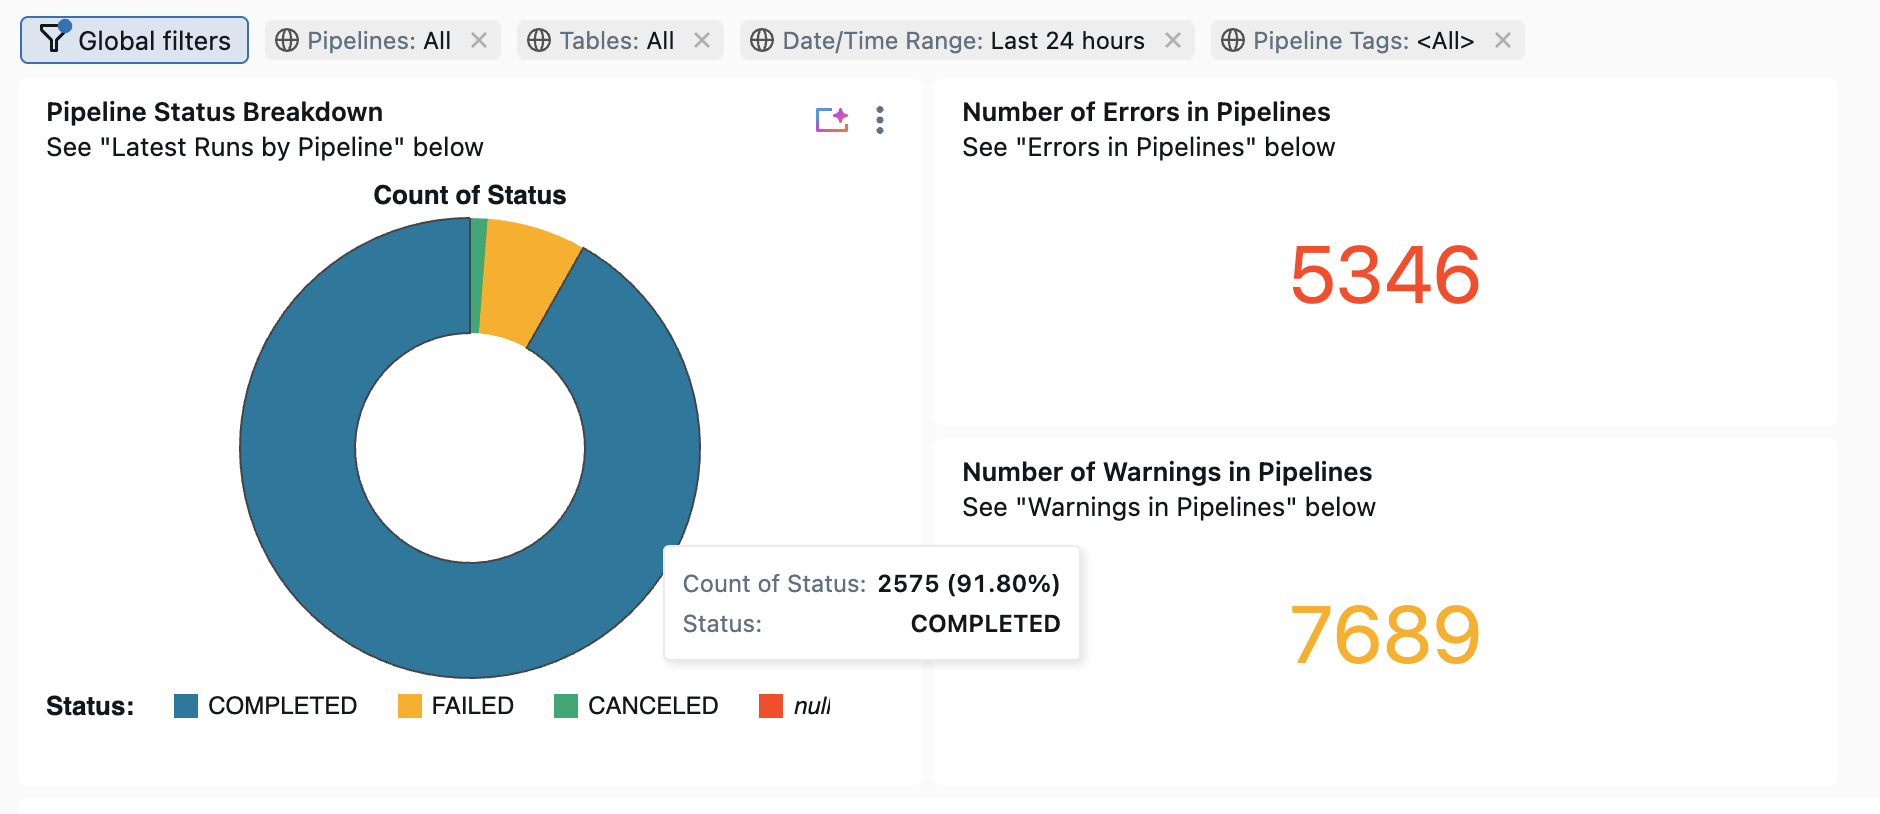
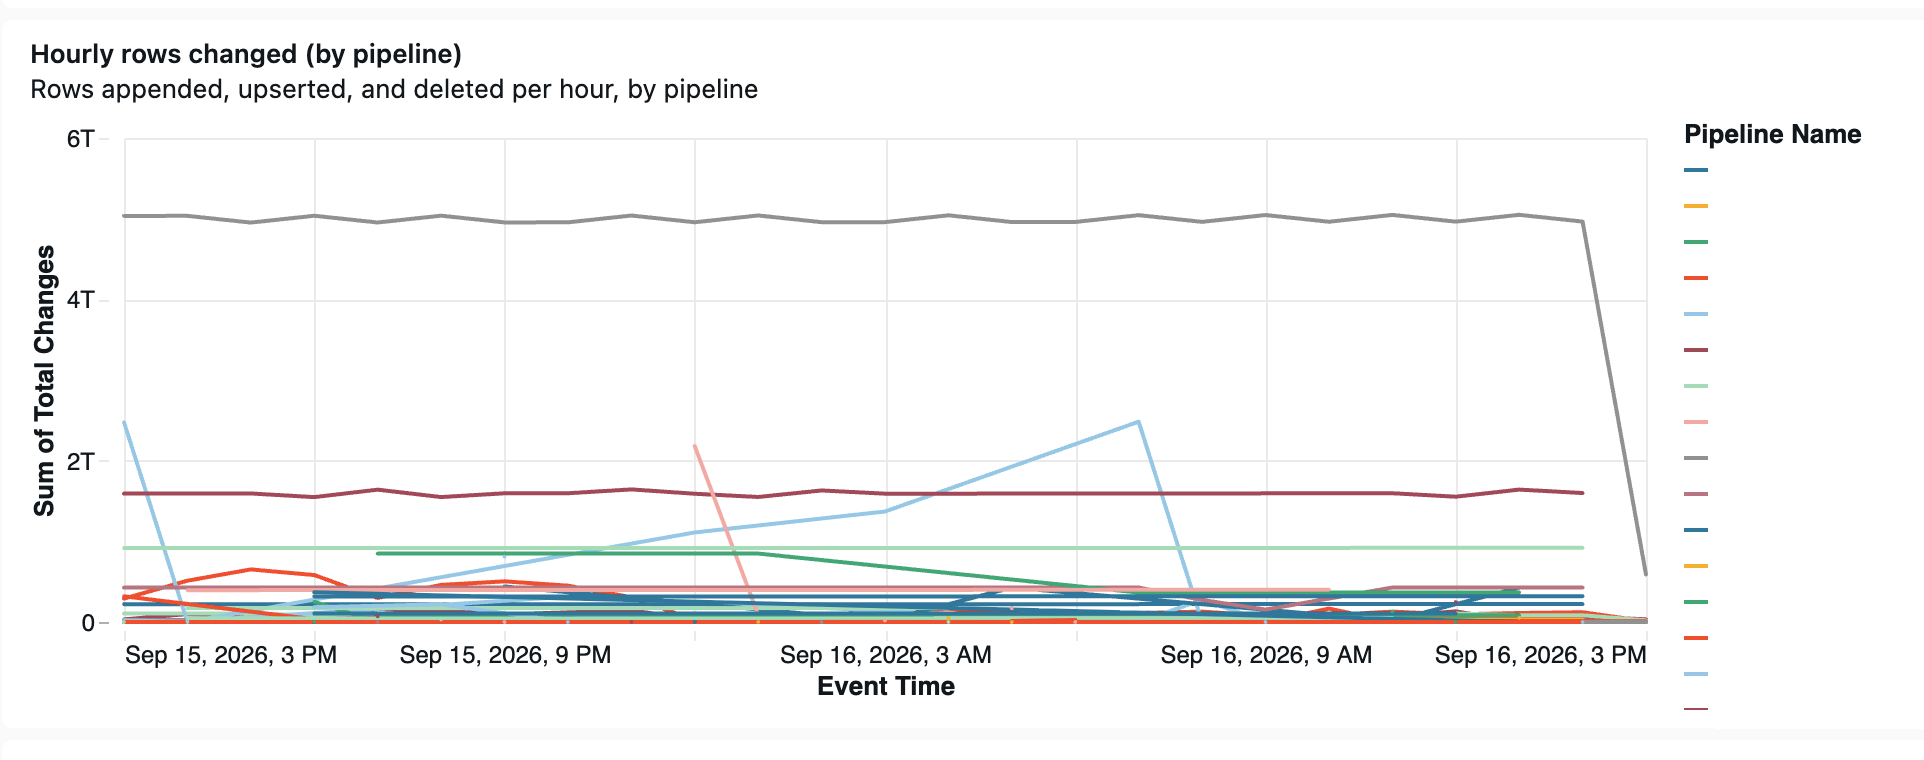
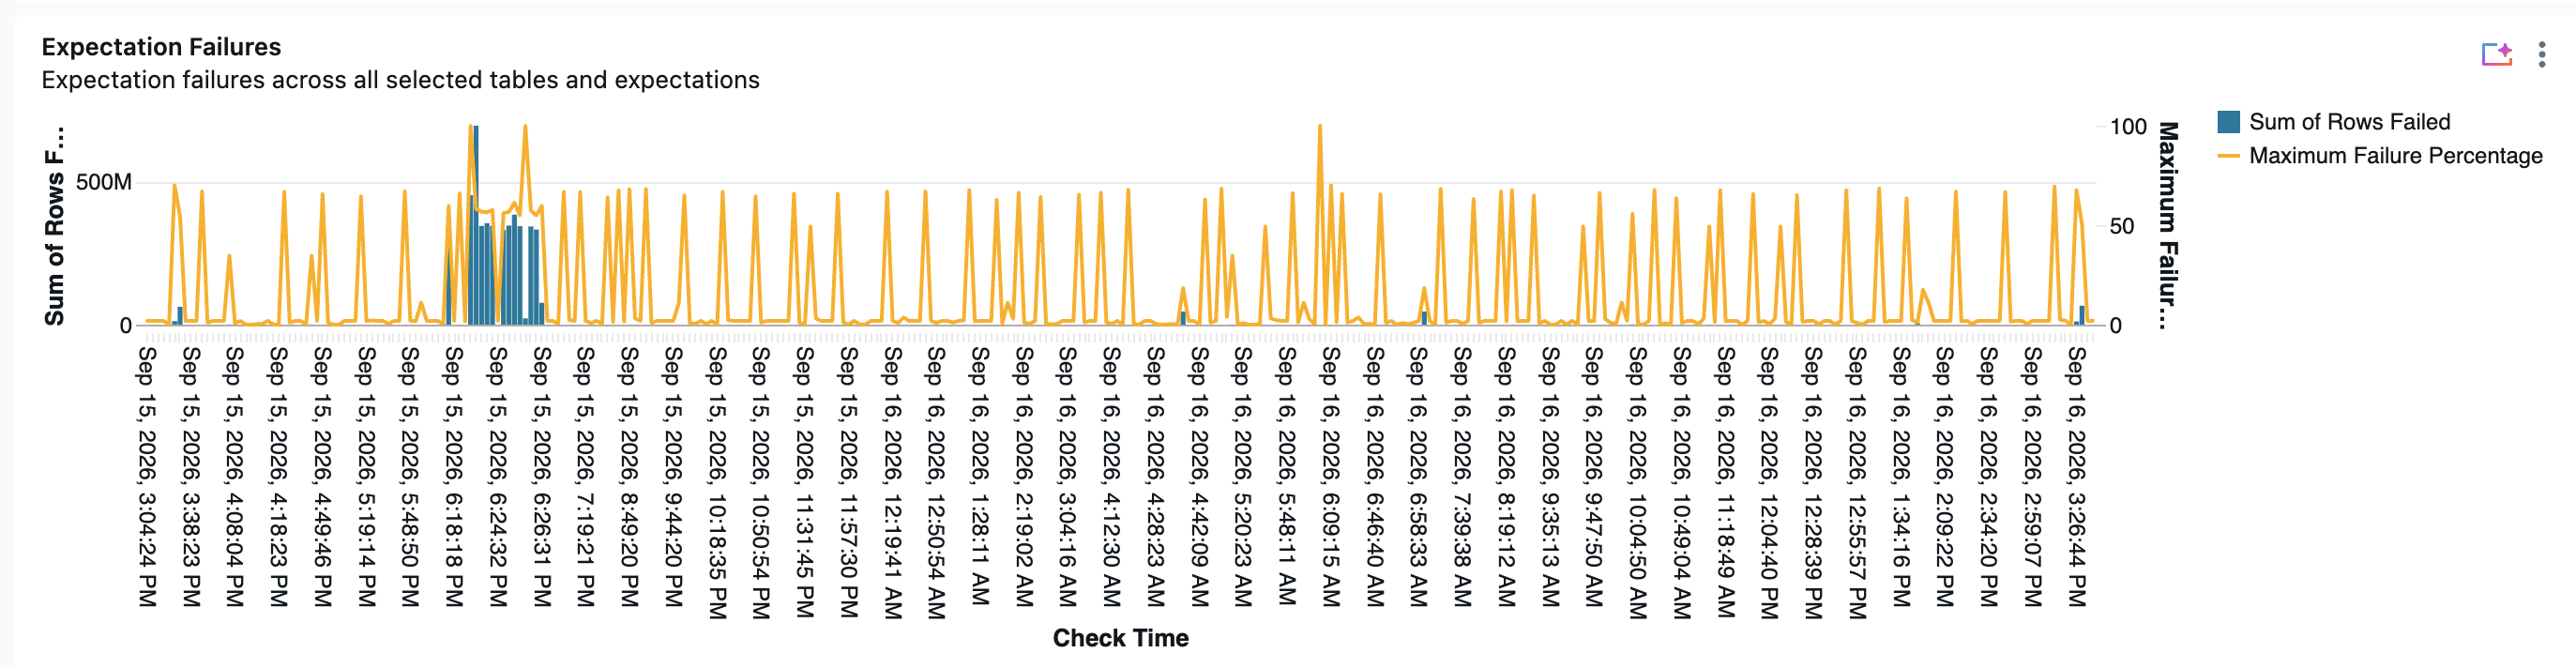
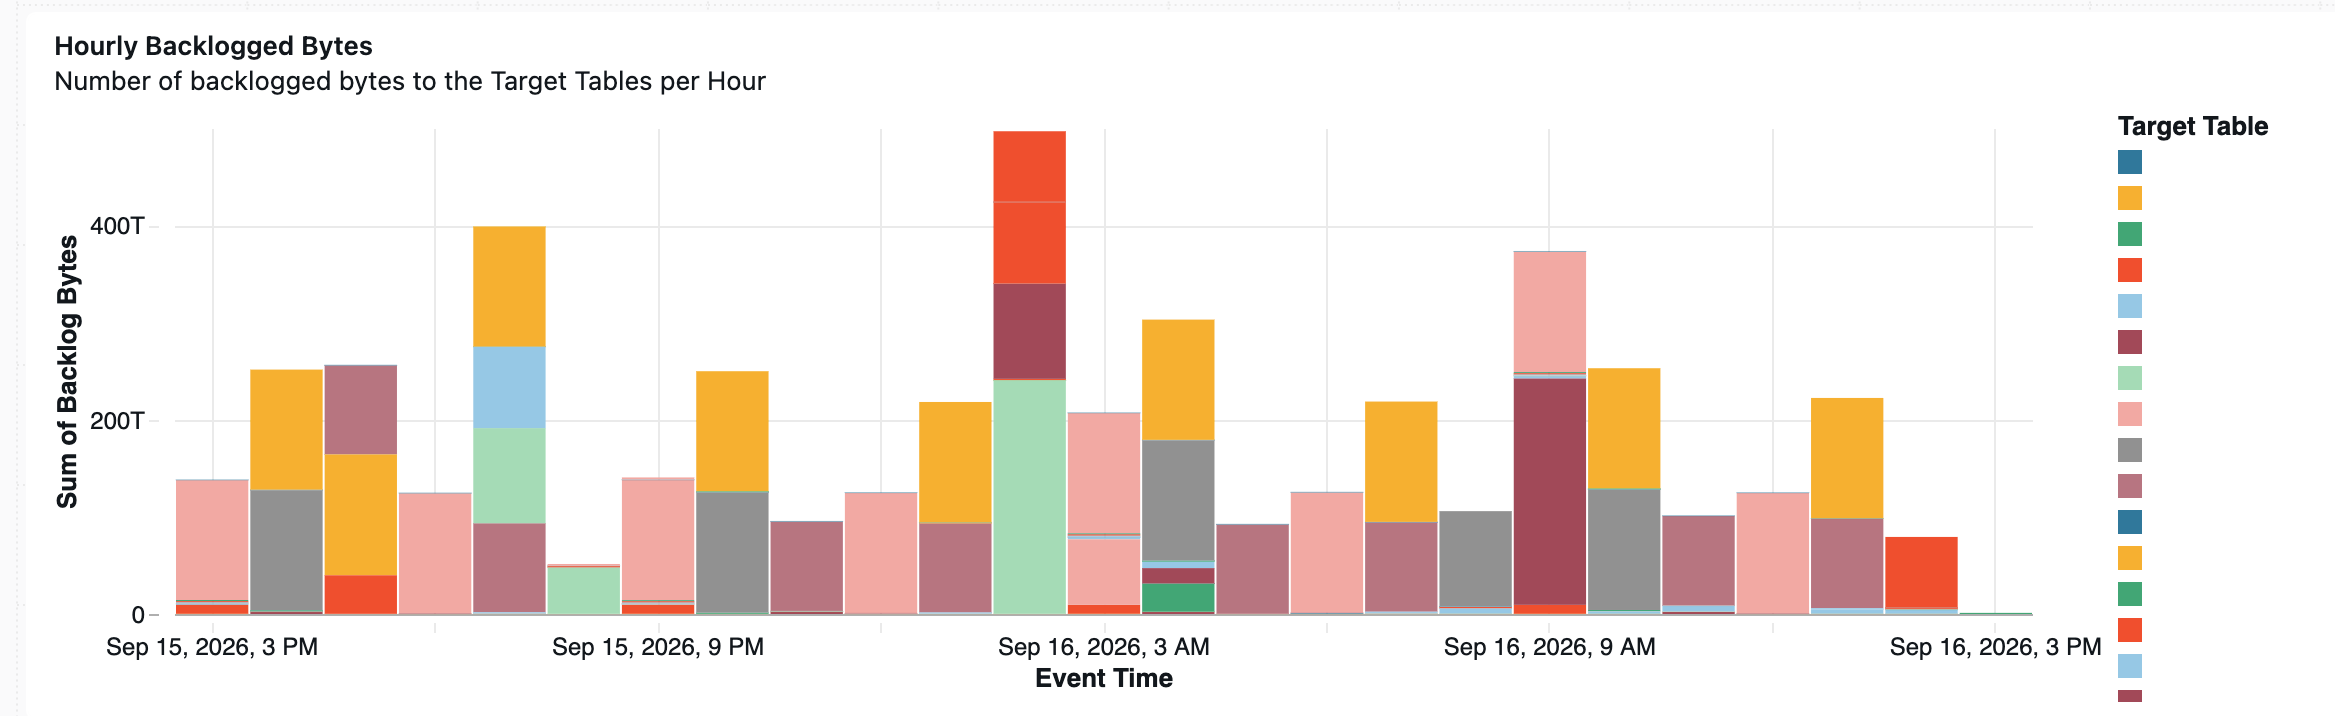
This example dashboard reads the pipeline_events system table to track pipeline updates, flow throughput, backlog, data quality, and errors across every pipeline in a region. Filter every page by pipeline, table, tag, and time range.
Import the dashboard
- Download the dashboard JSON file.
- Import the dashboard into your workspace. For instructions, see Import a dashboard file.
Monitoring queries
The following queries from the dashboard demonstrate common pipeline monitoring use cases.
Latest error per pipeline
This query returns the most recent error for each pipeline that errored in the last 7 days, with the outermost exception.
SELECT
  workspace_id,
  pipeline_id,
  event_time,
  message,
  error.exceptions[0].error_class AS exception_error_class,
  error.exceptions[0].sql_state   AS exception_sql_state
FROM
  system.lakeflow_pipeline_events_preview.pipeline_events
WHERE
  level = 'ERROR'
  AND event_time >= current_timestamp() - INTERVAL 7 DAYS
QUALIFY
  ROW_NUMBER() OVER (PARTITION BY workspace_id, pipeline_id ORDER BY event_time DESC) = 1
ORDER BY
  event_time DESC
Hourly error rate
This query counts errors per pipeline per hour so you can spot spikes.
SELECT
  pipeline_id,
  date_trunc('HOUR', event_time) AS hour,
  count(*) AS num_errors
FROM
  system.lakeflow_pipeline_events_preview.pipeline_events
WHERE
  level = 'ERROR'
  AND event_time >= current_timestamp() - INTERVAL 7 DAYS
GROUP BY
  pipeline_id,
  date_trunc('HOUR', event_time)
ORDER BY
  hour DESC
Rows changed per flow
This query sums the rows a flow appended, upserted, and deleted per hour. Each metric is a per-micro-batch count, so summing over the window gives throughput.
SELECT
  origin.flow_name,
  date_trunc('HOUR', event_time) AS hour,
  SUM(
    ifnull(variant_get(details, '$.flow_progress.metrics.num_output_rows', 'BIGINT'), 0)
    + ifnull(variant_get(details, '$.flow_progress.metrics.num_upserted_rows', 'BIGINT'), 0)
    + ifnull(variant_get(details, '$.flow_progress.metrics.num_deleted_rows', 'BIGINT'), 0)
  ) AS rows_changed
FROM
  system.lakeflow_pipeline_events_preview.pipeline_events
WHERE
  event_type = 'flow_progress'
  AND event_time >= current_timestamp() - INTERVAL 7 DAYS
GROUP BY
  origin.flow_name,
  date_trunc('HOUR', event_time)
ORDER BY
  hour DESC,
  rows_changed DESC
Backlog per flow
This query returns the most recent backlog reading per flow. A COMPLETED flow is caught up, so its backlog is reported as 0.
WITH latest_flow_progress AS (
  SELECT
    workspace_id,
    pipeline_id,
    origin.flow_name,
    event_time,
    CASE
      WHEN variant_get(details, '$.flow_progress.status', 'STRING') = 'COMPLETED' THEN 0
      ELSE variant_get(details, '$.flow_progress.metrics.backlog_bytes', 'BIGINT')
    END AS backlog_bytes
  FROM
    system.lakeflow_pipeline_events_preview.pipeline_events
  WHERE
    event_type = 'flow_progress'
    AND event_time >= current_timestamp() - INTERVAL 1 HOUR
    AND (
      variant_get(details, '$.flow_progress.metrics.backlog_bytes', 'BIGINT') IS NOT NULL
      OR variant_get(details, '$.flow_progress.status', 'STRING') = 'COMPLETED'
    )
  QUALIFY
    ROW_NUMBER() OVER (PARTITION BY workspace_id, pipeline_id, origin.flow_name ORDER BY event_time DESC) = 1
)
SELECT *
FROM latest_flow_progress
WHERE backlog_bytes > 0
ORDER BY backlog_bytes DESC
Failed expectations by dataset
This query returns expectations that failed records per dataset, per update, in the last day. It keys on the expectation's own dataset, which is populated even when the event's origin.dataset_name is not.
SELECT
  pipeline_id,
  update_id,
  coalesce(expectation.dataset, origin.dataset_name) AS dataset_name,
  expectation.name AS expectation_name,
  SUM(expectation.failed_records) AS failed_records
FROM
  system.lakeflow_pipeline_events_preview.pipeline_events
  LATERAL VIEW explode(variant_get(details, '$.flow_progress.data_quality.expectations', 'ARRAY<STRUCT<name:STRING,dataset:STRING,passed_records:BIGINT,failed_records:BIGINT>>')) AS expectation
WHERE
  event_type = 'flow_progress'
  AND event_time >= current_timestamp() - INTERVAL 1 DAY
GROUP BY
  pipeline_id,
  update_id,
  coalesce(expectation.dataset, origin.dataset_name),
  expectation.name
HAVING
  SUM(expectation.failed_records) > 0
ORDER BY
  failed_records DESC