Note
Access to this page requires authorization. You can try signing in or changing directories.
Access to this page requires authorization. You can try changing directories.
Important
Lakebase Autoscaling is the latest version of Lakebase, with autoscaling compute, scale-to-zero, branching, and instant restore. For supported regions, see Region availability. If you are a Lakebase Provisioned user, see Lakebase Provisioned.
Monitor active queries in your Lakebase Postgres project to track running queries, identify performance bottlenecks, and analyze query execution in real time.
View active queries
- From the Lakebase App, select your project.
- In the sidebar, select a branch.
- Go to Monitoring.
- Select the Active queries tab.
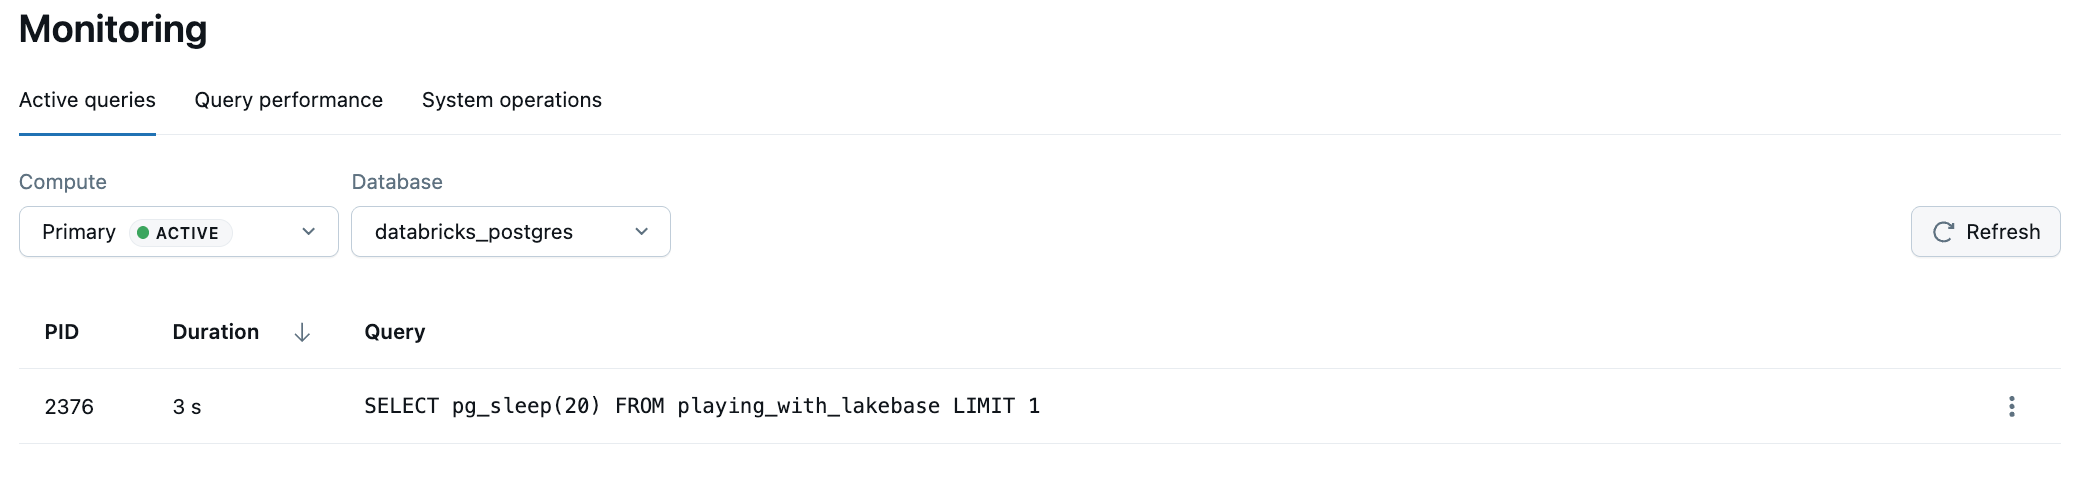
The Active queries view displays up to 100 currently running queries for the selected branch. Select the Compute, Database, and Role from the dropdowns, then use the Refresh button to update the list with the latest active queries.
This view queries the pg_stat_activity Postgres system view to show real-time query activity.
Understanding the Active queries view
The Active queries table displays the following information for each running query:
- PID: The process ID of the Postgres backend executing the query. This unique identifier can be used to track or terminate specific queries if needed.
- Duration: The elapsed time the query has been running. Click the column header to sort queries by duration to identify long-running operations.
- Query: The SQL statement being executed. This shows the actual query text, which can help you identify performance issues or unexpected database activity.
About pg_stat_activity
The Active queries view is powered by the pg_stat_activity Postgres system view, which is available in Lakebase Postgres by default. To run custom queries against the data collected by pg_stat_activity, you can use the SQL Editor or any Postgres client, such as psql.
For details on pg_stat_activity, see pg_stat_activity in the PostgreSQL documentation.
Note
The pg_stat_activity system view only shows currently running queries. After a query completes, it no longer appears in the Active queries view.