Note
Access to this page requires authorization. You can try signing in or changing directories.
Access to this page requires authorization. You can try changing directories.
This page explains how to work with query results in the new Databricks SQL editor, including visualizations, downloads, and filters.
View query results
You can compare the output from each statement with multiple result statements. When you run multiple SQL statements from a single edit window, you can use the UI in the Output pane near the bottom of the page to scroll through the different result sets.
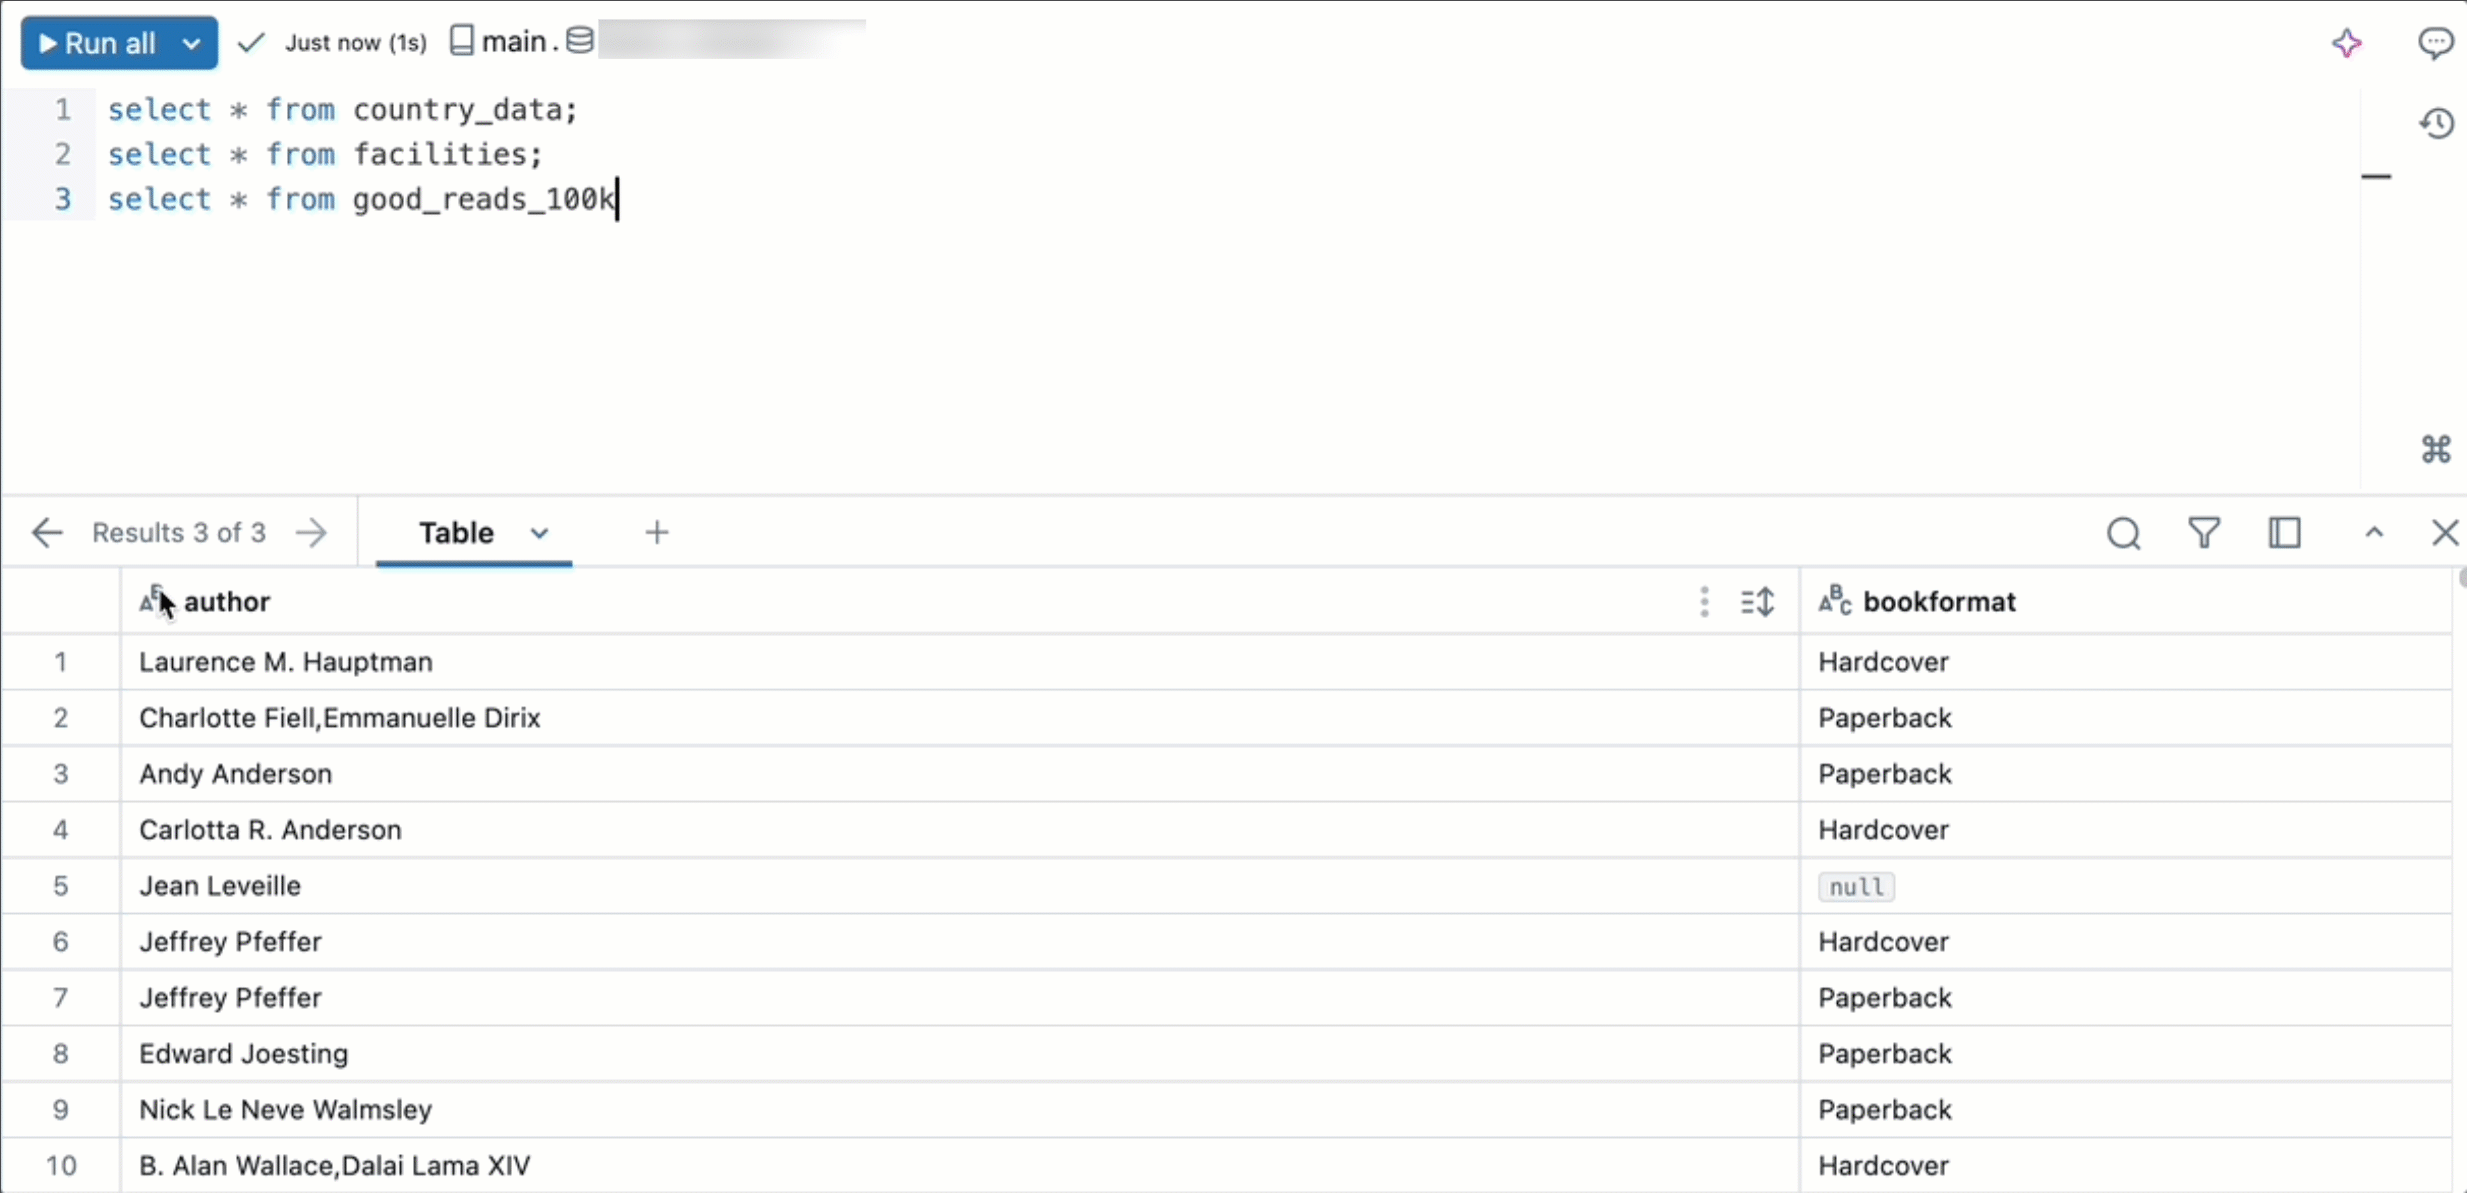
You can interact with and explore your query results using the result pane. The result pane includes the following features for exploring results.
Visualizations
Click the ![]() to open the Visualization Editor. Visualizations can help explore the result set. See Notebook and SQL editor visualization types for a complete list of available visualization types.
to open the Visualization Editor. Visualizations can help explore the result set. See Notebook and SQL editor visualization types for a complete list of available visualization types.
Click the ![]() on a visualization tab to show additional options.
on a visualization tab to show additional options.
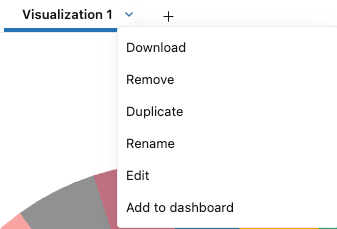
- Click Download to download the data represented in the visualization as a CSV, TSV, or Excel file.
- Click Remove to delete the visualization.
- Click Duplicate to clone the results tab.
- Click Rename to retitle the visualization.
- Click Edit to edit the visualization.
- Click Add to dashboard to copy the query and visualization to a new AI/BI dashboard.
- Select Create new dashboard or Add to existing dashboard.
- Create new dashboard: Creates a new dashboard that includes all the visualizations associated with the query. You are prompted to choose a name for the new dashboard. The new dashboard is saved to your Home folder.
- Add to existing dashboard: Adds your query and associated visualizations to an existing dashboard. Use the drop-down menu to choose the dashboard that the data set and visualization should be added to.
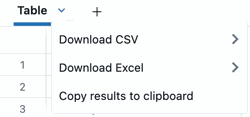
Download results
You can download results as a CSV or Excel file. Click the ![]() in a Table tab to view download options. You can also copy reults to your clipboard using this menu.
in a Table tab to view download options. You can also copy reults to your clipboard using this menu.
You can download up to approximately 1GB of results data in CSV or TSV format and up to 100,000 rows to an Excel file. The final file download size might be slightly more or less than 1GB, because the 1GB limit is applied to an earlier step than the final file download.
Note
If you cannot download a query, your workspace administrator has disabled download for your workspace.
Copy selected results
To copy a smaller selection of rows from your query results, select the rows in the results table, right-click, and select Copy.
Filters
Filters allow you to limit the result set after a query has run. You can apply filters to selectively show different subsets of the data. Use Genie Code to help you add a filter for results.
To add a filter:
- Click
 the filter icon.
 - Enter text to describe the kind of filter you want to apply. A named filter is applied to the result set.
To edit a filter:
- Click the name of the filter.
- Use the drop-down menus and text fields to adjust the filter settings.
- (Optional) Select Case senstitive to make the filter case sensitive.
- (Optional) Click Add OR condition to add an additional filter.
Supported filter types
The following table shows filter types supported in the new SQL editor. The second column indicates whether the filter also works in the legacy SQL editor.
| Filter type | Supported in legacy editor |
|---|---|
| Is equal to | Yes |
| Is not equal to | No |
| Is one of | Yes |
| Is not one of | No |
| Contains | Yes |
| Does not contain | No |
| Starts with | Yes |
| Does not start with | No |
| Ends with | No |
| Does not end with | No |
| Is null | No |
| Is not null | No |
| Greater than | No |
| Greater than or equal to | No |
| Less than | No |
| Less than or equal to | No |
| Between | Yes |
| Before | No |
| After | No |
| Is true | Yes |
| Is false | Yes |
| OR conditions | No |