Note
Access to this page requires authorization. You can try signing in or changing directories.
Access to this page requires authorization. You can try changing directories.
Azure Monitor collects and aggregates metrics and logs from your system to monitor availability, performance, and resilience, and notify you of issues affecting your system. You can use the Azure portal, PowerShell, Azure CLI, REST API, or client libraries to set up and view monitoring data.
Different metrics and logs are available for different resource types. This article describes the types of monitoring data you can collect for this service and ways to analyze that data.
Collect data with Azure Monitor
This table describes how you can collect data to monitor your service, and what you can do with the data once collected:
| Data to collect | Description | How to collect and route the data | Where to view the data | Supported data |
|---|---|---|---|---|
| Metric data | Metrics are numerical values that describe an aspect of a system at a particular point in time. Metrics can be aggregated using algorithms, compared to other metrics, and analyzed for trends over time. | - Collected automatically at regular intervals. - You can route some platform metrics to a Log Analytics workspace to query with other data. Check the DS export setting for each metric to see if you can use a diagnostic setting to route the metric data. |
Metrics explorer | Azure DDoS Protection metrics supported by Azure Monitor |
| Resource log data | Logs are recorded system events with a timestamp. Logs can contain different types of data, and be structured or free-form text. You can route resource log data to Log Analytics workspaces for querying and analysis. | Create a diagnostic setting to collect and route resource log data. | Log Analytics | Azure DDoS Protection resource log data supported by Azure Monitor |
| Activity log data | The Azure Monitor activity log provides insight into subscription-level events. The activity log includes information like when a resource is modified or a virtual machine is started. | - Collected automatically. - Create a diagnostic setting to a Log Analytics workspace at no charge. |
Activity log |
For the list of all of the data supported by Azure Monitor, see:
Built in monitoring for Azure DDoS Protection
Azure DDoS Protection offers in-depth insights and visualizations of attack patterns through DDoS Attack Analytics. It provides customers with comprehensive visibility into attack traffic and mitigation actions via reports and flow logs. During a DDoS attack, detailed metrics are available through Azure Monitor, which also allows alert configurations based on these metrics.
You can view and configure Azure DDoS protection telemetry.
Telemetry for an attack is provided through Azure Monitor in real time. While mitigation triggers for TCP SYN, TCP & UDP are available during peace-time, other telemetry is available only when a public IP address has been under mitigation.
You can view DDoS telemetry for a protected public IP address through three different resource types: DDoS protection plan, virtual network, and public IP address.
Logging can be further integrated with Microsoft Sentinel, Splunk (Azure Event Hubs), OMS Log Analytics, and Azure Storage for advanced analysis via the Azure Monitor Diagnostics interface.
For more information on metrics, see Monitoring Azure DDoS Protection for details on DDoS Protection monitoring logs.
View metrics from DDoS protection plan
Sign in to the Azure portal and select your DDoS protection plan.
On the Azure portal menu, select or search for and select DDoS protection plans then select your DDoS protection plan.
Under Monitoring, select Metrics.
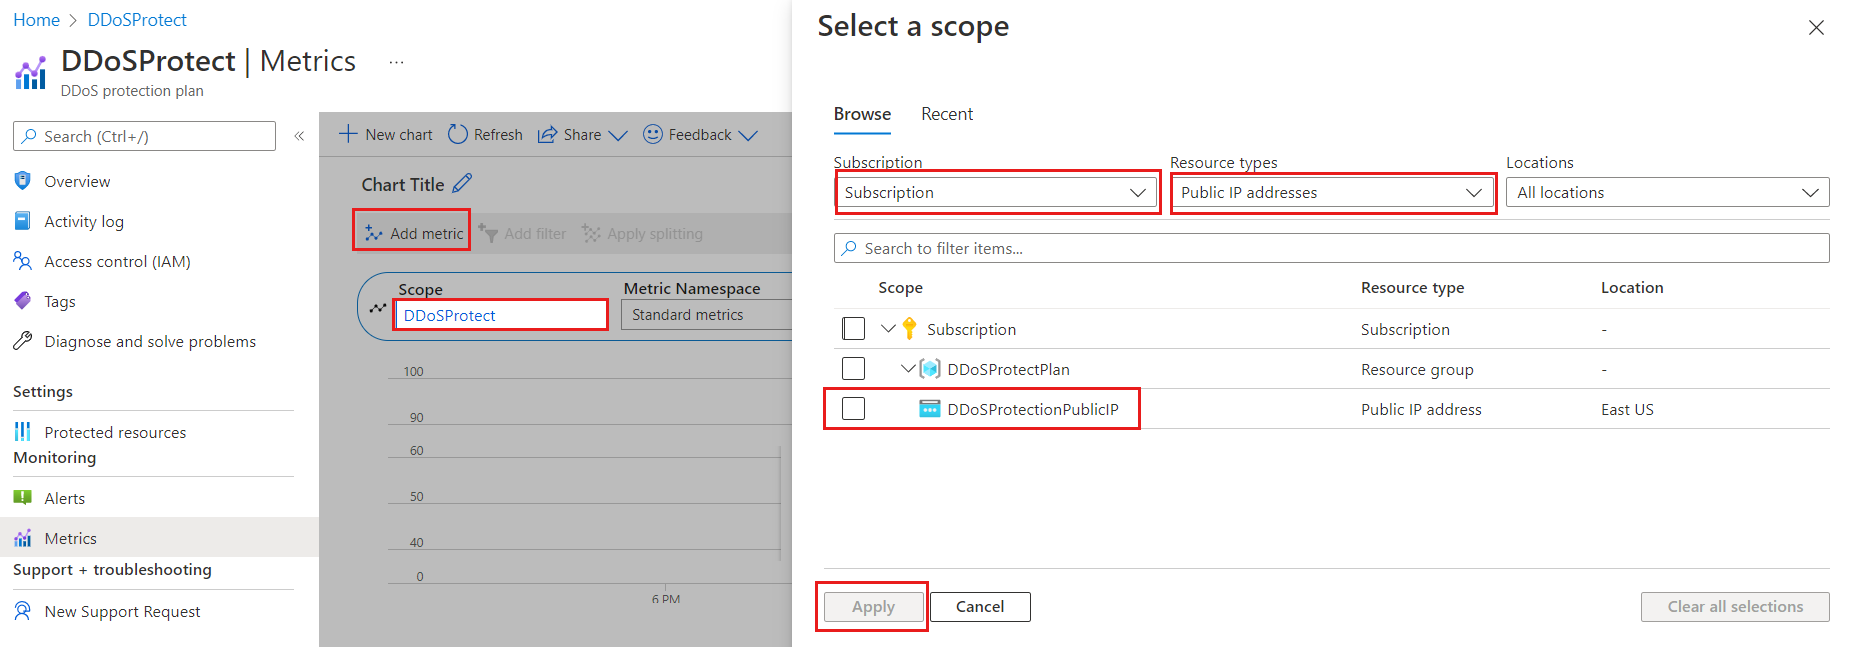
Select Add metric then select Scope.
In the Select a scope menu, select the Subscription that contains the public IP address you want to log.
Select Public IP Address for Resource type then select the specific public IP address you want to log metrics for, and then select Apply.
For Metric select Under DDoS attack or not.
Select the Aggregation type as Max.

View metrics from virtual network
Sign in to the Azure portal and browse to your virtual network that has DDoS protection enabled.
Under Monitoring, select Metrics.
Select Add metric then select Scope.
In the Select a scope menu, select the Subscription that contains the public IP address you want to log.
Select Public IP Address for Resource type then select the specific public IP address you want to log metrics for, and then select Apply.
Under Metric select your chosen metric then under Aggregation select type as Max.
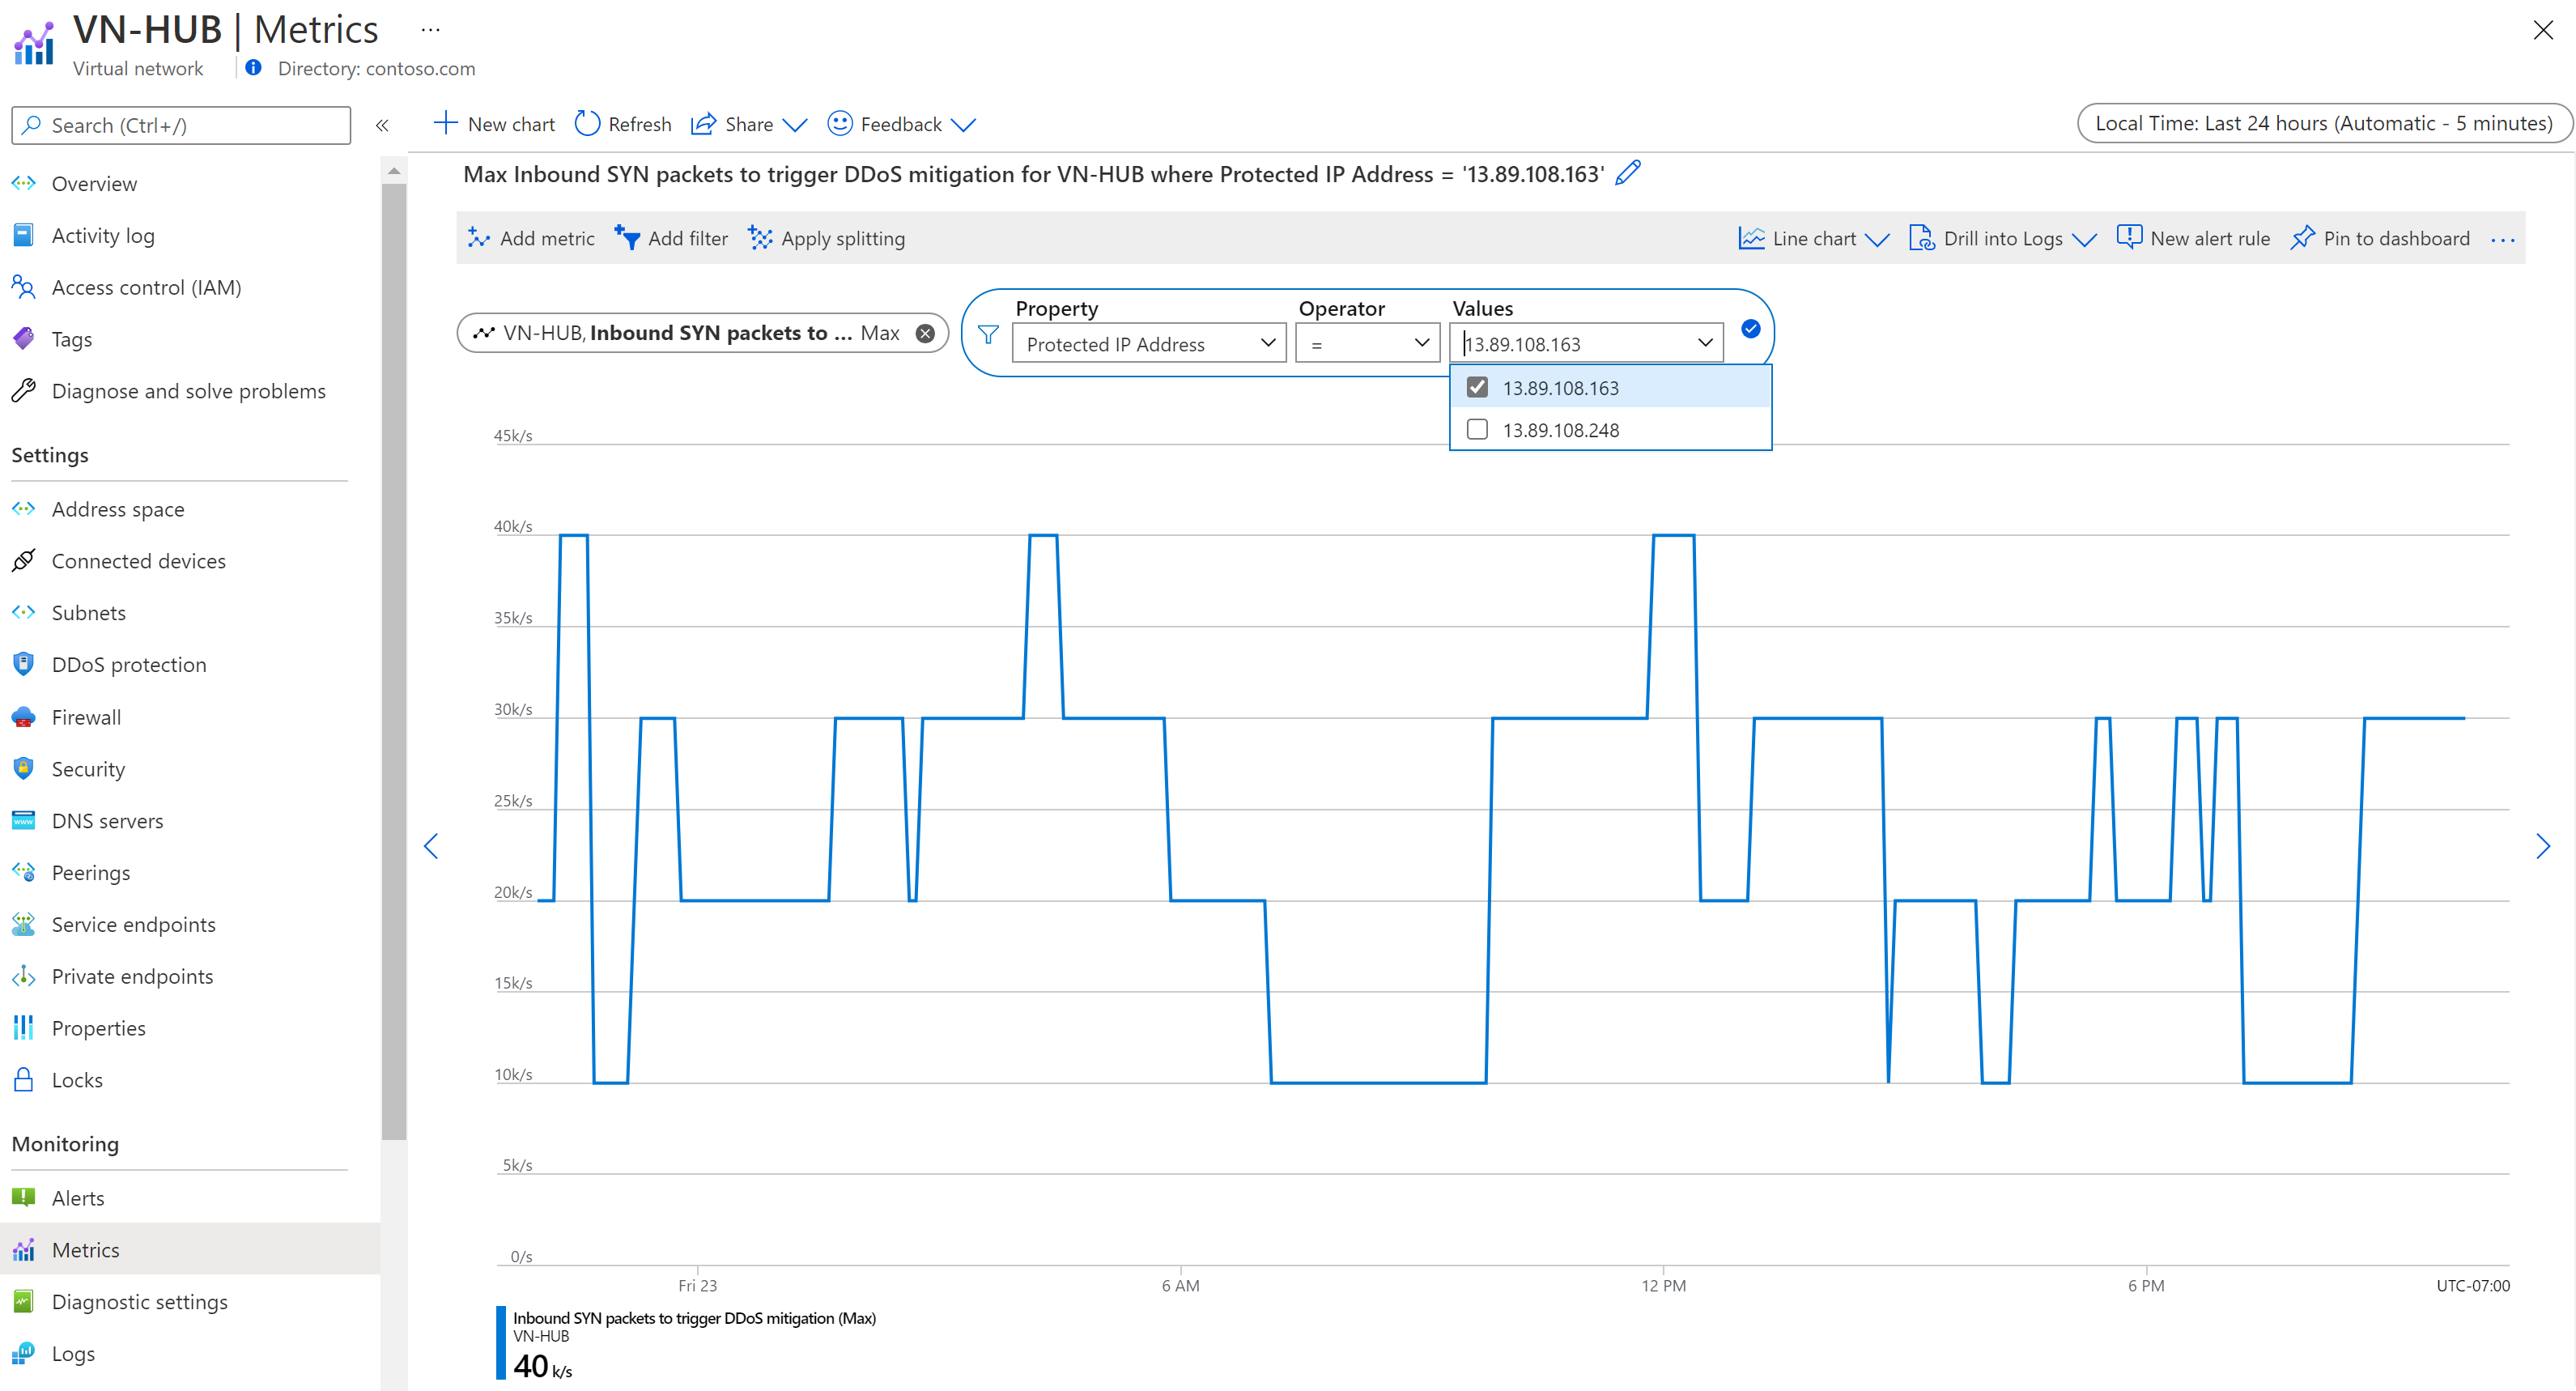

Note
To filter IP Addresses, select Add filter. Under Property, select Protected IP Address, and the operator should be set to =. Under Values, you see a dropdown of public IP addresses, associated with the virtual network, that are protected by Azure DDoS Protection.
View metrics from Public IP address
- Sign in to the Azure portal and browse to your public IP address.
- On the Azure portal menu, select or search for and select Public IP addresses then select your public IP address.
- Under Monitoring, select Metrics.
- Select Add metric then select Scope.
- In the Select a scope menu, select the Subscription that contains the public IP address you want to log.
- Select Public IP Address for Resource type then select the specific public IP address you want to log metrics for, and then select Apply.
- Under Metric select your chosen metric then under Aggregation select type as Max.
Note
When you change DDoS IP protection from enabled to disabled, telemetry for the public IP resource isn't available.
View DDoS mitigation policies
Azure DDoS Protection uses three automatically adjusted mitigation policies (TCP SYN, TCP, and UDP) for each public IP address of the resource being protected. This approach applies to any virtual network with DDoS protection enabled.
You can see the policy limits within your public IP address metrics by choosing the Inbound SYN packets to trigger DDoS mitigation, Inbound TCP packets to trigger DDoS mitigation, and Inbound UDP packets to trigger DDoS mitigation metrics. Make sure to set the aggregation type to Max.

View peace time traffic telemetry
It's important to keep an eye on the metrics for TCP SYN, UDP, and TCP detection triggers. These metrics help you know when DDoS protection starts. Make sure these triggers reflect the normal traffic levels when there's no attack.
You can make a chart for the public IP address resource. In this chart, include the Packet Count and SYN Count metrics. The Packet count includes both TCP and UDP Packets. This shows you the sum of traffic.

Note
To make a fair comparison, you need to convert the data to packets-per-second. You can do this conversion by dividing the number you see by 60, as the data represents the number of packets, bytes, or SYN packets collected over 60 seconds. For example, if you have 91,000 packets collected over 60 seconds, divide 91,000 by 60 to get approximately 1,500 packets-per-second (pps).
Validate and test
To simulate a DDoS attack to validate DDoS protection telemetry, see Validate DDoS detection.
Use Azure Monitor tools to analyze the data
These Azure Monitor tools are available in the Azure portal to help you analyze monitoring data:
Some Azure services have a built-in monitoring dashboard in the Azure portal. These dashboards are called insights, and you can find them in the Insights section of Azure Monitor in the Azure portal.
Metrics explorer allows you to view and analyze metrics for Azure resources. For more information, see Analyze metrics with Azure Monitor metrics explorer.
Log Analytics allows you to query and analyze log data using the Kusto query language (KQL). For more information, see Get started with log queries in Azure Monitor.
The Azure portal has a user interface for viewing and basic searches of the activity log. To do more in-depth analysis, route the data to Azure Monitor logs and run more complex queries in Log Analytics.
Application Insights monitors the availability, performance, and usage of your web applications, so you can identify and diagnose errors without waiting for a user to report them.
Application Insights includes connection points to various development tools and integrates with Visual Studio to support your DevOps processes. For more information, see Application monitoring for App Service.
Tools that allow more complex visualization include:
- Dashboards that let you combine different kinds of data into a single pane in the Azure portal.
- Workbooks, customizable reports that you can create in the Azure portal. Workbooks can include text, metrics, and log queries.
- Grafana, an open platform tool that excels in operational dashboards. You can use Grafana to create dashboards that include data from multiple sources other than Azure Monitor.
- Power BI, a business analytics service that provides interactive visualizations across various data sources. You can configure Power BI to automatically import log data from Azure Monitor to take advantage of these visualizations.
Export Azure Monitor data
You can export data out of Azure Monitor into other tools using:
Metrics: Use the REST API for metrics to extract metric data from the Azure Monitor metrics database. For more information, see Azure Monitor REST API reference.
Logs: Use the REST API or the associated client libraries.
To get started with the Azure Monitor REST API, see Azure monitoring REST API walkthrough.
Use Kusto queries to analyze log data
You can analyze Azure Monitor Log data using the Kusto query language (KQL). For more information, see Log queries in Azure Monitor.
Use Azure Monitor alerts to notify you of issues
Azure Monitor alerts allow you to identify and address issues in your system, and proactively notify you when specific conditions are found in your monitoring data before your customers notice them. You can alert on any metric or log data source in the Azure Monitor data platform. There are different types of Azure Monitor alerts depending on the services you're monitoring and the monitoring data you're collecting. See Choosing the right type of alert rule.
Recommended Azure Monitor alert rules for Azure DDoS Protection
For more information about alerts in Azure DDoS Protection, see Configure Azure DDoS Protection metric alerts through portal and Configure Azure DDoS Protection diagnostic logging alerts.
For examples of common alerts for Azure resources, see Sample log alert queries.
Implementing alerts at scale
For some services, you can monitor at scale by applying the same metric alert rule to multiple resources of the same type that exist in the same Azure region. Azure Monitor Baseline Alerts (AMBA) provides a semi-automated method of implementing important platform metric alerts, dashboards, and guidelines at scale.