Note
Access to this page requires authorization. You can try signing in or changing directories.
Access to this page requires authorization. You can try changing directories.
The number of IoT devices continues to grow exponentially across enterprise networks, such as printers, Voice over Internet Protocol (VoIP) devices, smart TVs, and conferencing systems scattered around many office buildings.
While the number of IoT devices continues to grow, they often lack the security safeguards that are common on managed endpoints like laptops and mobile phones. To bad actors, these unmanaged devices can be used as a point of entry for lateral movement or evasion, and too often, the use of such tactics leads to the exfiltration of sensitive information.
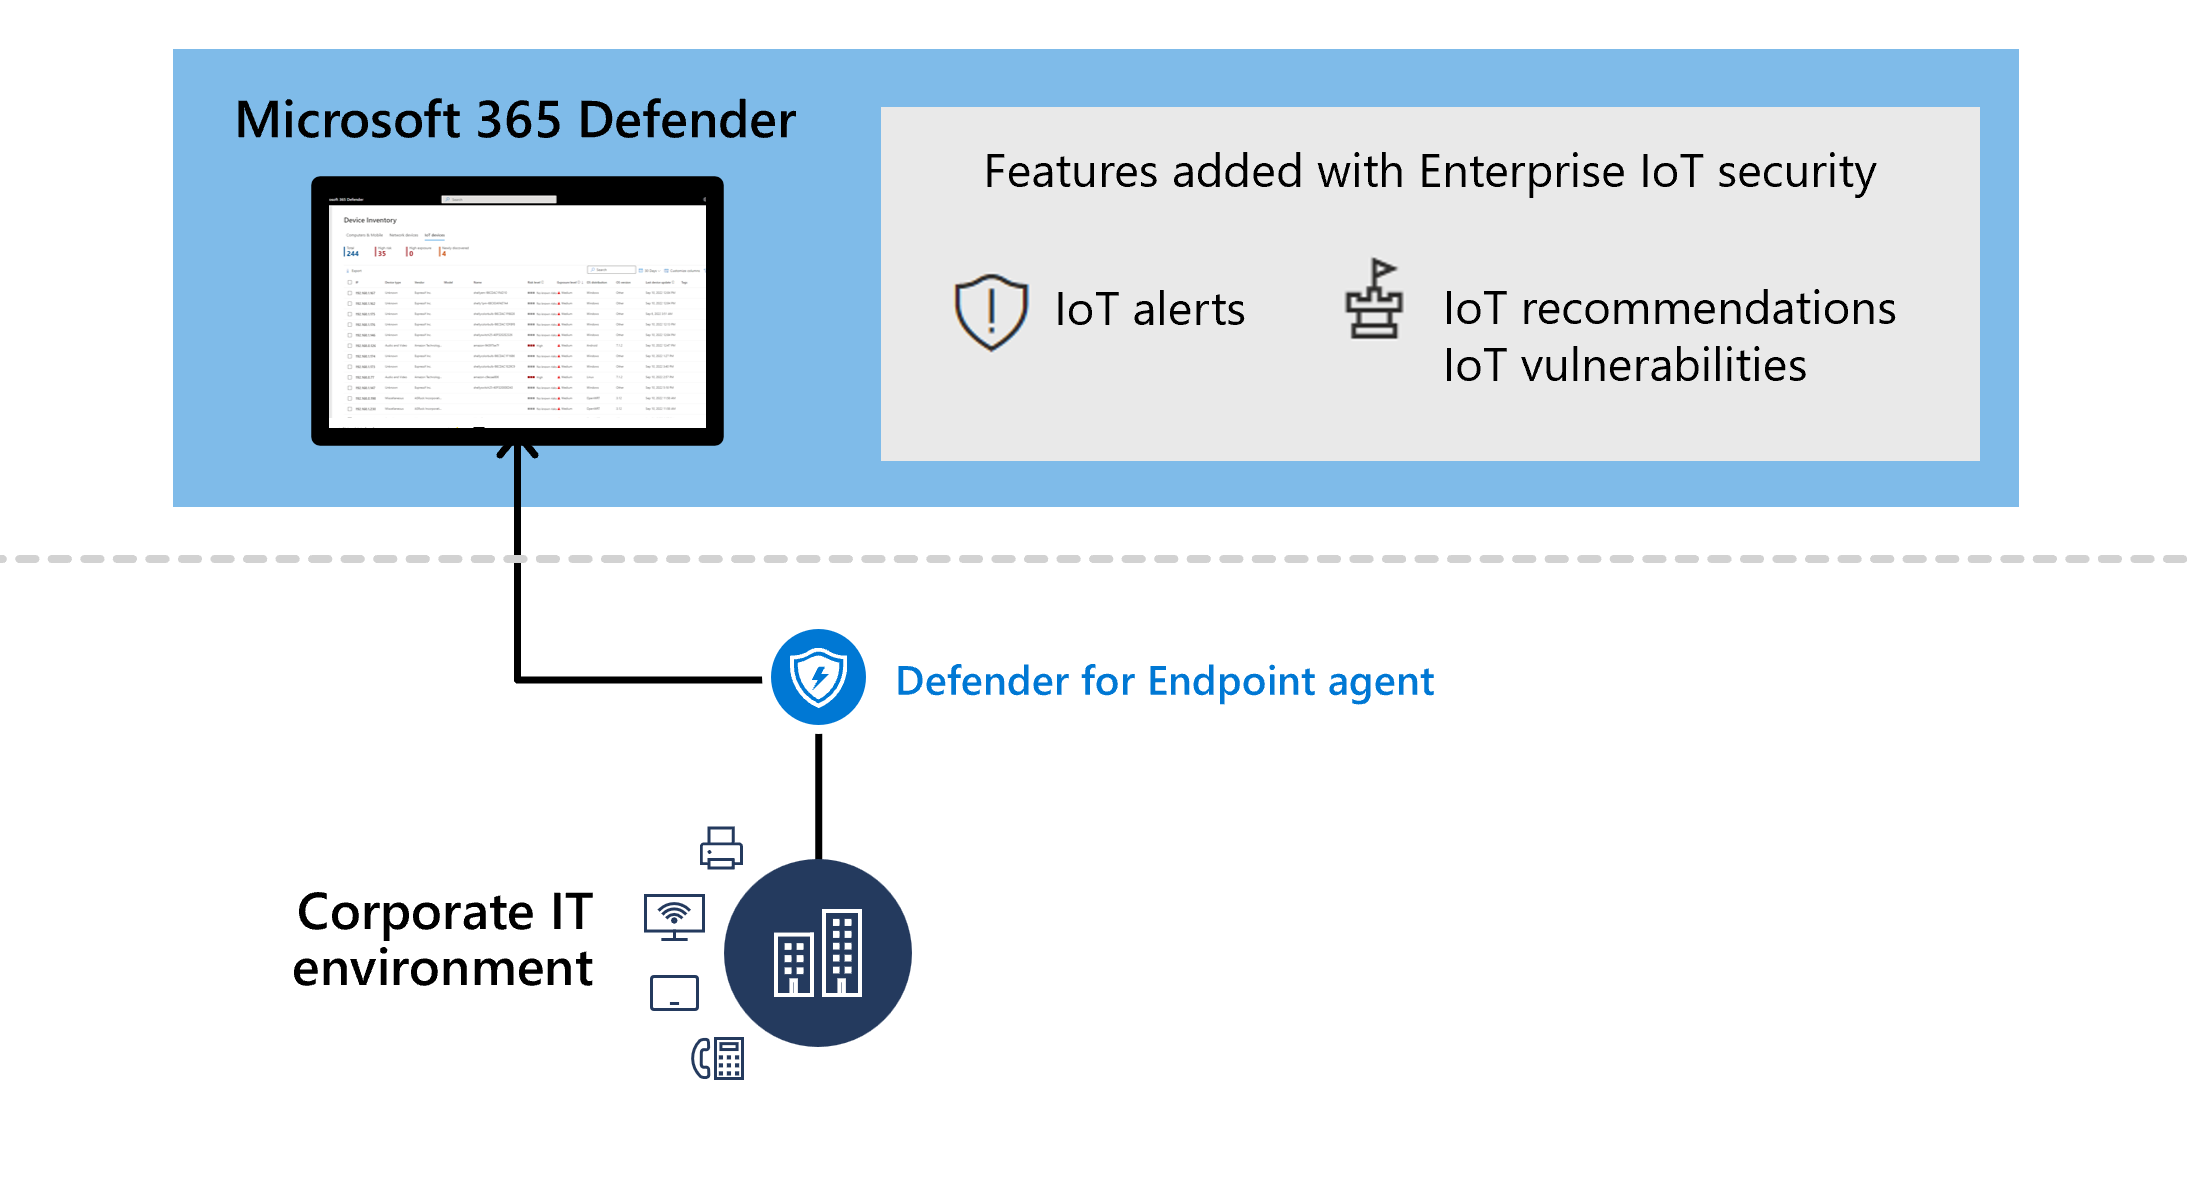
Microsoft Defender for IoT seamlessly integrates with Microsoft Defender XDR and Microsoft Defender for Endpoint to provide both IoT device discovery and security value for IoT devices, including purpose-built recommendations, and vulnerability data.
Enterprise IoT security in Microsoft Defender XDR
Enterprise IoT security in Microsoft Defender XDR provides IoT-specific security value, including risk and exposure levels, vulnerabilities, and recommendations in Microsoft Defender XDR.
If you're a Microsoft 365 E5 (ME5)/ E5 Security and Defender for Endpoint P2 customer, toggle on support for Enterprise IoT Security in the Microsoft Defender Portal.
If you don't have ME5/E5 Security licenses, but you're a Microsoft Defender for Endpoint customer, start with a free trial or purchase standalone, per-device licenses to gain the same IoT-specific security value.

Recommendations
The following Defender for Endpoint security recommendations are supported for Enterprise IoT devices:
- Require authentication for Telnet management interface
- Disable insecure administration protocol – Telnet
- Remove insecure administration protocols SNMP V1 and SNMP V2
- Require authentication for VNC management interface
For more information, see Security recommendations.
Frequently asked questions
This section provides a list of frequently asked questions about securing Enterprise IoT networks with Microsoft Defender for IoT.
What is the difference between OT and Enterprise IoT?
Operational Technology (OT): OT network sensors use agentless, patented technology to discover, learn, and continuously monitor network devices for a deep visibility into Operational Technology (OT) / Industrial Control System (ICS) risks. Sensors carry out data collection, analysis, and alerting on-site, making them ideal for locations with low bandwidth or high latency.
Enterprise IoT: Enterprise IoT provides visibility and security for IoT devices in the corporate environment.
Enterprise IoT network protection extends agentless features beyond operational environments, providing coverage for all IoT devices in your environment. For example, an enterprise IoT environment might include printers, cameras, and purpose-built, proprietary, devices.
Which devices are supported for Enterprise IoT security?
Enterprise IoT security encompasses a broad spectrum of devices, identified by Defender for Endpoint using both passive and active discovery methods.
The supported devices include an extensive range of hardware models and vendors, spanning corporate IoT devices such as printers, cameras, and VoIP phones, among others.
For more information, see Defender for IoT devices.
How can I start using Enterprise IoT?
Microsoft E5 (ME5) and E5 Security customers already have devices supported for enterprise IoT security. If you only have a Defender for Endpoint P2 license, you can purchase standalone, per-device licenses for enterprise IoT monitoring, or use a trial.
For more information, see:
- Get started with enterprise IoT monitoring in Microsoft Defender XDR
- Manage enterprise IoT monitoring support with Microsoft Defender for IoT
What permissions do I need to use Enterprise IoT security with Defender for IoT?
For information on required permissions, see Prerequisites.
Which devices are billable?
For more information, see Devices monitored by Defender for IoT.
How should I estimate the number of devices I want to monitor?
For more information, see Calculate monitored devices for Enterprise IoT monitoring.
How can I cancel Enterprise IoT?
For more information, see Turn off enterprise IoT security.
What happens when the trial ends?
If you haven't added a standalone license by the time your trial ends, your trial is automatically canceled, and you lose access to Enterprise IoT security features.
For more information, see Defender for IoT subscription billing.
How can I resolve billing issues associated with my Defender for IoT plan?
For any billing or technical issues, open a support ticket for Microsoft Defender XDR.
Related content
For more information, see:
- Get started with enterprise IoT monitoring in Microsoft 365 Defender
- Defender for IoT subscription billing
- Device discovery overview
- Alerts queue in Microsoft 365 Defender
- Security recommendations
- Vulnerabilities in my organization
- Manage your device inventory from the Azure portal
- Proactively hunt with advanced hunting in Microsoft 365 Defender
Next steps
Start securing your Enterprise IoT network resources with by onboarding to Defender for IoT from Microsoft Defender XDR.