Manage your OT device inventory from an on-premises management console (Legacy)
Important
Defender for IoT now recommends using Microsoft cloud services or existing IT infrastructure for central monitoring and sensor management, and plans to retire the on-premises management console on January 1st, 2025.
For more information, see Deploy hybrid or air-gapped OT sensor management.
Use the Device inventory page from an on-premises management console to manage all OT and IT devices detected by sensors connected to that console. Identify new devices detected, devices that might need troubleshooting, and more.
For more information, see Devices monitored by Defender for IoT.
Tip
Alternately, view your device inventory from the Azure portal, or from an OT sensor console.
Prerequisites
Before performing the procedures in this article, make sure that you have:
An on-premises management console installed, activated, and configured. To view devices by zone, make sure that you've configured sites and zones on the on-premises management console.
One or OT network sensors installed, configured, and activated, and connected to your on-premises management console. To view devices per zone, make sure that each sensor is assigned to a specific zone.
Access to the on-premises management console with one of the following user roles:
To view devices the on-premises management console, sign in as an Admin, Security Analyst, or Viewer user.
To export or import data, sign in as an Admin or Security Analyst user.
To use the CLI, access the CLI via SSH/Telnet as a privileged user.
View the device inventory
To view detected devices in the Device Inventory page in an on-premises management console, sign-in to your on-premises management console, and then select Device Inventory.
For example:

Use any of the following options to modify or filter the devices shown:
| Option | Steps |
|---|---|
| Sort devices | To sort the grid by a specific column, select the Sort |
| Filter devices shown | 1. In the column that you want to filter, select the Filter button 2. In the Filter box, define your filter value. Filters aren't saved when you refresh the Device Inventory page. |
| Save a filter | To save the current set of filters, select the Save As button that appears in the filter row. |
| Load a saved filter | Saved filters are listed on the left, in the Groups pane. 1. Select the Options  button in the toolbar to display the Groups pane.
 2. In the Device Inventory Filters list, select the saved filter you want to load. |
For more information, see Device inventory column data.
View device inventory by zone
To view alerts from connected OT sensors for a specific zone, use the Site Management page on an on-premises management console.
Sign into your on-premises management console and select Site Management.
Locate the site and zone you want to view, using the filtering options at the top as needed:
- Connectivity: Select to view only all OT sensors, or only connected / disconnected sensors only.
- Upgrade Status: Select to view all OT sensors, or only those with a specific software update status.
- Business Unit: Select to view all OT sensors, or only those from a specific business unit.
- Region: Select to view all OT sensors, or only those from a specific region.
Select View device inventory for a specific OT sensor to jump to the device inventory for that OT sensor.
Export the device inventory to CSV
Export your device inventory to a CSV file to manage or share data outside of the OT sensor.
To export device inventory data, select the Import/Export file ![]() button, and then select one of the following:
button, and then select one of the following:
- Export Device Inventory View: Exports only the devices currently displayed, with the current filter applied
- Export All Device Inventory: Exports the entire device inventory, with no filtering
Save the exported file locally.
Note
The date format on the on-premises management console is always set to DD/MM/YYYY. We recommend that you use the same date format on any machine where you'll be opening exported inventory files to ensure that dates in the exported inventory files are shown correctly.
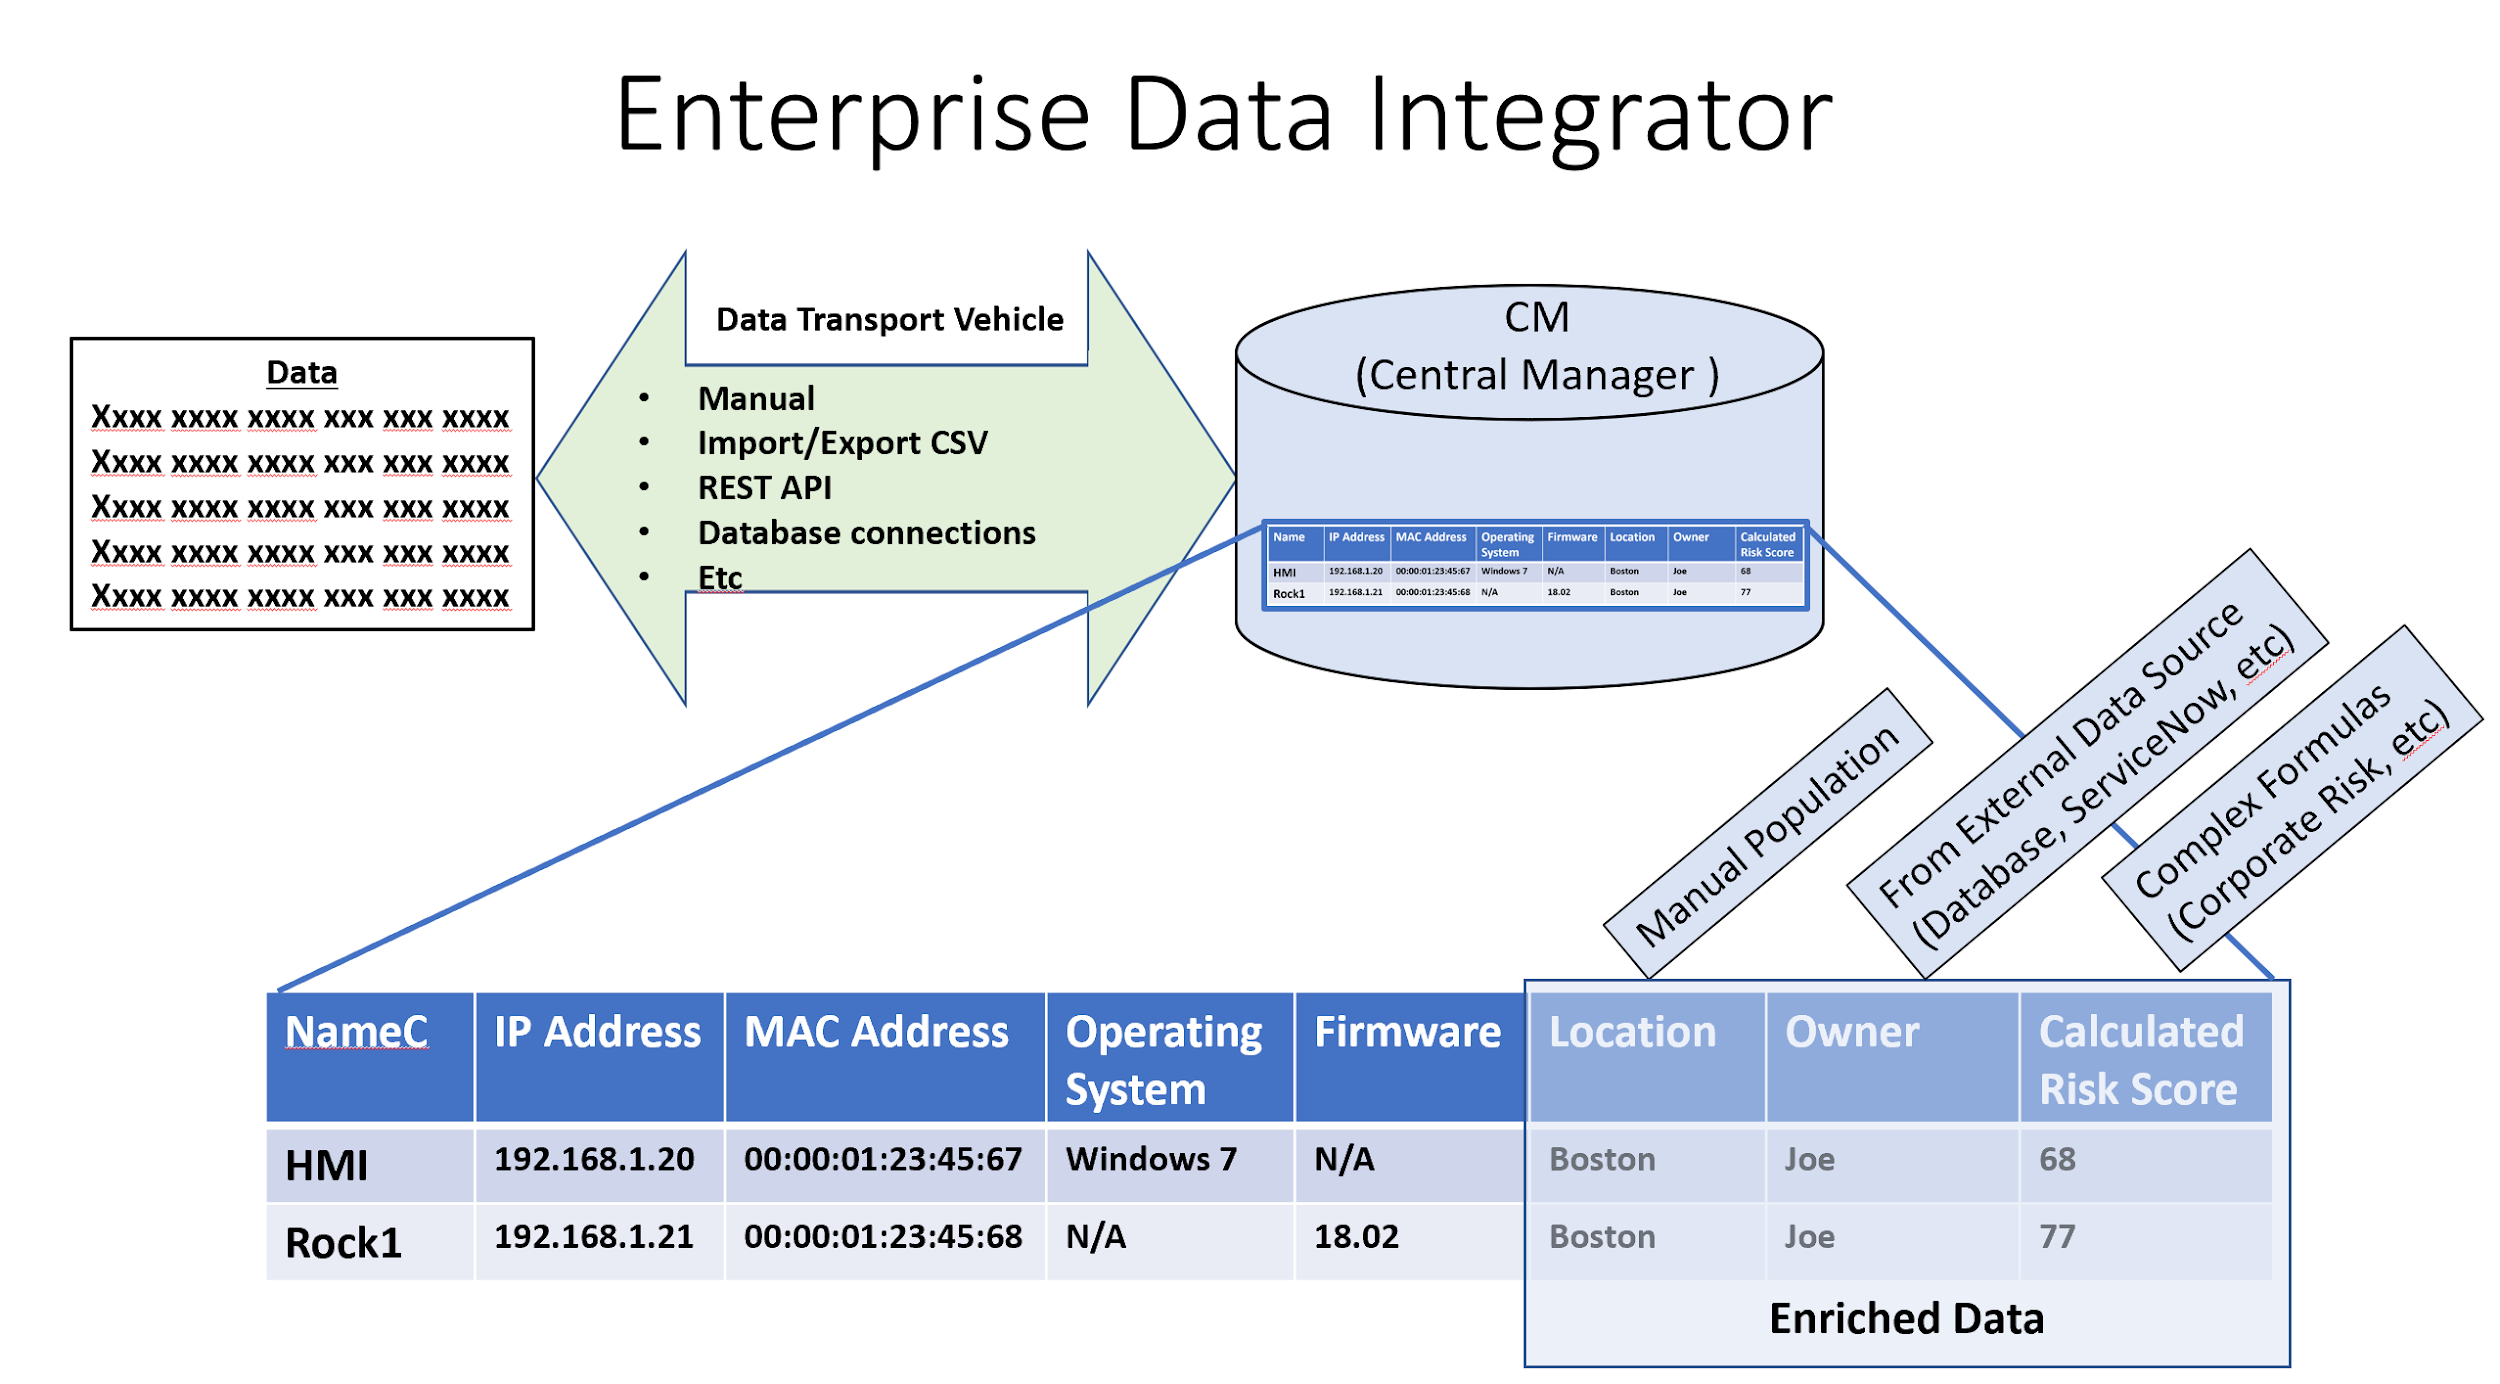
Add to and enhance device inventory data
Use information from other sources, such as CMDBs, DNS, firewalls, and Web APIs, to enhance the data shown in your device inventory. For example, use enhanced data to present information about the following items:
- Device purchase dates and end-of-warranty dates
- Users responsible for each device
- Opened tickets for devices
- The last date when the firmware was upgraded
- Devices allowed access to the internet
- Devices running active antivirus applications
- Users signed in to devices
Added and enhancement data is shown as extra columns, in addition to the existing columns available in the on-premises management console Device inventory page.
Enhance data by adding it manually or by running a customized version of our automation script sample. You can also open a support ticket to set up your system to receive Web API queries.
For example, the following image shows an example of how you might use enhanced data in the device inventory:
To enhance your data manually:
Sign in to your on-premises management console, and select Device inventory.
On the top-right, select the Settings
 button to open the Device Inventory Settings dialog.
In the Device Inventory Settings dialog box, select ADD CUSTOM COLUMN.
In the Add Custom Column dialog box, add the new column name using up to 250 UTF characters.
Select Manual > SAVE. The new item appears in the Device Inventory Settings dialog box.
In the upper-right corner of the Device Inventory window, select the Import/Export file
 button > Export All Device Inventory.
A CSV file is generated with the data displayed.
Download and open the CSV file for editing, and manually add your information to the new column.
Back in the Device inventory page, at the top-right, select the Import/Export file
button again > Import Manual Input Columns. Browse to and select your edited CSV file.
The new data appears in the Device Inventory grid.
Retrieve device inventory data via API
You can retrieve an extensive range of device information detected by managed sensors and integrate that information with partner systems.
For example:
Retrieve sensor, zone, site ID, IP address, MAC address, firmware, protocol, and vendor information.
Filter that information based on any of the following values:
Authorized and unauthorized devices.
Devices associated with specific sites.
Devices associated with specific zones.
Devices associated with specific sensors.
For more information, see Defender for IoT sensor and management console APIs.
Next steps
For more information, see:
Feedback
Coming soon: Throughout 2024 we will be phasing out GitHub Issues as the feedback mechanism for content and replacing it with a new feedback system. For more information see: https://aka.ms/ContentUserFeedback.
Submit and view feedback for