Audit user activity

After you've set up your user access for the Azure portal, on your OT network sensors and an on-premises management consoles, you'll want to be able to track and audit user activity across all of Microsoft Defender for IoT.

Audit Azure user activity

Use Microsoft Entra user auditing resources to audit Azure user activity across Defender for IoT. For more information, see:

Audit user activity on an OT network sensor

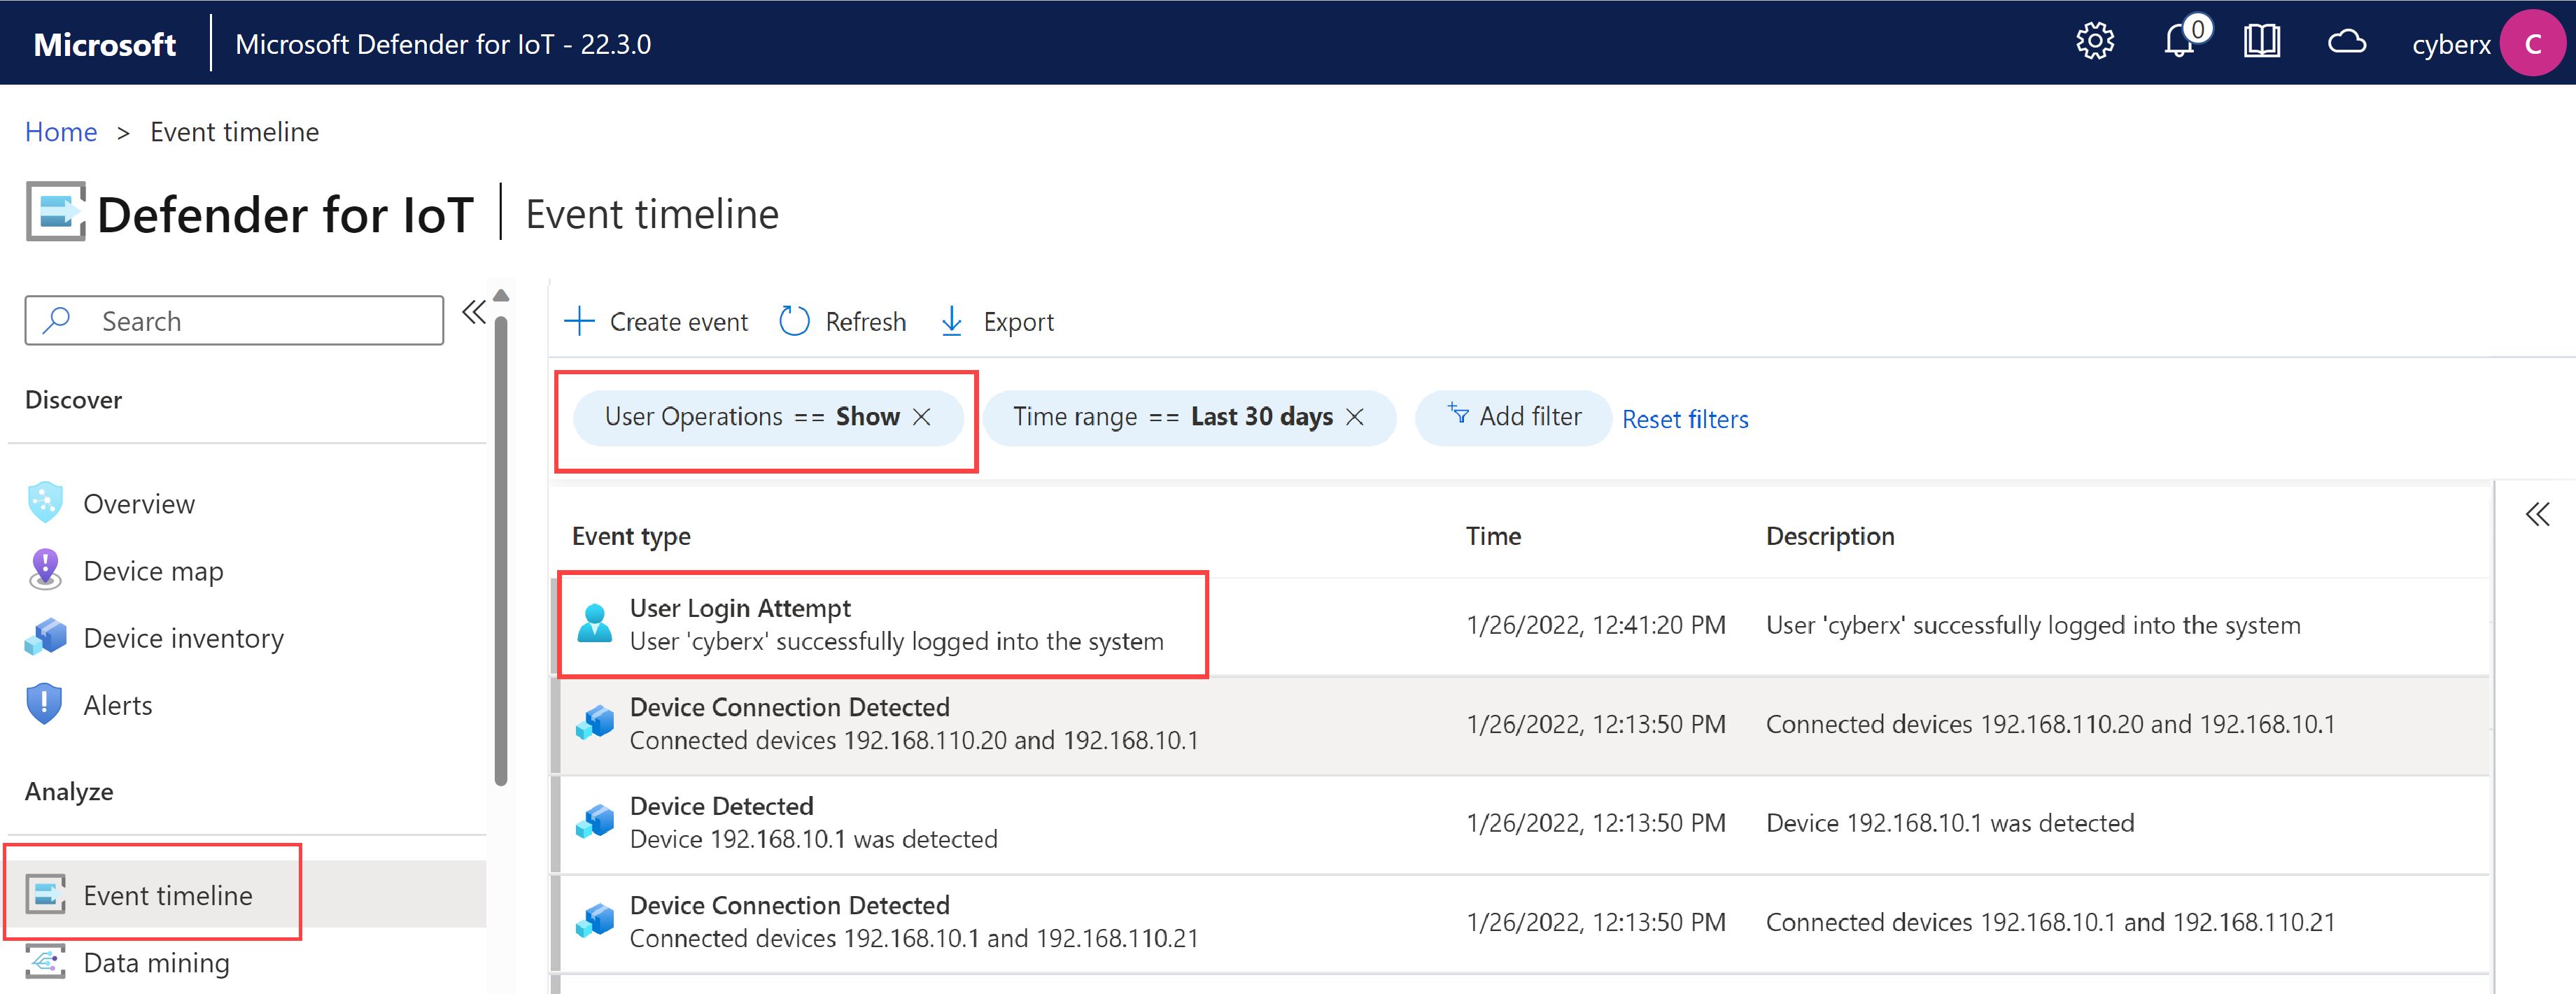
Audit and track user activity on a sensor's Event timeline. The Event timeline displays events that occurred on the sensor, affected devices for each event, and the time and date that the event occurred.

Note

This procedure is supported for the default, privileged admin users and any user with an Admin role.

To use the sensor's Event Timeline:

  1. Sign into the sensor console as the default, privileged admin users or any user with an Admin role.

  2. On the sensor, select Event Timeline from the left-hand menu. Make sure that the filter is set to show User Operations.

    For example:

    Screenshot of the Event Timeline on the sensor showing user activity.

  3. Use additional filters or search using CTRL+F to find the information of interest to you.

    For more information on the event timeline, see Track network and sensor activity with the event timeline

Audit user activity on an on-premises management console

Important

Defender for IoT now recommends using Microsoft cloud services or existing IT infrastructure for central monitoring and sensor management, and plans to retire the on-premises management console on January 1st, 2025.

For more information, see Deploy hybrid or air-gapped OT sensor management.

To audit and track user activity on an on-premises management console, use the on-premises management console audit logs, which record key activity data at the time of occurrence. Use on-premises management console audit logs to understand changes that were made on the on-premises management console, when, and by whom.

To access on-premises management console audit logs:

Sign in to the on-premises management console and select System Settings > System Statistics > Audit log.

The dialog displays data from the currently active audit log. For example:

For example:

Screenshot of the on-premises management console showing audit logs.

New audit logs are generated at every 10 MB. One previous log is stored in addition to the current active log file.

Audit logs include the following data:

Action Information logged
Learn, and remediation of alerts Alert ID
Password changes User, User ID
Login User
User creation User, User role
Password reset User name
Exclusion rules-Creation Rule summary
Exclusion rules-Editing Rule ID, Rule Summary
Exclusion rules-Deletion Rule ID
Management Console Upgrade The upgrade file used
Sensor upgrade retry Sensor ID
Uploaded TI package No additional information recorded.

Tip

You may also want to export your audit logs to send them to the support team for extra troubleshooting. For more information, see Export logs from the on-premises management console for troubleshooting.

Next steps

For more information, see: