Note
Access to this page requires authorization. You can try signing in or changing directories.
Access to this page requires authorization. You can try changing directories.
Azure DevOps Services | Azure DevOps Server 2022 - Azure DevOps Server 2019
Automated tests can be configured to run as part of a build or release for various languages. Test reports provide an effective and consistent way to view the tests results executed using different test frameworks, in order to measure pipeline quality, review traceability, troubleshoot failures, and drive failure ownership. In addition, it provides many advanced reporting capabilities explored in the following sections.
You can also perform deeper analysis of test results by using the Analytics Service. For an example of using this with your build and deploy pipelines, see Analyze test results.
Read the glossary to understand test report terminology.
Published test results can be viewed in the Tests tab in a build or release summary.
Surface test results in the Tests tab
Test results can be surfaced in the Tests tab using one of the following options:
Automatically inferred test results. By default, your pipeline can automatically infer the test output for a few popular test runners. Parse the error logs generated during the build operation and then check for signatures of test failures. Currently, Azure DevOps supports the following languages and test runners for automatically inferring the test results:
JavaScript - Mocha, Jest, and Jasmine
Python- Unittest
Note
This inferred test report is a limited experience. Some features available in fully-formed test reports are not present here (more details). We recommend that you publish a fully-formed test report to get the full Test and Insights experience in Pipelines. Also see:
Publishing fully formed test reports for JavaScript test runners
Publishing fully formed test reports for Python test runners
Test execution tasks. Built-in test execution tasks, such as Visual Studio Test that automatically publish test results to the pipeline, or others such as Ant, Maven, Gulp, Grunt, and Xcode that provide this capability as an option within the task.
Publish Test Results task. Task that publishes test results to Azure Pipelines or TFS when tests are executed using your choice of runner, and results are available in any of the supported test result formats.
API(s). Test results published directly by using the Test Management API(s).
Surface test information beyond the Tests tab
The Tests tab provides a detailed summary of the test execution. This is helpful in tracking the quality of the pipeline, and for troubleshooting failures. Azure DevOps also provides other ways to surface the test information:
The Dashboard provides visibility of your team's progress. Add one or more widgets that surface test related information:
Test analytics provides rich insights into test results measured over a period of time. It can help identify problematic areas in your test by providing data such as the top failing tests, and more.
View test results in build
The build summary provides a timeline view of the key steps executed in the build. If tests were executed and reported as part of the build, a test milestone appears in the timeline view. The test milestone provides a summary of the test results as a measure of pass percentage along with indicators for failures and aborts if these exist.
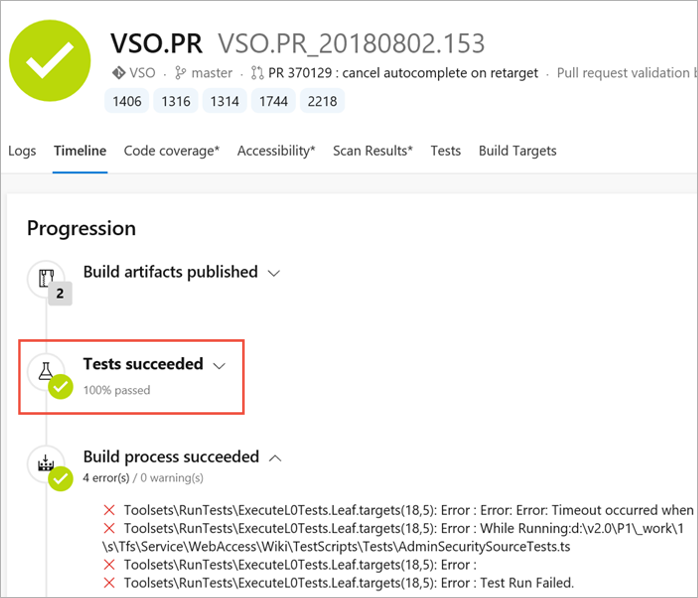
View test results in release
In the pipeline view, you can see all the stages and associated tests. The view provides a summary of the test results as a measure of pass percentage along with indicators for failures and aborts if these exist. These indicators are same as in the build timeline view, giving a consistent experience across build and release.
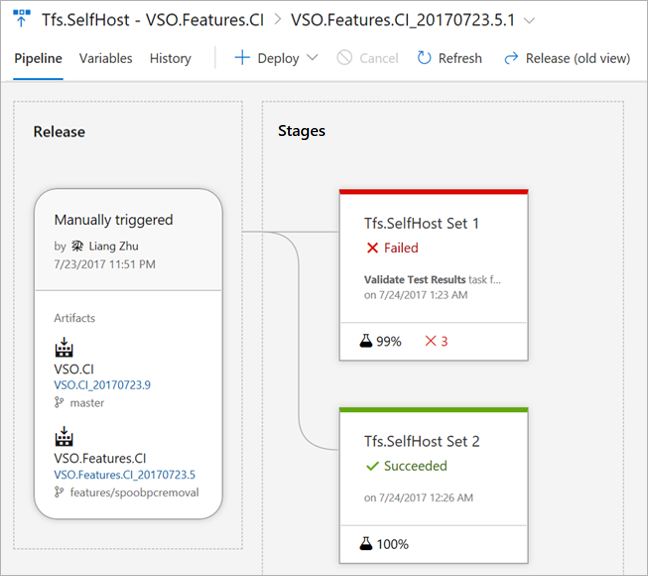
Tests tab
Both the build and release summaries provide details of test execution. Choose Test summary to view the details in the Tests tab. This page has the following sections
Summary: provides key quantitative metrics for the test execution such as the total test count, failed tests, pass percentage, and more. It also provides differential indicators of change compared to the previous execution.
Results: lists all tests executed and reported as part of the current build or release. The default view shows only the failed and aborted tests in order to focus on tests that require attention. However, you can choose other outcomes using the filters provided.
Details: A list of tests that you can sort, group, search, and filter to find the test results you need.
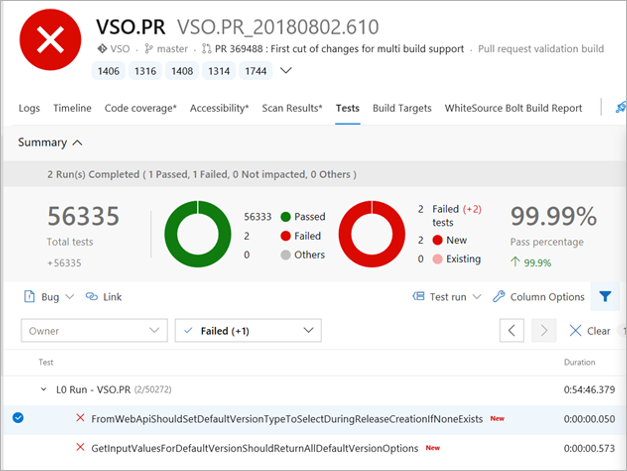
Select any test run or result to view the details pane that displays additional information required for troubleshooting such as the error message, stack trace, attachments, work items, historical trend, and more.
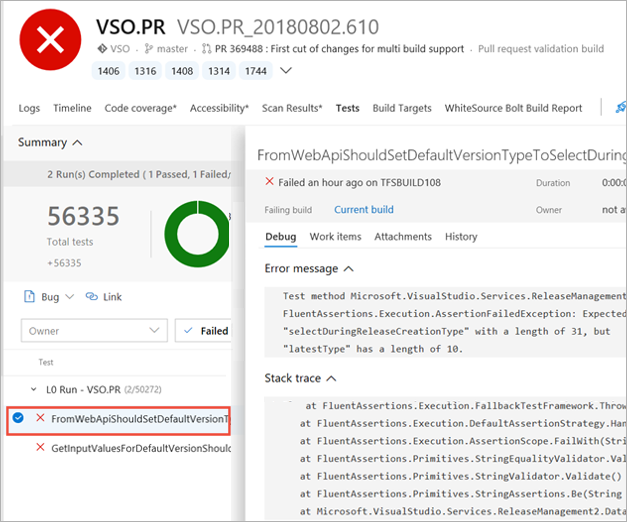
Tip
If you use the Visual Studio Test task to run tests, diagnostic output logged from tests (using any of Console.WriteLine, Trace.WriteLine or TestContext.WriteLine methods), will appear as an attachment for a failed test.
The following capabilities of the Tests tab help to improve productivity and troubleshooting experience.
Filter large test results
Over time, tests accrue and, for large applications, can easily grow to tens of thousands of tests. For these applications with many tests, it can be hard to navigate through the results to identify test failures, associate root causes, or get ownership of issues. Filters make it easy to quickly navigate to the test results of your interest. You can filter on Test Name, Outcome (failed, passed, and more), Test Files (files holding tests) and Owner (for test files). All of the filter criteria are cumulative in nature.
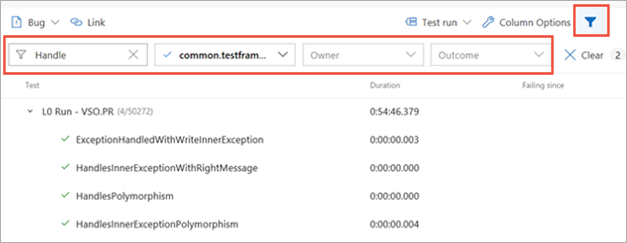
Additionally, with multiple Grouping options such as Test run, Test file, Priority, Requirement, and more, you can organize the Results view exactly as you require.
Test debt management with bugs
To manage your test debt for failing or long running tests, you can create a bug or add data to existing bug and all view all associated work items in the work item tab.
Immersive troubleshooting experience
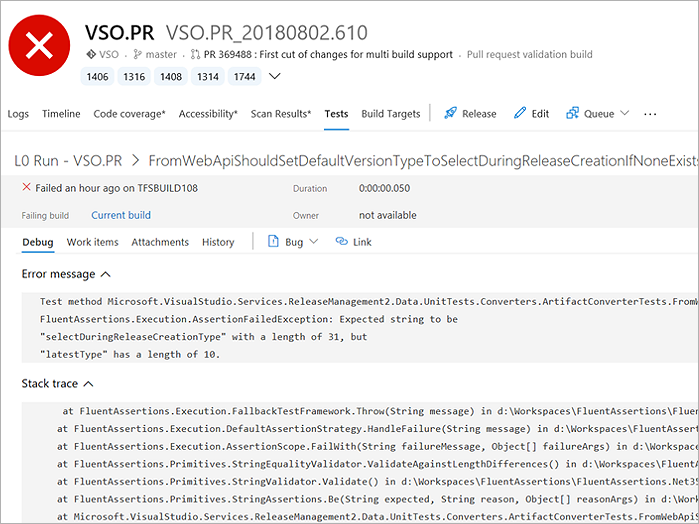
Error messages and stack traces are lengthy in nature and need enough real estate to view the details during troubleshooting. To provide an immersive troubleshooting experience, the Details view can be expanded to full page view while still being able to perform the required operations in context, such as bug creation or requirement association for the selected test result.
Troubleshooting data for Test failure
For the test failures, the error messages and stack traces are available for troubleshooting. You can also view all attachments associated with the test failure in the Attachments tab.
Test debt management
You can create or add to an existing bug to manage test debt for failures or long running tests. The Work Items tab details all bugs and requirements associated with a Test to help you analyze the requirement impact as well know status and who is working on the bug.
Test trends with historical data
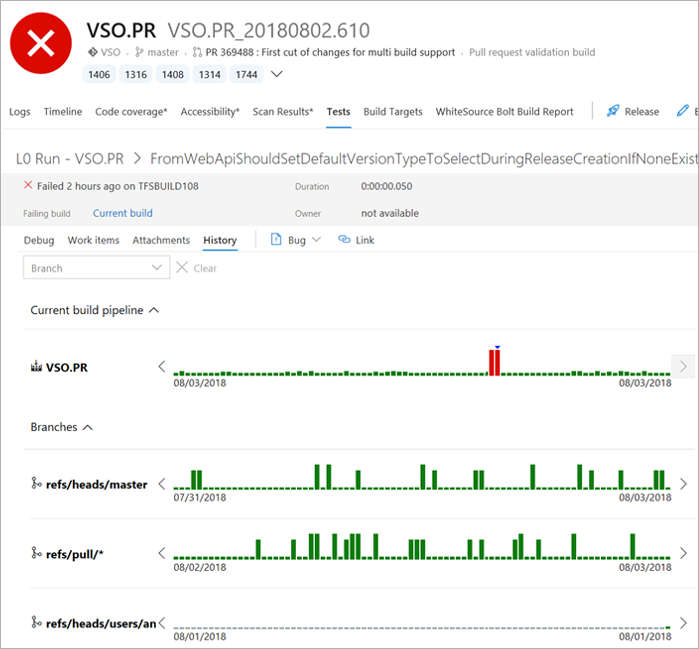
History of test execution can provide meaningful insights into reliability or performance of tests. When troubleshooting a failure, it's valuable to know how a test has performed in the past. The Tests tab provides test history in context with the test results. The test history information is exposed in a progressive manner, starting with the current build pipeline to other branches, or the current stage to other stages, for build and release respectively.
View execution of in-progress tests
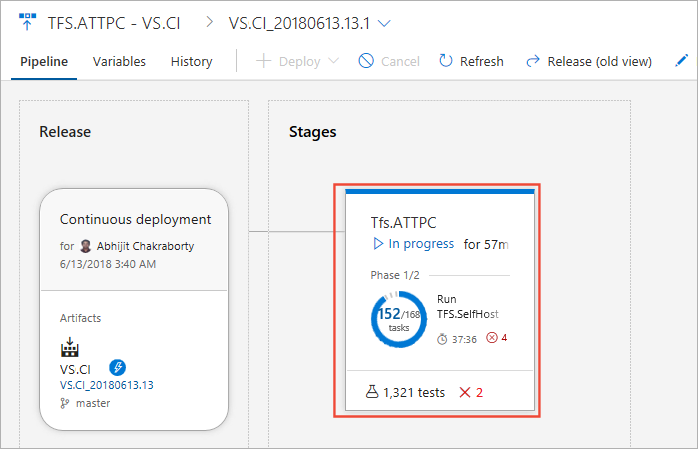
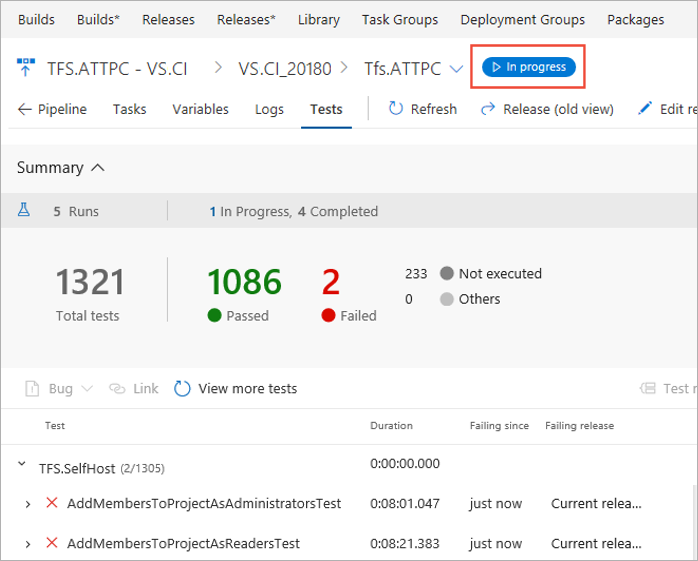
Tests, such as integration and functional tests, can run for a long time. Therefore, it's important to see the current or near real-time status of test execution at any given time. Even for cases where tests run quickly, it's useful to know the status of the relevant test results as early as possible; especially when failures occur. The in-progress view eliminates the need to wait for test execution to finish. Results are available in near real-time as execution progresses, helping you to take actions faster. You can debug a failure, file a bug, or abort the pipeline.
Note
The feature is currently available for both build and release, using Visual Studio Test task in a Multi Agent job. It will be available for Single Agent jobs in a future release.
The following example shows the in-progress test summary in a release, reporting the total test count and the number of test failures at a given point in time. The test failures are available for troubleshooting, creating bugs, or to take any other appropriate action.
View summarized test results
During test execution, a test might spawn multiple instances or tests that contribute to the overall outcome. Some examples are, tests that are rerun, tests composed of an ordered combination of other tests (ordered tests) or tests having different instances based on an input parameter (data driven tests).
As these tests are related, they must be reported together with the overall outcome derived from the individual instances or tests. These test results are reported as a summarized test result in the Tests tab:
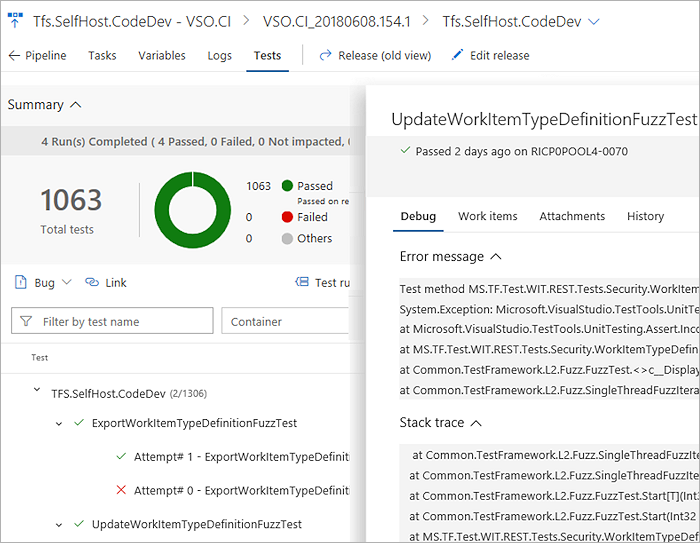
Rerun failed tests: The ability to rerun failed tests is available in the latest version of the Visual Studio Test task. During a rerun, multiple attempts can be made for a failed test, and each failure could have a different root cause due to the nondeterministic behavior of the test. Test reports provide a combined view for all the attempts of a rerun, along with the overall test outcome as a summarized unit. The Test Management APIs now support the ability to publish and query summarized test results.
Data driven tests: Similar to the rerun of failed tests, all iterations of data driven tests are reported under that test in a summarized view. The summarized view is also available for ordered tests (
.orderedtestin Visual Studio).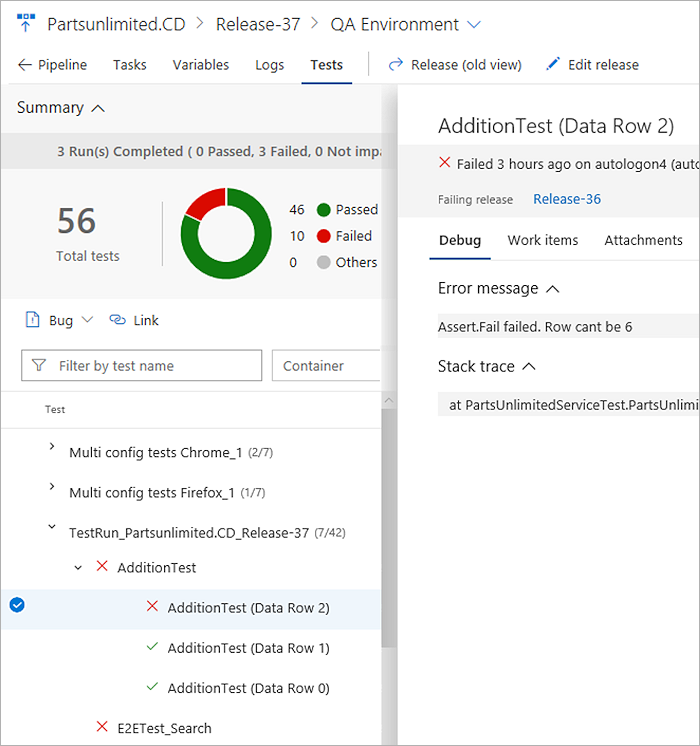
Note
Metrics in the test summary section, such as the total number of tests, passed, failed, or other are computed using the root level of the summarized test result.
View aborted tests
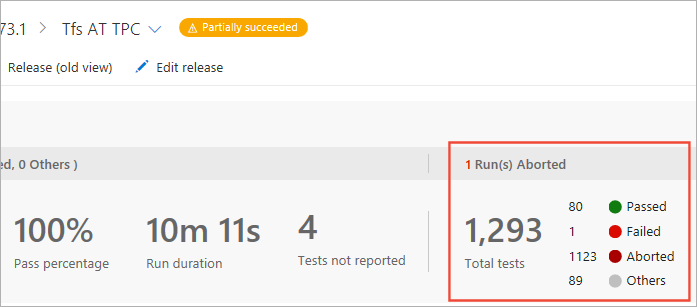
Test execution can abort due to several reasons such as bad test code, errors in the source under test, or environmental issues. Irrespective of the reason for the abort, it's important to be able to diagnose the behavior and identify the root cause. The aborted tests and test runs can be viewed alongside the completed runs in the Tests tab.
Note
The feature is currently available for both build and release, using the Visual Studio Test task in a Multi Agent job or publishing test results using the Test Management API(s). It will be available for Single Agent jobs in a future release.
Automatically inferred test results
Azure DevOps can automatically infer the output of tests that are running in your pipelines for a few supported test frameworks. These automatically inferred test reports require no specific configuration of your pipelines, and are a zero-effort way to get started using Test Reporting.
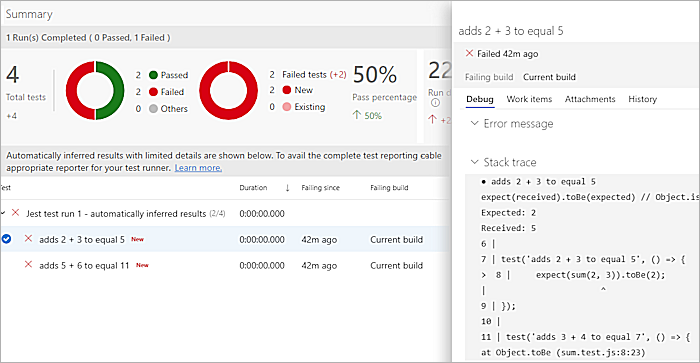
See the list of runners for which test results are automatically inferred.
As only limited test metadata is present in such inferred reports, they're limited in features and capabilities. The following features aren't available for inferred test reports:
- Group the test results by test file, owner, priority, and other fields
- Search and filter the test results
- Check details of passed tests
- Preview any attachments generated during the tests within the web UI itself
- Associate a test failure with a new bug, or see list of associated work items for this failure
- See build-on-build analytics for testing in Pipelines
Note
Some runners such as Mocha have multiple built-in console reporters such as dot-matrix and progress-bar. If you have configured a non-default console output for your test runner, or you are using a custom reporter, Azure DevOps will not be able to infer the test results. It can only infer the results from the default reporter.
Related articles
Help and support
- See our troubleshooting page
- Get advice on Stack Overflow, and get support via the Developer Community