Events
Mar 17, 9 PM - Mar 21, 10 AM
Join the meetup series to build scalable AI solutions based on real-world use cases with fellow developers and experts.
Register nowThis browser is no longer supported.
Upgrade to Microsoft Edge to take advantage of the latest features, security updates, and technical support.
Azure DevOps Services | Azure DevOps Server 2022 - Azure DevOps Server 2019
Tracking test quality over time and improving test collateral is key to maintaining a healthy DevOps pipeline. Test analytics provides near real-time visibility into your test data for builds and releases. It helps improve the efficiency of your pipeline by identifying repetitive, high impact quality issues.
Note
Test analytics is currently available only with Azure Pipelines.
Read the glossary to understand test reports terminology.
For more information, see The Analytics Marketplace extension.
To help teams find and fix tests that fail frequently or intermittently, use the top failing tests report. The build summary includes the Analytics page that hosts this report. The top-level view provides a summary of the test pass rate and results for the selected build pipeline, for the specified period. The default range is 14 days.

For tests executing as part of release, access test analytics from the Analytics link at the top right corner. As with build, the summary provides an aggregated view of the test pass rate and results for the specified period.
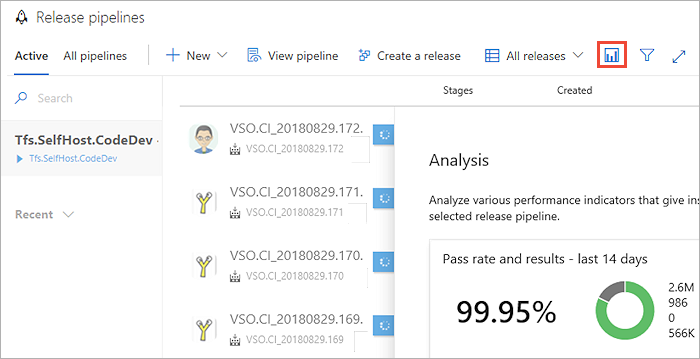
Open a build or release summary to view the top failing tests report. This report provides a granular view of the top failing tests in the pipeline, along with the failure details.
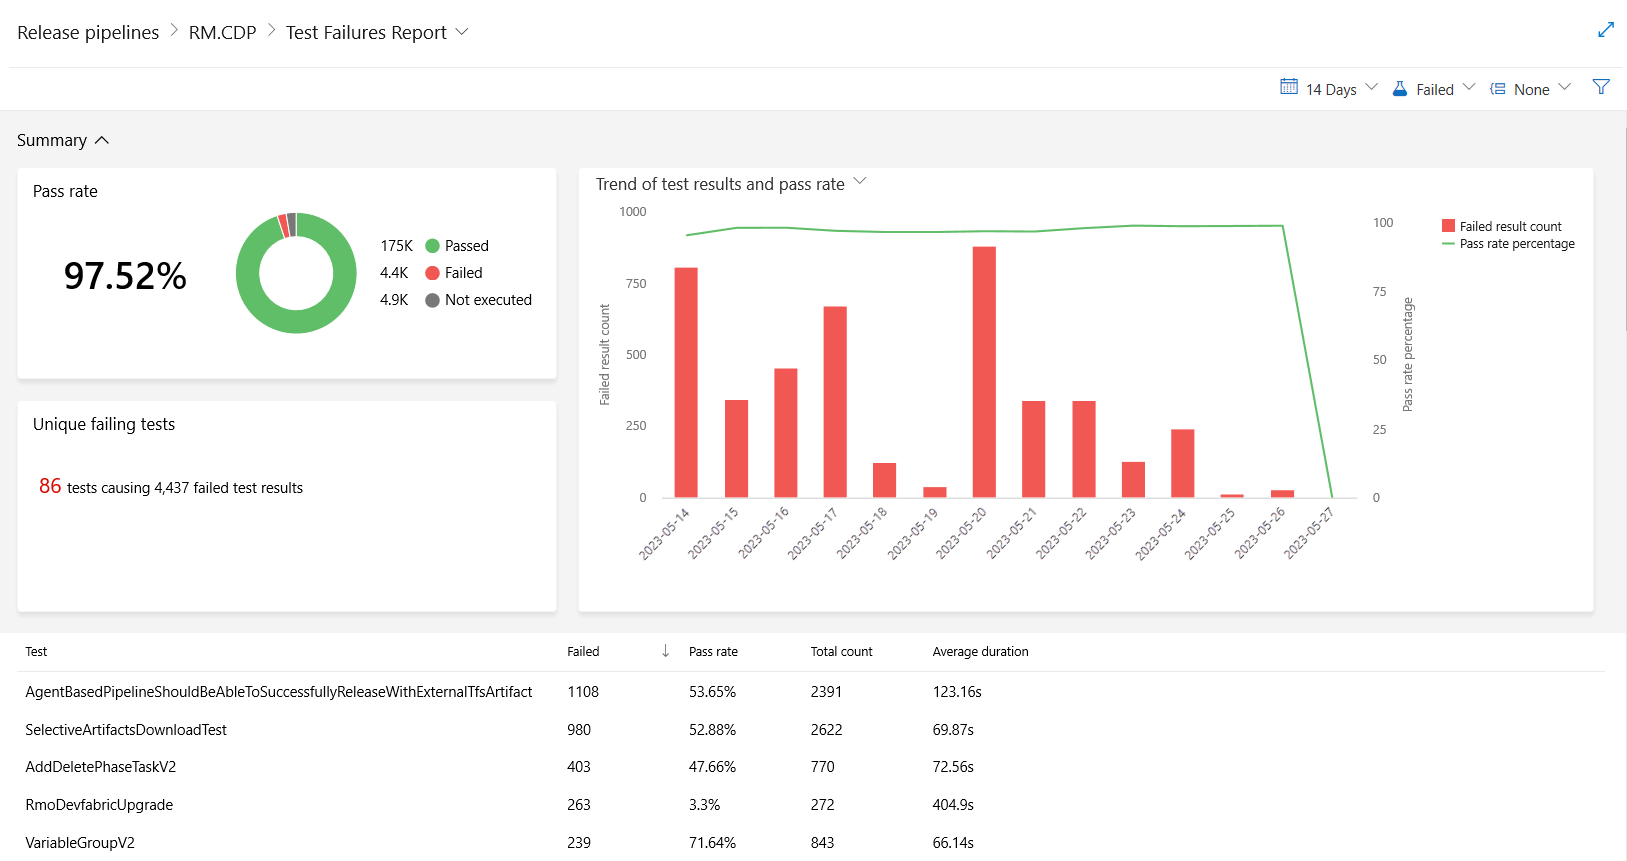
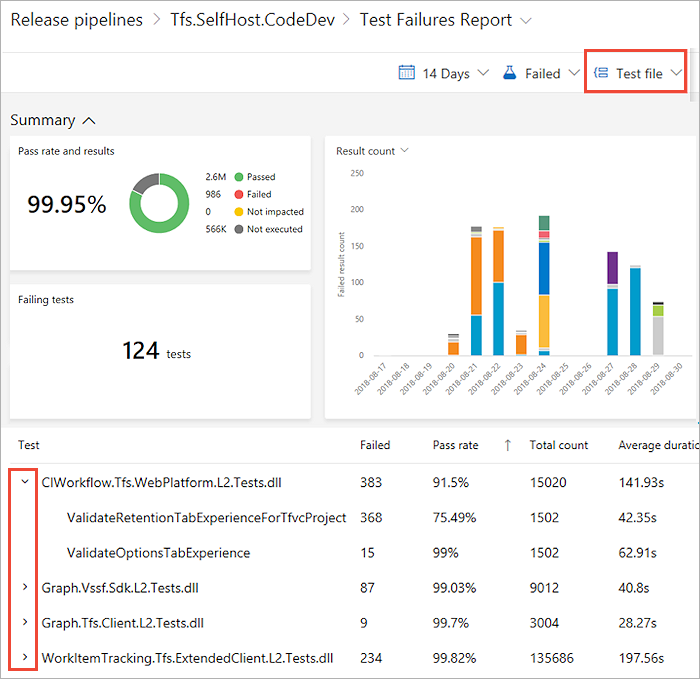
The detailed view contains two sections:
Summary: Provides key quantitative metrics for the tests executed in build or release over the specified period. The default view shows data for 14 days.
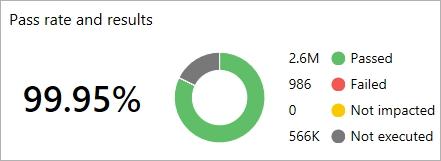
Pass rate and results: Shows the pass percentage, along with the distribution of tests across various outcomes.
Failing tests: Provides a distinct count of tests that failed during the specified period. In the previous example, 986 test failures originated from 124 tests.
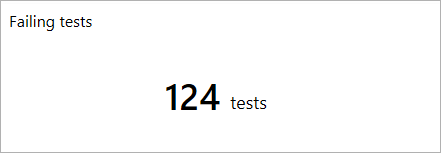
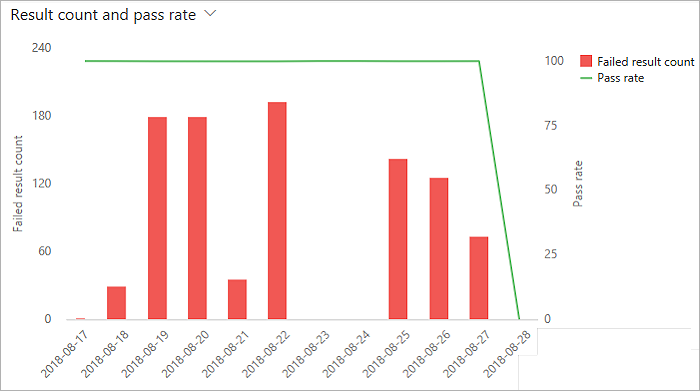
Chart view: A trend of the total test failures and average pass rate on each day of the specified period.
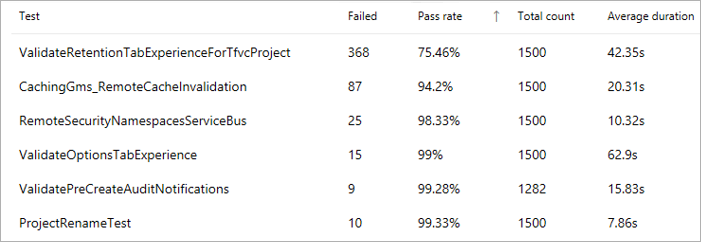
Results: List of top failed tests based on the total number of failures. Helps to identify problematic tests and lets you drill into a detailed summary of results.
The report view can be organized in several different ways using the group by option. Grouping test results can provide deep insights into various aspects of the top failing tests. In the following example, the test results are grouped based on the test files they belong to. It shows the test files and their respective contribution towards the total of test failures, during the specified period to help you easily identify and prioritize your next steps. Additionally, for each test file, it shows the tests that contribute to these failures.
After you identify one or more tests in the Details section, select the individual test you want to analyze. This action provides a drill-down view of the selected test with a stacked chart of various outcomes such as passed or failed instances of the test, for each day in the specified period. This view helps you infer hidden patterns and take actions accordingly.
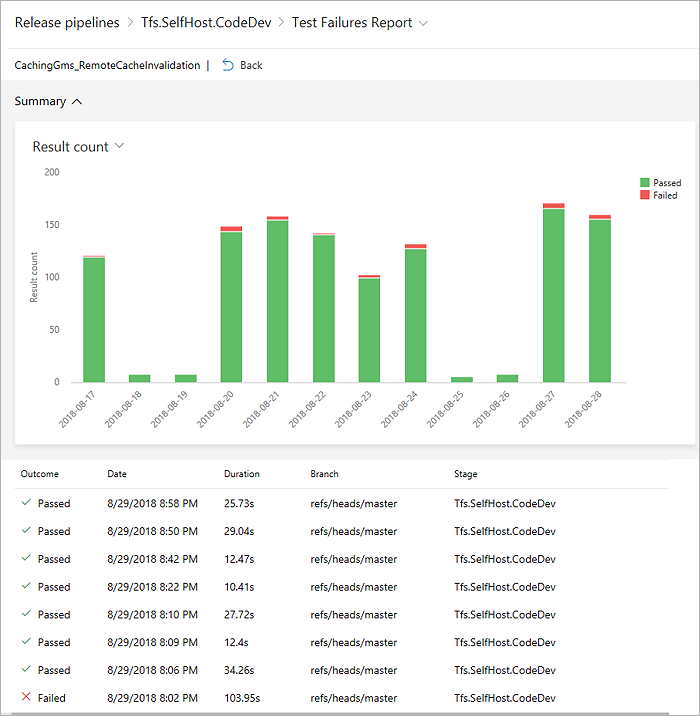
The corresponding grid view lists all instances of execution of the selected test during that period.
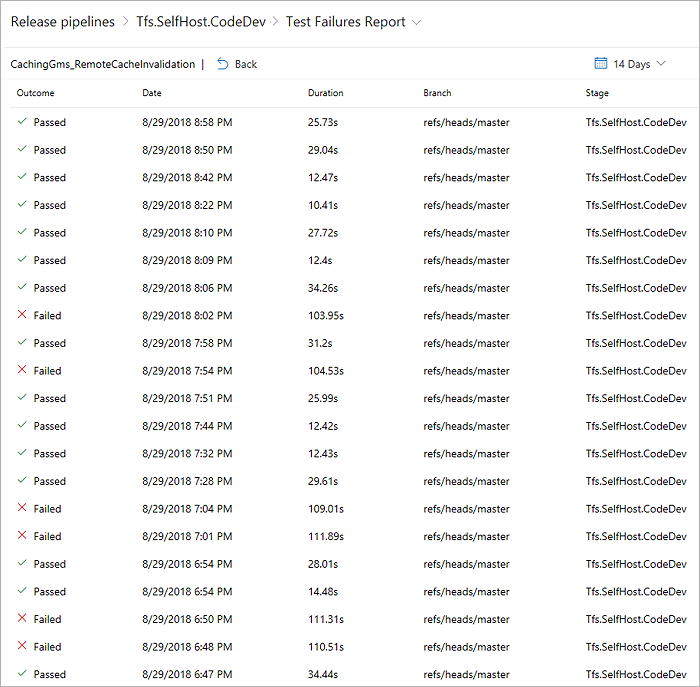
To perform failure analysis for root causes, choose one or more instances of test execution in the drill-down view to see failure details in context.
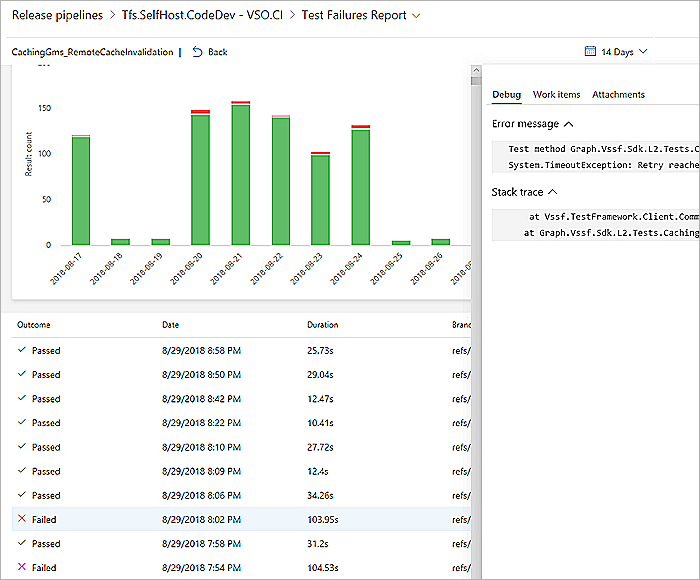
When looking at the test failures for a single instance of execution, it's often difficult to infer any pattern. In the following example, the test failures occurred during a specific period, which helps narrow down the scope of investigation.
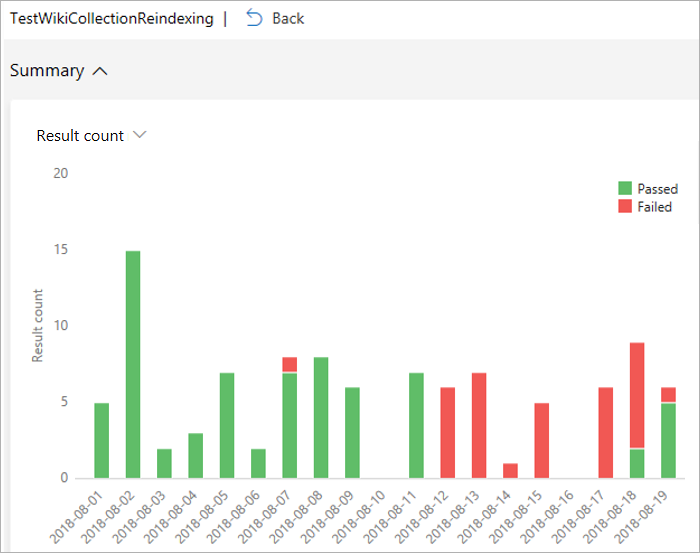
Another example is tests that exhibit nondeterministic behavior (often referred to as flaky tests). Looking at an individual instance of test execution might not provide any meaningful insights into the behavior. However, observing test execution trends for a period can help infer hidden patterns, and help you resolve the failures.
The source of information for test analytics is the set of published test results for the build or release pipeline. These results are accrued over a period of time, and form the basis of the rich insights that test analytics provides.
Events
Mar 17, 9 PM - Mar 21, 10 AM
Join the meetup series to build scalable AI solutions based on real-world use cases with fellow developers and experts.
Register nowTraining
Module
Run quality tests in your build pipeline by using Azure Pipelines - Training
Find out about automated testing that proves your code to be maintainable, understandable, and functioning without repetitive manual testing.
Certification
Microsoft Certified: Fabric Analytics Engineer Associate - Certifications
As a Fabric analytics engineer associate, you should have subject matter expertise in designing, creating, and deploying enterprise-scale data analytics solutions.
Documentation
Configure the Test Results Trend (Advanced) widget - Azure DevOps
Learn how to monitor test trends and gain insights about pipeline test efforts using Analytics Test Results Trend (Advanced) widget in Azure DevOps.
Requirements traceability - Azure Pipelines
Link requirements, tests, and bugs to enable requirements traceability
Use Test Impact Analysis - Azure Pipelines
Speed up testing by using Test Impact Analysis (TIA) in Azure Pipelines or TFS with a build or release pipeline.