Configure and monitor sprint burndown
Azure DevOps Services | Azure DevOps Server 2022 - Azure DevOps Server 2019
Throughout your sprint, you can monitor the sprint burndown report to determine if your team is on track to complete its sprint plan. There are two sprint accessible burndown charts: the in-context Burndown Trend report viewable from a team sprint backlog and the Sprint Burndown widget you can add to a dashboard.
Both the report and the widget derive data from Analytics. They support monitoring burndown based on a count of work items or a sum of Story Points/Size/Effort, Remaining Work, or other numeric field.
You can add either the report or widget to a dashboard. Also, you can monitor progress using the Analytics-based burndown or burnup widgets. They provide more configuration options.
Throughout your sprint, you can monitor the sprint burndown report to determine if your team is on track to complete its sprint plan. The in-context sprint burndown report supports tracking burndown based on Remaining Work assigned to sprint tasks. If you don't track tasks or Remaining Work, then you can use the Analytics-based burndown and burnup widgets. They provide more configuration options.
Important
Deleting Area Paths or reconfiguring Iteration Paths can cause a loss of data and can't be reverted. For example, burndown or burnup widget charts, sprint burndown, and velocity charts for teams whose Area Paths are changed won't reflect correct data. Historical trend charts reference the Area Path and Iteration Path as defined at a point in the past for each work item. When an Area Path or Iteration Path is deleted, then the historical data for it can't be retrieved.
Use this article to learn about:
- Metrics tracked in the sprint burndown report and widget
- Team activities required to track tasks and Remaining Work
- How to set interactive controls to personalize your view of the sprint burndown report
- How to add the in-context Burndown Trend report to a dashboard
- How to configure the Sprint Burndown widgets
- How to view current and past sprint burndowns
For an overview of all burndown/burnup charts available to you, see Burndown and burnup guidance.
- Metrics tracked in the sprint burndown report and widget
- Team activities required to track tasks and Remaining Work
- How to configure the Sprint Burndown widget
- How to view current and past sprint burndowns
Note
Sprint burndown reports are derived from data tracked by a team during a sprint or iteration. For more information, see About teams and Agile tools.
The in-context Burndown Trend report
The Burndown Trend report is based on either a count of tasks or remaining work estimates, or other numeric fields that you define and update throughout the sprint cycle. For details, see Sprint planning. To open this report, jump to the section Open a Sprint backlog.
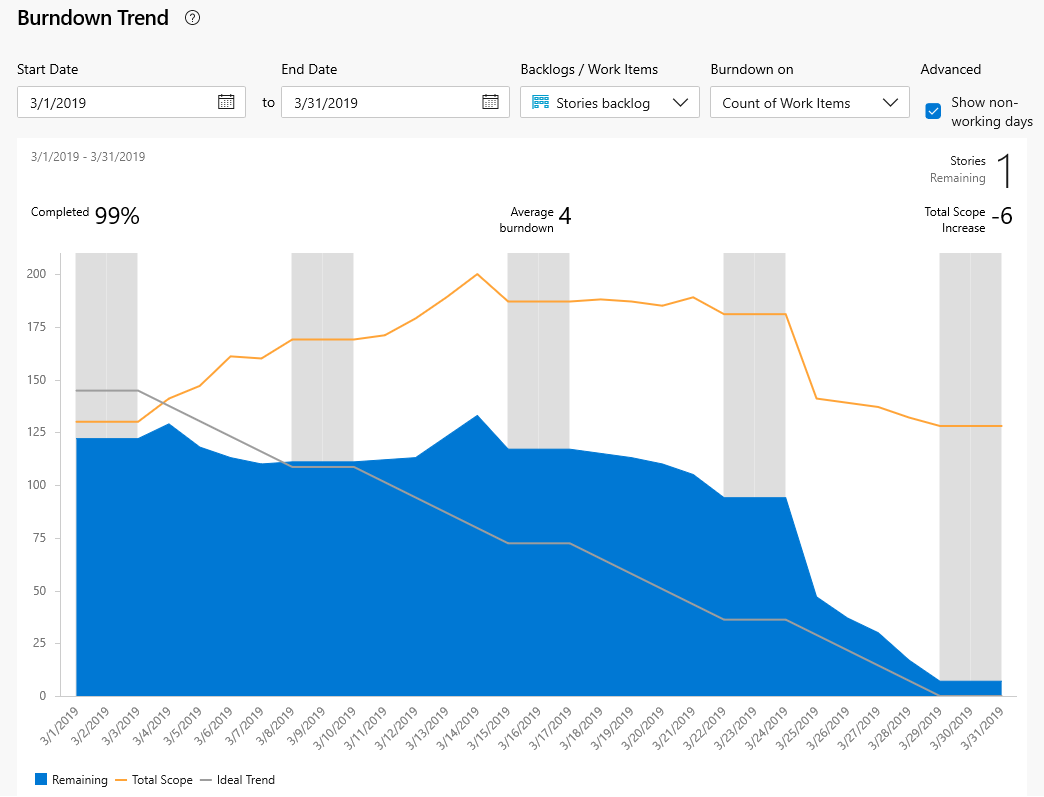
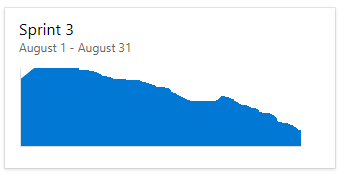
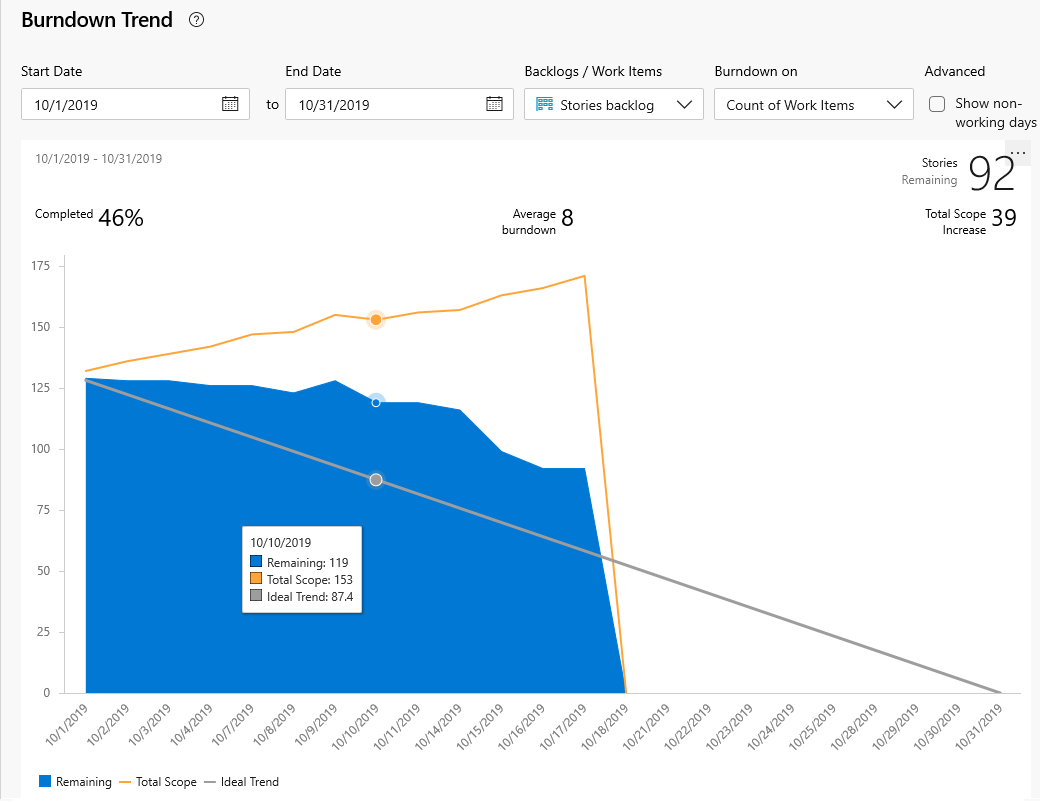
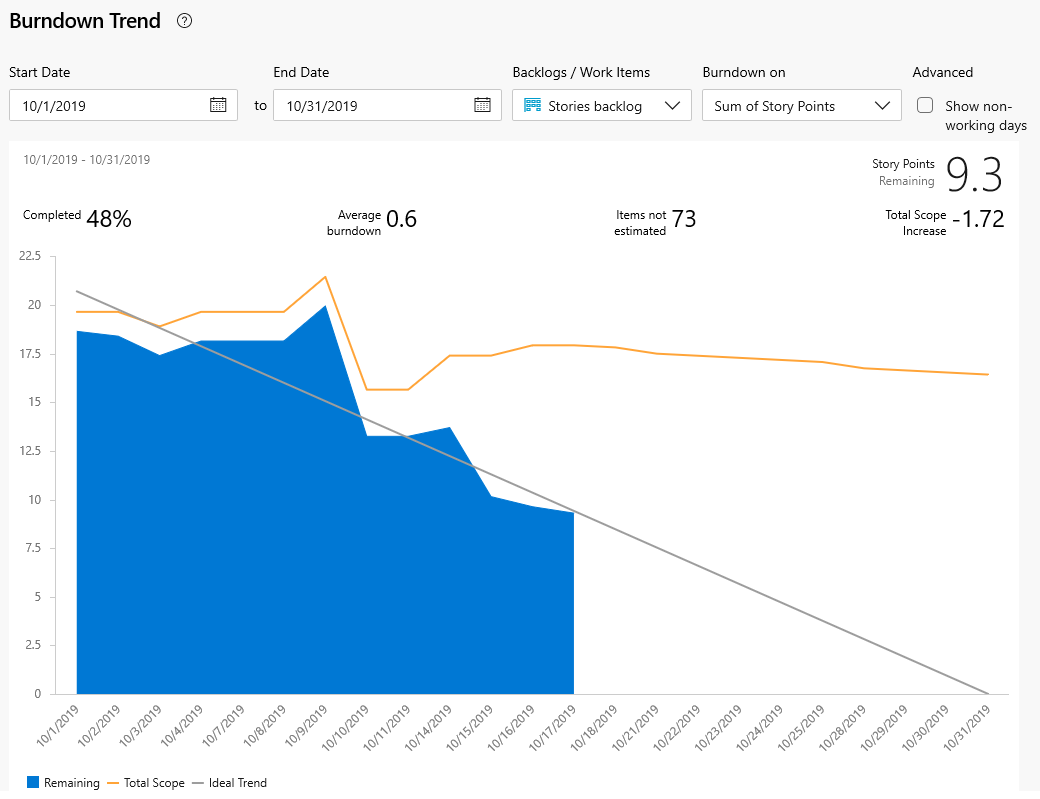
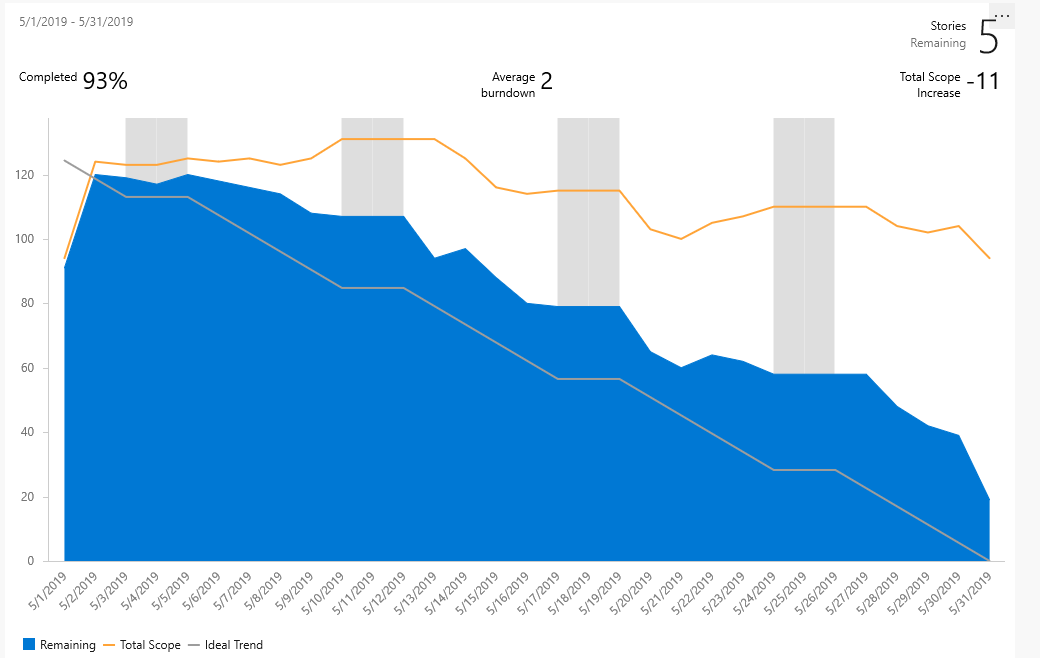
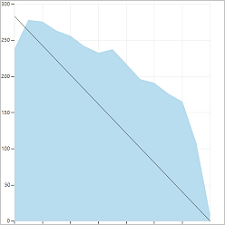
A healthy sprint burndown report looks something like the image shown below. Typically, there will be a stair-case burndown as individual team members may only update their work items once a week or every few days. The Total Scope line indicates the number of work items added after the sprint starts. The Ideal Trend line is calculated based on the number of work items, days in the sprint, and number of working days.
The blue area indicates the number of work items active or in progress each day of the sprint. As shown in this example, one work item is still active at the end of the sprint.
Note
The Total Scope line reflects the number of work items added to the sprint. If the team's default iteration is the @CurrentIteration, then new work items are added to the current iteration. The scope decreases as the Iteration Path is modified to another sprint, or work items are completed.
The in-context sprint burndown report is based on the tasks and Remaining Work estimates you define and update throughout the sprint cycle. For details, see Sprint planning and taskboard. To open the sprint burndown chart, jump to the section Open sprint burndown chart.
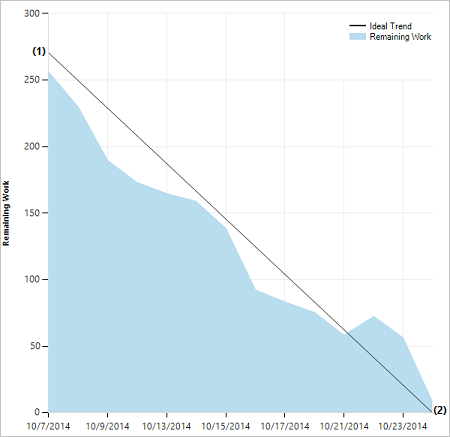
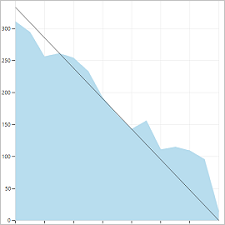
A healthy sprint burndown chart will look something like this. The Ideal Trend line connects the two points:
- (1) Team's total capacity at the start of the sprint.
- (2) 0 Remaining Work at the end of the sprint.
The slope represents the rate at which the team needs to burn down work to finish the sprint on time.
The actual graph, the blue area, represents the total amount of planned sprint work and how it changes throughout the course of the sprint. The blue area corresponds to the sum of all Remaining Work set for all sprint tasks, and possibly bugs, that have the current sprint as their iteration path.
The Sprint Burndown widget
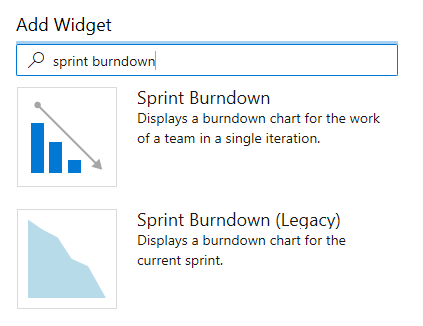
In the widget catalog, you'll find two versions of the Sprint Burndown widget: the Analytics-based Sprint Burndown and Sprint Burndown (Legacy) which is built from the work tracking data store.
Sprint Burndown widget
The Analytics-based Sprint Burndown widget provides an easy way to monitor progress for a team by showing work remaining for a given sprint. Work remaining is the vertical axis and time is the horizontal axis. You can define remaining work based on Stories or Tasks, and by counting the work items or summing a field.
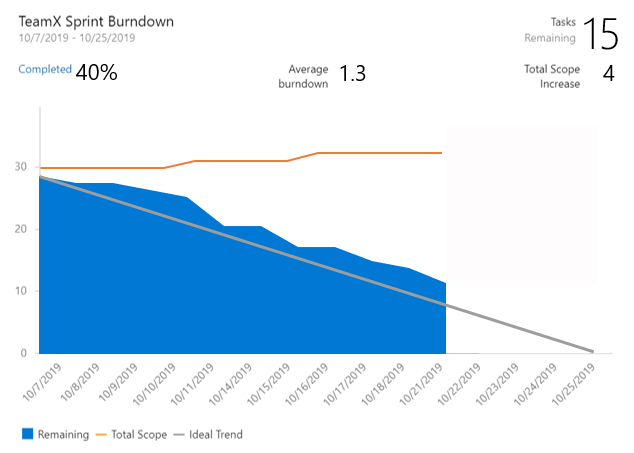
The charts provide useful metrics to help you answer the question: Are we on track to complete this set of work by the end a sprint?
- Percentage work complete
- Number of work items not estimated (if using a field other than Remaining Work)
- Average burndown
- Total scope increase
Sprint Burndown (Legacy) widget
The Sprint Burndown (Legacy) widget adds a chart based on Remaining Work defined for tasks in a team's current sprint. Select this version when you don't have access to Analytics. Configuration options include team selection, and widget size.
If your dashboard already has a legacy version available, you can easily upgrade the widget by editing the widget's configuration, and checking Try the new version now. You can always go back to the legacy version by unchecking the box.
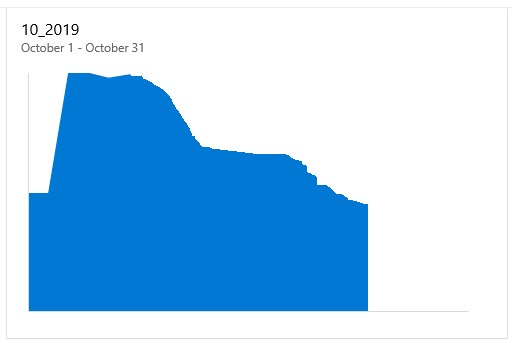
The Sprint Burndown widget adds a chart based on Remaining Work defined for tasks in the team's current sprint. There are no configuration options for this widget.
Prerequisites
- You must be a member of a project. Get added to a project or create one.
- To add a widget to a team dashboard, you need to be a member of the team. You must have Basic access or greater, have dashboard permissions, or be a team admin or project admin.
- Boards must be enabled. If disabled, none of the work tracking Analytics widgets display. To re-enable it, see Turn an Azure DevOps service on or off.
- You must be a member of a project. Get added to a project or create one.
- Enable or install Analytics. You must be an account owner or a member of the Project Collection Administrators group to add extensions or enable the service.
- To add a widget to a team dashboard, you need to be a member of the team. You must have Basic access or greater, have dashboard permissions, or be a team admin or project admin. Default settings provide all team members with permissions.
- Boards must be enabled. If disabled, none of the work tracking Analytics widgets display. To re-enable it, see Turn an Azure DevOps service on or off.
Team activities to track tasks and Remaining Work
To monitor sprint burndown, your team must schedule sprints and assign work to those sprints.
If you want to monitor sprint burndown based on tasks and Remaining Work, your team must carry out these extra actions.
To monitor sprint burndown, your team must schedule sprints and assign work to those sprints. For sprint burndown charts to show meaningful data, your team must carry out these extra actions.
Required activities:
- Define and estimate tasks for each product backlog item you're working on in the sprint. If you work from your team's backlog and taskboard, the items you create will automatically be assigned to the current sprint (Iteration) and to your team's default Area Path.
- Update Remaining Work for each sprint task as work progresses.
Recommended activities:
- Define tasks that take a day or less to complete to lessen the effect of poor estimates.
- Don't divide tasks into subtasks. If you divide a task into subtasks, specify hours only for the subtasks. These hours are rolled up as summary values for the parent task.
- Update Remaining Work daily or several times within a week to support monitoring and achieve a smoother burndown chart.
- At the end of the sprint, update the task status of completed tasks and determine how to handle incomplete tasks.
Empty sprint burndown chart
If your sprint burndown chart appears empty, check these points:
- Have you assigned tasks to the sprint associated with the chart?
- Have you assigned Remaining Work to the tasks assigned to the sprint?
- Are the parent work items of the tasks assigned to the same sprint? If not, the tasks may appear in another sprint associated with the parent item.
Open a Sprint backlog
You view the in-context sprint burndown report from a team's Sprint backlog.
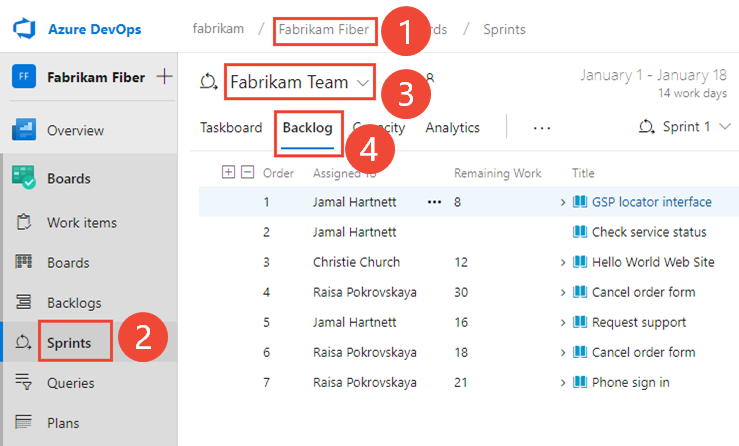
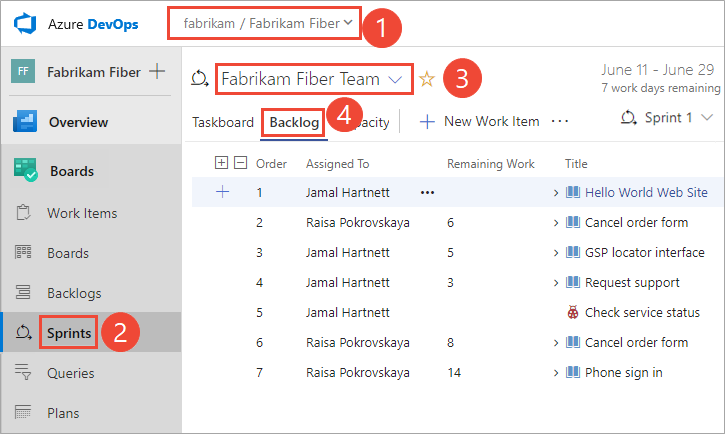
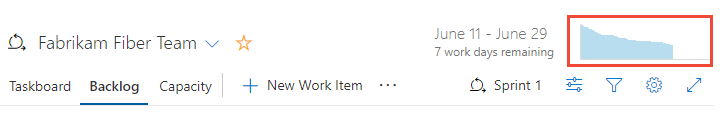
From your web portal, open your team's sprint backlog. (1) Check that you've selected the right project, (2) select Boards>Sprints, (3) select the correct team from the team selector menu, and lastly (4), select Backlog.
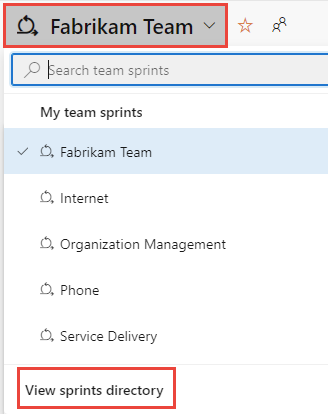
To select another team, open the selector and select a different team or select the View Sprint directory option. Or, you can enter a keyword in the search box to filter the list of team backlogs for the project.
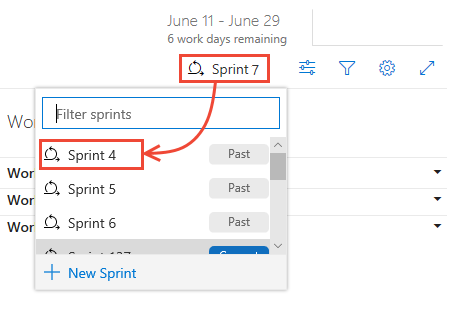
To select a different sprint than the one shown, open the sprint selector and select the sprint you want.
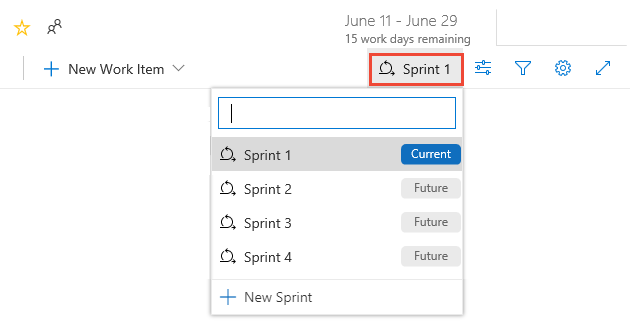
The system lists only those sprints that have been selected for the current team focus. If you don't see the sprints you want listed, then select New Sprint from the menu, and then select Select existing iteration. For details, see Define iteration paths.
From your web browser, open your team's sprint backlog. (1) Check that you've selected the right project, (2) select Boards>Sprints, (3) select the correct team from the team selector menu, and lastly (4), select Backlog.
To select another team, open the selector and select a different team or select the
 Browse all sprints option. Or, you can enter a keyword in the search box to filter the list of team backlogs for the project.
To select a different sprint than the one shown, open the sprint selector and select the sprint you want.
The system lists only those sprints that have been selected for the current team focus. If you don't see the sprints you want listed, then select New Sprint from the menu, and then select Select existing iteration. For details, see Define iteration paths.
View the in-context Burndown Trend report
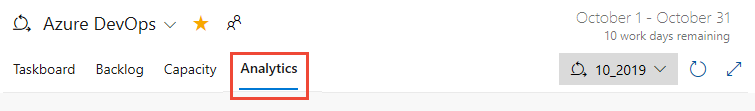
To open the Sprint burndown report, select Analytics.
Use the interactive controls to select from the following options:
- The Start Date and End Date of the sprint. These dates will default to the team's current iteration sprint dates.
- The Backlogs/Work Items to burn down on, either the product backlog—Stories, Issues, Product Backlog Items, or Requirements—or Tasks backlog to use. Your selection impacts the options available for the Burndown on menu.
- The Burndown on field to use to calculate burndown, either a Count of Work Items or a sum of a field, such as Story Points, Effort, or Size.
- Check or uncheck Show non-working days. Non-working days appear as gray bars in the background when enabled. Default non-working days are set for a team and for a team's sprint through the capacity page. For more information, see Set sprint capacity.
Select Reset to reset the controls to the default options. By default, the dates are set to the selected sprint. Changes to the start and end dates don't change any sprint date definitions.
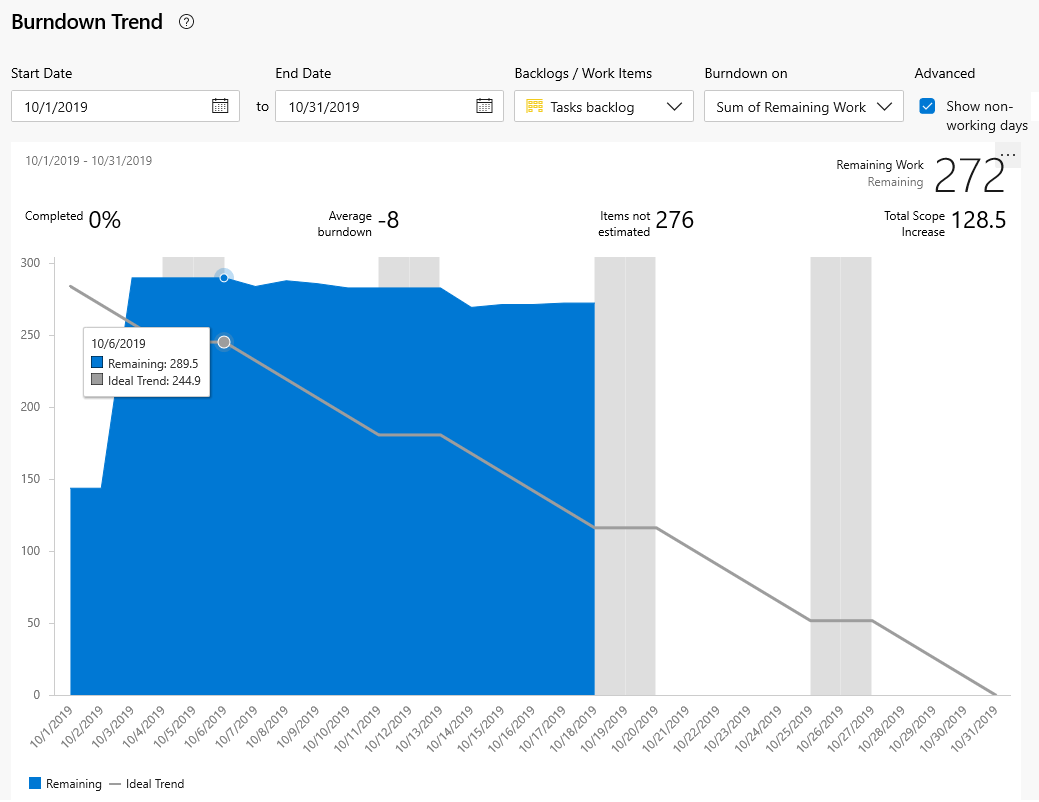
If you don't track Remaining Work in tasks, you can view burndown based on a count of work items/tasks. Hover over any point on the chart to show a summary of the data for a specific day.
When you choose to view the Tasks backlog and Sum of Remaining Work, the blue area shows the sum of Remaining Work per day for those tasks that are still active or in progress. As the Remaining Work is updated, the chart indicates the rate of burndown. The Scope trend line indicates the addition of Remaining Work after the start of the sprint. The Ideal trend line indicates the ideal burndown rate for the sprint. Capacity lines are only shown when the team has configured capacity.
Note
The options for the sum fields depend on the numeric fields defined for task and requirement category work item types. The most common fields used to show the burndown trend are:
- Count of work items
- Sum of Story Points, Effort, or Size
- Sum of Remaining Work.
The selections you make are only set for you, and persist across sessions until you change them.
Add the report to a dashboard
To add the report to a dashboard, select the
 actions icon and select Copy to Dashboard.
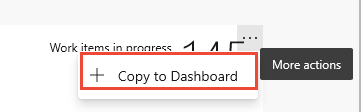
Select the dashboard and select OK.
Add the Sprint Burndown widget to a dashboard
You can add the Sprint Burndown widget to a dashboard and select the team whose progress you want to monitor. You configure these widgets for one or more teams.
If you haven't yet added the Sprint Burndown widget to your dashboard, do that now.
You can filter the Add widget dialog with "sprint burndown" to quickly locate the two widgets available to you.
To configure the widget, select the
actions icon and select the Configure option.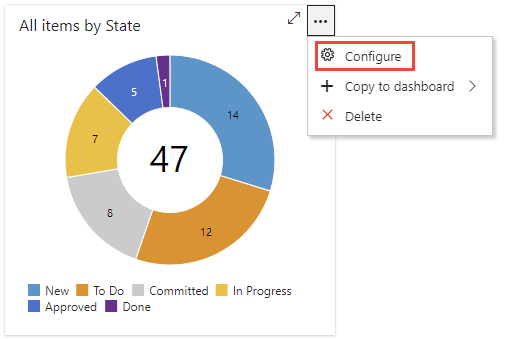
Select
 Edit to add the Sprint burndown widget to your team dashboard.
The widget catalog automatically opens. Drag the Sprint Burndown widget onto the dashboard.
When you're finished with your additions, select Done Editing.
The sprint burndown chart for the team's current sprint is added to the dashboard. There's no configuration option associated with this widget.
Configure the Analytics-based Sprint Burndown widget
To configure the widget, select the
actions icon and select the Configure option.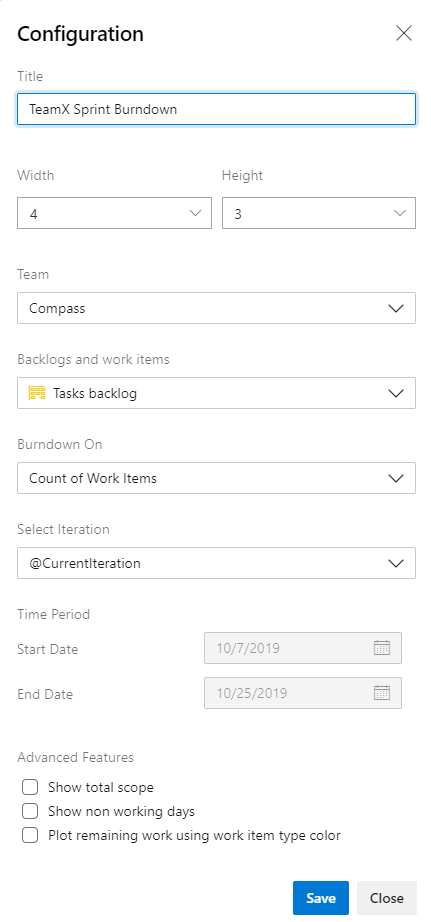
Modify the Title of the widget and select your preferred Size. The Sprint Burndown widget can scale up to 10x10.
Make the following selections:
- Team - Select the Team you want to track.
- Backlogs and work items - Select the work items to include in your burndown. You can select to any backlog or a specific work item type.
- Burndown on - Choose how you want to burndown. You may burndown by count of work items or a sum based on a selected field.
- Select iteration - You may select @CurrentIteration, or a specific iteration.
- Time period - If you selected @CurrentIteration, these dates aren't editable, as they'll be automatically to the start/end date of the current iteration. If you selected a specific iteration, you may customize the start/end date for the burndown chart.
Advanced features: Check the boxes of the following options that you want to add to your chart.
- Show total scope: Displays both the historical and projected scope increase.
- Show non working days: Displays non working days on the burndown. When displayed, non working days are shaded.
- Plot remaining using work item type color: Displays remaining work based on the work item type color, rather than the default blue color. If multiple work items are included, then it stacks colors by work item type.
Configure the Sprint Burndown (Legacy) widget
To configure the widget, select the ![]() actions icon and select the Configure option.
actions icon and select the Configure option.
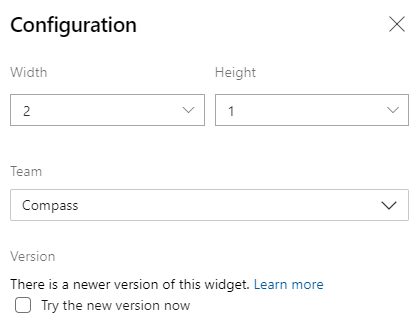
If your dashboard already has a legacy version available, you can easily upgrade the widget by editing the widget's configuration, and checking Try the new version now. You can always go back to the legacy version by unchecking the box.
Current and past sprint burndown charts
As you complete each sprint, the system maintains a history of your activity.
To view a past sprint and its burndown chart, select the sprint from the Sprint selector.
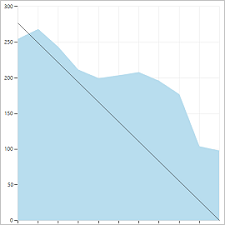
You can review sprint burndown in-context reports to show the team patterns in execution. The burndown charts maintain a record of the team's ability to plan and estimate.
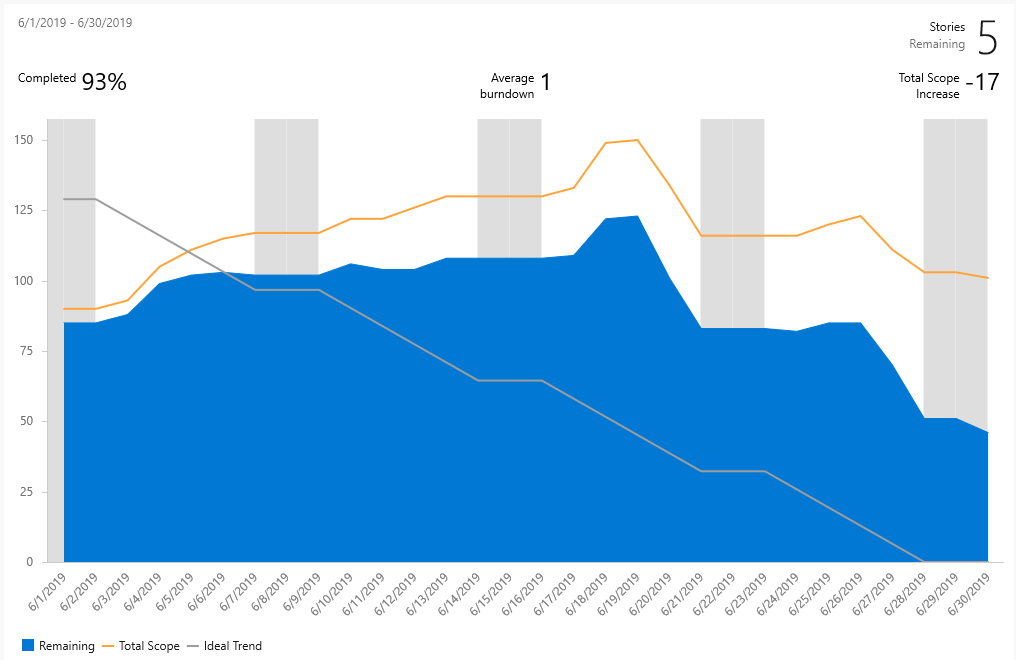
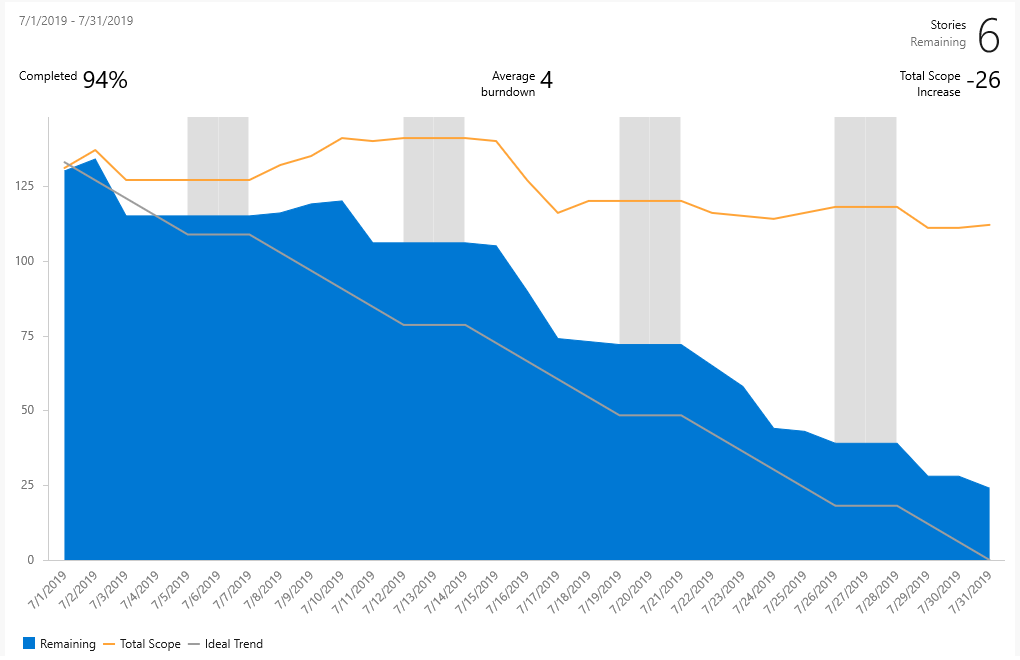
| Sprint 1 | Sprint 2 | Sprint 3 |
|---|---|---|
 |
 |
 |
Teams may find it useful to review these reports periodically during their sprint retrospectives. It may spark useful discussions and lead to setting one or more sprint goals, such as:
- How does our projected velocity match up to our actual velocity?
- How can we more accurately determine how much we can accomplish in a sprint?
- How can we complete work at a more regular pace throughout the sprint?
Next steps
Related articles
- Define iteration paths and configure team iterations
- Sprint planning
- Add tasks to backlog items
- Update and monitor your Taskboard
- Scrum and best practices
- Understand the Scrum Burndown Chart
For projects that use the on-premises XML process model, you can specify the format that appears—h for hours or d for days—for the remaining work field.
Feedback
Coming soon: Throughout 2024 we will be phasing out GitHub Issues as the feedback mechanism for content and replacing it with a new feedback system. For more information see: https://aka.ms/ContentUserFeedback.
Submit and view feedback for