Out Of Box widget catalog
Azure DevOps Services | Azure DevOps Server 2022 - Azure DevOps Server 2019
Widgets display information and charts on dashboards. Many widgets are configurable or are scoped to a team or to the logged in user account. Many display information available from one or more data stores or charts maintained within the system. You add a widget to a dashboard or copy a widget from one dashboard to another. For more information, see Add a widget to a dashboard.
For example, you can add the Build History widget from the dashboard's Add widget dialog.
This article provides a quick reference of all out of box (OOB) widgets that you can add to your dashboard. In addition to these widgets, you might find more widgets in the Marketplace or create your own.
Supported OOB widgets
Widgets listed in the following table are provided out-of-box. They're organized under the service they support. Widgets are annotated as follows:
- Analytics: Widget derives data from Analytics data
- Build: Widget derives data for a selected build pipeline
- Project: indicates you can select the project and team when configuring the widget
- Release: Widget derives data for a selected release pipeline
- Team: Widget is scoped to a single team
- Teams: Widget is scoped to one or more teams
- User: Widget is scoped to the logged in user account
Boards
- Assigned to me (User)
- Burndown chart (Analytics, Project, Teams)
- Burnup chart (Analytics, Project, Teams)
- Chart for work items
- Cumulative flow diagram (Team)
- Cycle time (Analytics) (Analytics, Team)
- Lead time (Analytics) (Analytics, Team)
- New Work item
- Query results
- Query tile
- Sprint burndown (Analytics, Team)
- Sprint burndown - Legacy (Team)
- Sprint capacity (Team)
- Sprint overview (Team)
- Velocity (Analytics, Team)
- Work links
Boards
- Assigned to me (User)
- Burndown chart (Analytics, Teams)
- Burnup chart (Analytics, Teams)
- Chart for work items
- Cumulative flow diagram (Team)
- Cycle time (Analytics) (Analytics, Team)
- Lead time (Analytics) (Analytics, Team)
- New Work item
- Query results
- Query tile
- Sprint burndown (Team)
- Sprint capacity (Team)
- Sprint overview (Team)
- Velocity (Analytics) (Team)
- Work links
Code
- Code tile (Repository, Branch, Folder)
- Pull request (Team)
Pipelines
- Build history (Build pipeline)
- Deployment status (Build pipeline)
- Release pipeline overview (Release pipeline)
- Requirements quality (Query, Build or Release pipeline)
Test Plans
- Chart for test plans
- Test results trend (Advanced) (Analytics, Build or Release pipeline)
- Test results trend (Build or Release pipeline)
Information and links
Prerequisites
- To add widgets to a dashboard, you must be a member of a project. If you aren't a project member, get added now.
- To add widgets from the marketplace, you must be a member of the Project Collection Administrators group.
- To add, edit, or manage a dashboard, you must have Basic access or greater.
Note
Data displayed within a chart or widget is subject to permissions granted to the signed in user. For more information, see FAQs on Azure DevOps dashboards, charts, and reports, Access and permissions.
Azure Boards widgets
Add work tracking widgets to your dashboards to show status, progress, or trends. You use work items to plan and track work.
In addition to the widgets listed here, you can add a work item query chart to your dashboard. For more information, see Track progress with status and trend query-based charts.
Assigned to me
Burndown chart
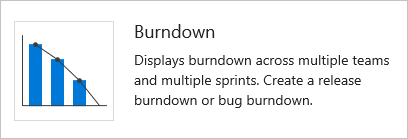
Adds a tile that displays a burndown chart that you can configure to span one or more teams, work item types, and time period. With it, you can create a release burndown, sprint burndown, or any burndown that spans teams and sprints.
For more information, see Configure a burndown or burnup widget.
Burnup chart
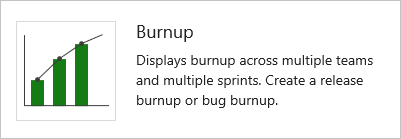
Adds a tile that displays a burnup chart that you can configure to span one or more teams, work item types, and time period. With it, you can create a release burnup, sprint burnup, or any burnup that spans teams and sprints.
For more information, see Configure a burndown or burnup widget.
Chart for work items
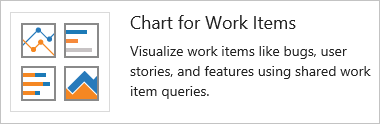
Adds a tile to display a progress or trend chart that builds off a shared work item query.
From the configuration dialog, select a shared query and specify the chart type and values.
Cumulative flow diagram
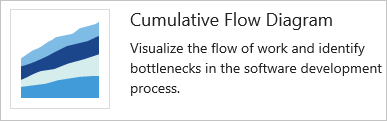
Displays the cumulative flow of backlog items based on the time frame, team, backlog level, and swimlane you select. Hover over each color within the chart to see the count of items for a particular board column.
From the configuration dialog, specify the team, backlog level, and other parameters you want.
Cycle time
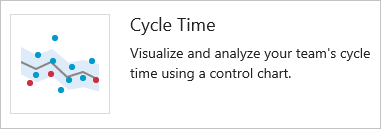
Displays the cycle time of work items closed in a specified timeframe for a single team and backlog level. The cycle time of a work item is defined as the time taken to close a work item after work on it begins. Each marker on the chart corresponds to one or more work items with a particular cycle time. The lower the cycle time, the faster work is progressing through your development pipeline.
For more information, see Lead time and cycle time control charts.
Lead time
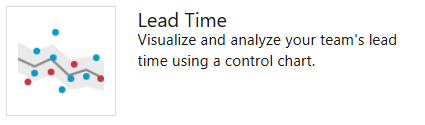
Displays the lead time of work items closed in a specified timeframe for a single team and backlog level. The lead time of a work item is defined as the time taken to close a work item after it was created. Each marker on the chart corresponds to one or more work items with a particular lead time. The lower the lead time, the faster work is being delivered to the customer.
For more information, see Lead time and cycle time control charts.
New Work item
Enables you to add work items from the dashboard. Work items that you add using this widget are automatically scoped to the team's default **Area Path**. The **Iteration Path** assigned matches the last **Iteration Path** assigned to a work item by the currently signed in user.
To change team defaults, see About teams and Agile tools.
Query results
Adds a configurable tile that lists the results of a shared query. From the configuration dialog, select either a team favorite or shared query.
To create a shared query, see Use the query editor to list and manage queries.
Query tile
Adds a configurable tile to display the summary of shared query results. From the configuration dialog, select either a team favorite or shared query. You can optionally specify rules to change the query tile color based on the number of work items returned by the query.
To create a shared query, see Use the query editor to list and manage queries.
Sprint burndown (Analytics)
Adds a team's burndown chart for a sprint to the dashboard. This widget is based on Analytics data. You have several configuration options for this widget, including selecting a team, iteration, and time period.
Teams use the burndown chart to mitigate risk and check for scope creep throughout the sprint cycle.
Sprint burndown (Legacy)
Adds the team's burndown chart for the current sprint to the dashboard. This chart always displays data for the current sprint.
Teams use the burndown chart to mitigate risk and check for scope creep throughout the sprint cycle.
Sprint burndown
Adds the team's burndown chart for the current sprint to the dashboard. This chart always displays data for the current sprint.
Teams use the burndown chart to mitigate risk and check for scope creep throughout the sprint cycle.
Sprint capacity
Inserts the team's capacity bar chart for the current sprint. To plan and monitor their sprint resources, team set capacity and update Remaining Work throughout the sprint.
See Set capacity.
Sprint overview
Inserts a configurable overview of sprint progress. You can choose between a count of story points or number of work items. Also, selecting the Show non-working days checkbox indicates to count all remaining days in the sprint, regardless of the days the team has selected as days off.
Teams plan their sprints by defining sprints and assigning backlog items to an iteration.
Velocity
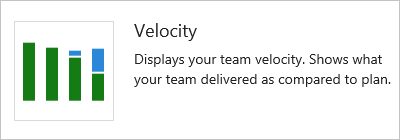
The Velocity widget tracks a team's capacity to deliver work sprint after sprint. You configure the widget by selecting a team, a work item type, an aggregation field, and the number of sprints. The widget takes advantage of Analytics data. You can track the velocity for a single team, not multiple teams.
For additional guidance, see Velocity.
Work links
Azure Repos widgets
Add code tracking widgets to track changes made within a repository or get quick access to Git pull requests for your team.
Code tile

Pull request
Adds a configurable widget to display active PRs requested by the team, or assigned to or requested by the person logged in. Select the team and Git repository for the pull requests of interest.
For more information, see Review code with pull requests.
Pull request (multiple repos)
Adds a configurable widget to display active PRs requested by the team, or assigned to or requested by the person logged in. Select the team and up to 10 repositories for the pull requests of interest.
For more information, see Review code with pull requests.
This widget is currently in private preview
Azure Pipelines widgets
Add build and release pipeline widgets to track the health of your builds and releases.
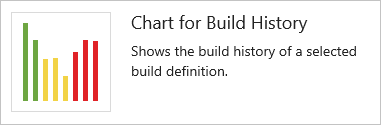
Build history
Adds a tile to display a histogram of all builds run for the configured build pipeline. From the configuration dialog, select the build you want to monitor. Hover over a bar to learn how long the build took to complete. Select the bar to open the summary for that specific build. Bar color indicates: green-completed, red-failed, and yellow-completed without tests.
Deployment status
Configurable widget that shows a combined view of the deployment status and test pass rate across multiple environments for a recent set of builds. You configure the widget by specifying a build pipeline, branch, and linked release pipelines. To view the test summary across multiple environments in a release, the widget provides a matrix view of each environment and corresponding test pass rate.
You can choose any cell to see a more detailed view for the selected environment.
Release pipeline overview
Configurable widget that you can use to view and track the status of a release pipeline. This widget shows the release as a series of environments, with the name of the release and the date or time it was started.
The color of the heading and the icon in each environment indicate the current status of the release, which are the same as are used on the Releases page. Select a release pipeline in the left column to filter the list to just releases for that pipeline.
Requirements quality
Configurable widget that you can use to track quality continuously from a build or release pipeline. The widget shows the mapping between a requirement and latest test results executed against that requirement. It provides insights into requirements traceability. For example, requirements not meeting the quality, requirements not tested, and so on.
For more information, see Requirements traceability
Azure Test Plans widgets
Add test tracking widgets to your dashboards to show status, progress, or trends of your testing efforts. In addition to the widgets listed here, you can add test tracking charts to your dashboard. For more information, see Track test status.
Chart for test plans
Adds a configurable widget that lets you track the progress of test case authoring or status of test execution for tests in a test plan. Get started by selecting a test plan and a test suite. Then select test case chart for test authoring progress or test results for test execution progress. Finally, select the chart type and the pivots.
For more information, see Track your test results.
Test results trend
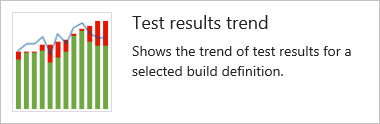
Adds a configurable tile that displays the trend of test results for the selected build or release pipeline. The widget helps you visualize the test trends over a period of time, thereby surfacing patterns about test failures, test duration etc.
From the configuration dialog, select the build or release whose test results you'd like to monitor. There are multiple chart options to choose from (Line, Column & Stacked Column) based on your preference. Optionally you can map the trend of test duration on the existing chart by adding a secondary line chart.
To get deeper insights and higher configurability view Test Analytics
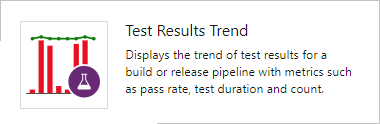
The Test Results Trend (Advanced) widget provides near real-time visibility into test data for multiple builds and releases. The widget shows a trend of your test results for selected pipelines. You can use it to track the daily count of test, pass rate, and test duration. Tracking test quality over time and improving test collateral is key to maintaining a healthy DevOps pipeline. The widget supports tracking advanced metrics for one or more build pipelines or release pipelines. The widget also allows filtering of test results by outcome, stacking metrics, and more.
For more information, see Configure the Test Results Trend (Advanced) widget.
Informational content and other links
Add one or more of the following widgets to support adding:
- Configurable content
- Links to features
- Functions your team accesses often
Embedded web page
Adds a configurable tile to display the contents of a web page. The page displayed is interactive.
Only webpages that allow iframe embedding are supported.
Markdown
Adds a configurable tile to display any type of information, guidance, or links that you want. You can also configure the widget to point to a file stored in your repository. From the configuration dialog, add the information you want to share with your team.
For more information, see Add Markdown to a dashboard.
Other links
Team members
Shows team member profiles and, on-hover, their user alias.
For team admins, supports access to the quick dialog to add or remove team members.
Note
This widget is a convenient way to add team members to specific teams within projects. If you remove it, you can still add members to your team from the team administration page.
Visual Studio Shortcuts
Provides links to open or download Visual Studio.
The Visual Studio IDE client comes with the Team Explorer plug-in which provides quick access to several features (some of which aren't available through the web portal).
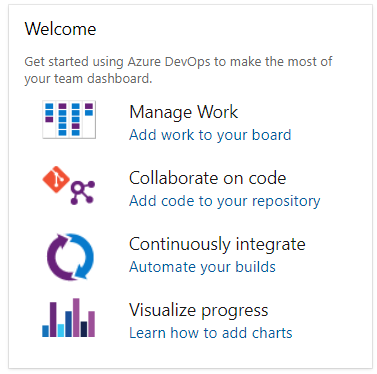
Welcome
Marketplace widgets
You might find more widgets of interest in the Marketplace.
If your organization owner or project collection administrator disables a marketplace widget, you see the following image:
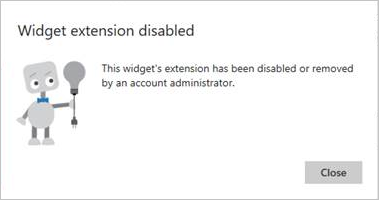
To regain access to it, request your admin to reinstate or reinstall the widget.
Extensibility
Using the REST API service, you can create a dashboard widget. To learn more about the REST APIs for dashboards and widgets, see Dashboards (API).
Related articles
Feedback
Coming soon: Throughout 2024 we will be phasing out GitHub Issues as the feedback mechanism for content and replacing it with a new feedback system. For more information see: https://aka.ms/ContentUserFeedback.
Submit and view feedback for